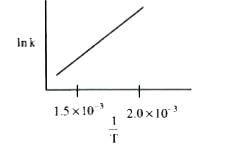
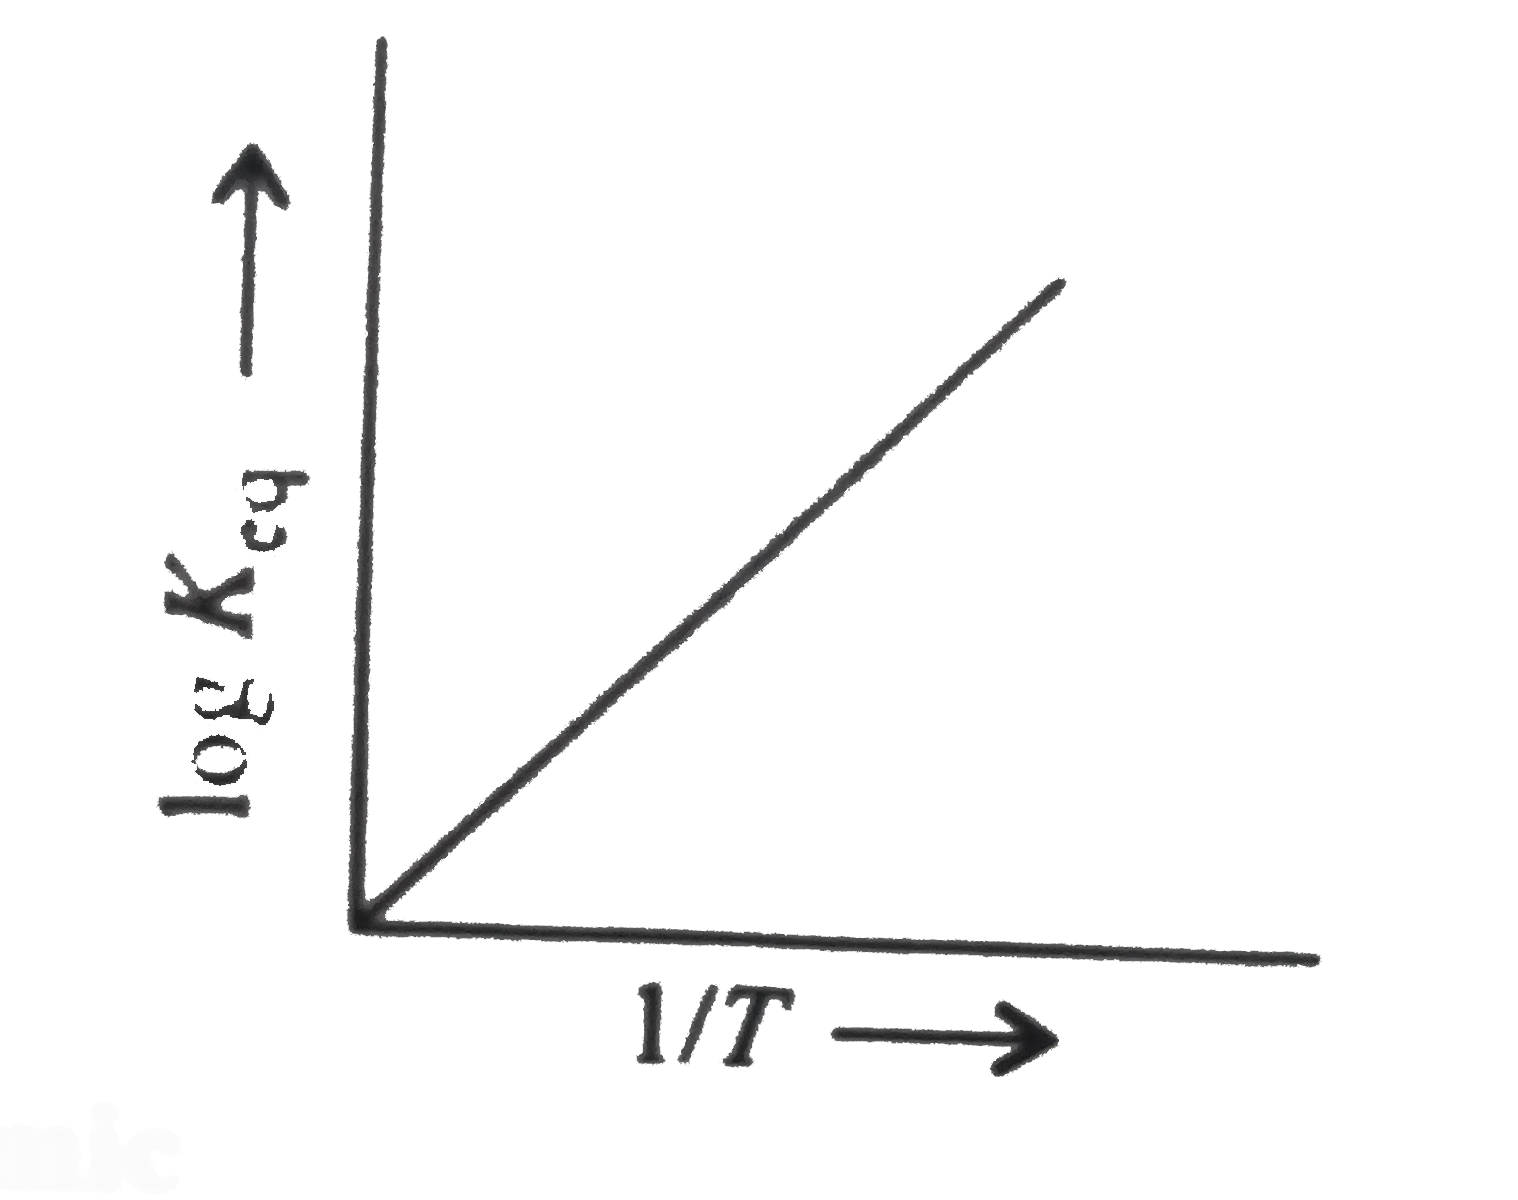
A schematic plot of InKeq versus inverse of temperature for a reaction is shown below

The reaction must be
highly spontaneous at ordinaty temperature
one with nigligible enthalpy change
endothermic
exothermic
The correct Answer is:D
The graph show that reactionn is exothermic
logk=−ΔHRT+1
For exothermic reaction ΔH<0
∴logkVs1T would be negative lin with positive slope.
Similar Questions
A schematic plot of In k_(eq) versus inverse of temperature for a reaction is shown below : The reaction must be :
View SolutionThe graph relates in Keq.VslT for a reaction. The reaction must be :

View SolutionA schematic plot of In K_(eq) versus inverse o ftemperature for a reaction is shown below the reaction must be:
View SolutionThe graph relates in K_(eq) Vs 1/T for a reaction. The reaction must be :
View SolutionA schematic plot of log Keq vs inverse of temperature for a reaction is shown in the figure. The reaction must be:

View SolutionIn a second order reaction, the plot of 1/(a−x) versus t is a straight line.
View SolutionFor a first-order reaction, the plot of log[A]t, versus t is linear with a →
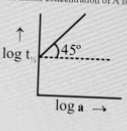
View SolutionFor a reaction A→ Products, a plot of logt12 ,versus log a is shown in figure. If the initial concentration of A is represented by a ,the order of the reaction is:-

View Solution

