Following data gives the number of children in 40 families: 1,2,6,5,1,5,1,3,2,6,2,3,4,2,0,0,4,4,3,2 2,0,0,1,2,2,4,3,2,1,0,5,1,2,4,3,4,1,6,2 Represent it in the form of a frequency distribution.
Solution given in graph
Similar Questions
Following data gives the number of children in 40 families: 1,2,6,5,1,5,1,3,2,6,2,3,4,2,0,4,4,3,2,2,0,0,1,2,2,4,3,2,1,0,5,1,2,4,3,4,1,6,2,2. Represent it in the form of a frequency distribution, taking classes 0−2, 2−4, etc.
View SolutionFollowing data gives the number of children in 40 families: 1,2,6,5,1,5,1,3,2,6,2,3,4,2,0,0,4,4,3,2 2,0,0,1,2,2,4,3,2,1,0,5,1,2,4,3,4,1,6,2 Represent it in the form of a frequency distribution.
View SolutionFollowing data gives the number of children in 40 families: 1,2,6,5,1,5,1,3,2,6,2,3,4,2,0,0,4,4,3,2,2,0,0,1,2,2,4,3,2,1,0,5, 1,2,4,3,4,1,6,2,2 Represent it in the form of a frequency distribution.
View SolutionFind the mean and standard deviation for the following frequency distribution:
The follwing table gives the income of 100 families . Find the variance for the data.

View SolutionOut of 10000 families with 4 children each, find the frequencies of distribution of number of male children.
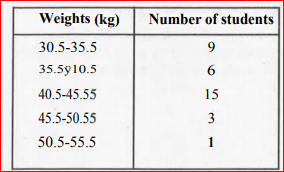
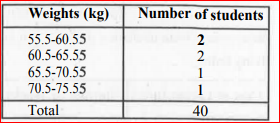
View SolutionConsider the following frequency distribution table representing the weights of 40 students of a class .

 Draw a histogram to represent the above data.
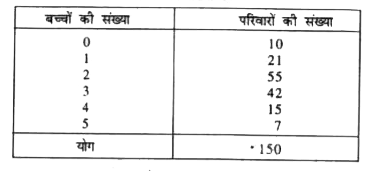
View Solutionकिसी गांव के 150 परिवारों में बच्चों की संख्या को निम्न बारंबारता सारणी में दर्शाया गया है :

प्रति परिवार बच्चों की औसत संख्या ज्ञात कीजिए ।
View SolutionThe following data shows the number of children in 20 families

Make a frequency table for above data
View Solution
