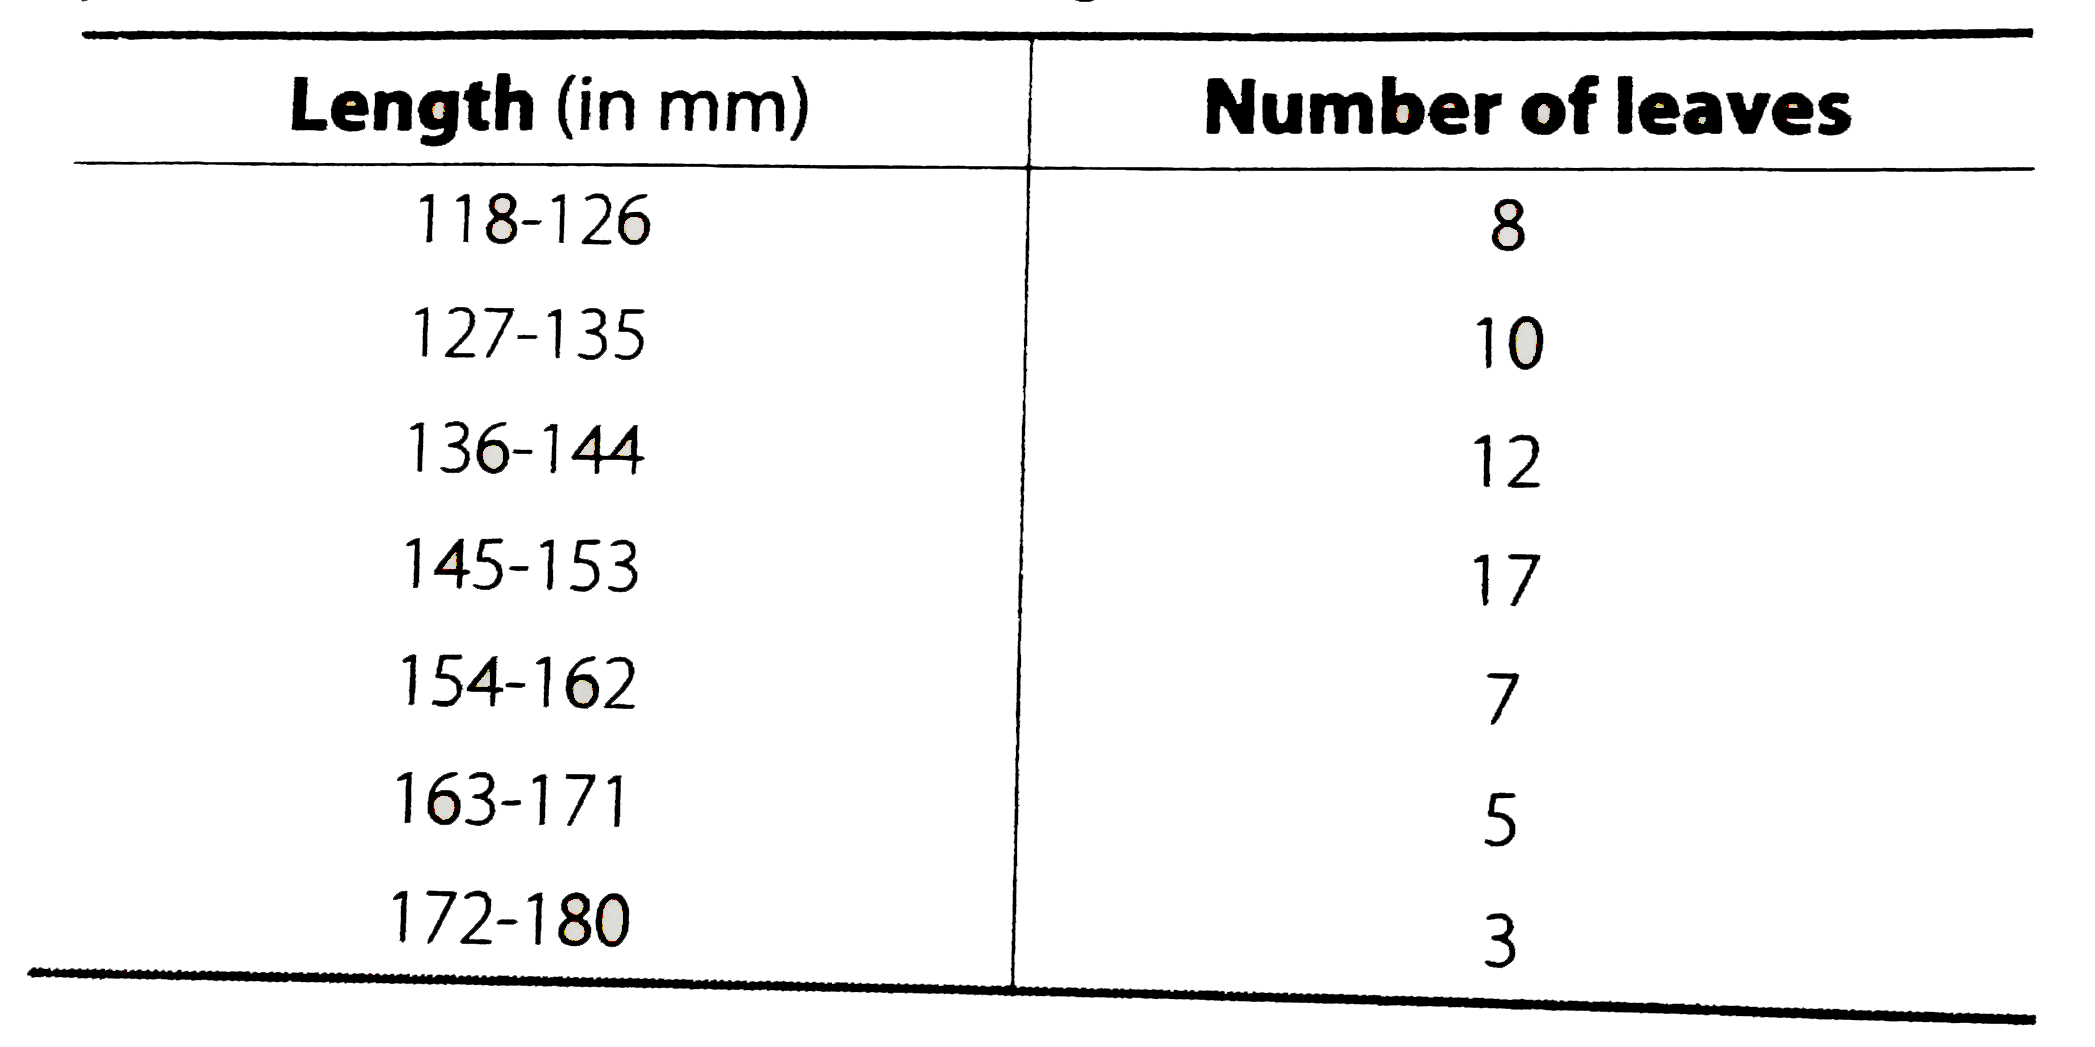
Represent
the following data by means of historgram.

Video Solution
Text Solution
Since the class intervals are of unequal width, we use Adjusted Frequency
Adjusted Frequency= (Minimum class sizeclass size)×Frequency of class


|
Topper's Solved these Questions
Similar Questions
Knowledge Check
The mean of the following data is
 A49.5B50.5C51.5D55.5
Represent the following data using a histogram.

View SolutionThe marks obtained by 60 students of a class in a methematics test are given

Represent the above data by means of a histogram.
View SolutionRepresent the following data by frequency curve :

View SolutionThe lengths of 62 levels of a plant are measured in millimetres and the data is represented in the following table

Draw a histrogram to represent the data above.
View SolutionFind the mean of the following data.

View SolutionFind the mean for the following data

View SolutionFind the mean of the following data.

View Solution


