The following table shows the number of Maruti cars sold by the five dealers in a particular month: Dealer, Saya, Bagga Links, D.D. Motors, Bhasin Motor, Competent Motors Cars sold, 60, 40, 20, 15, 10 Represent the above information by a pictograph.
To represent the number of Maruti cars sold by the five dealers in a pictograph, we will follow these steps:
Step 1: Understand the Data
We have the following data for the number of cars sold by each dealer:
- Saya: 60 cars
- Bagga Links: 40 cars
- D.D. Motors: 20 cars
- Bhasin Motor: 15 cars
- Competent Motors: 10 cars
Step 2: Decide the Symbol for the Pictograph
We will use a car symbol (🚗) to represent the cars sold. To make it easier, we can represent 10 cars with one car symbol.
Step 3: Calculate the Number of Symbols for Each Dealer
- Saya: 60 cars = 60/10 = 6 symbols (🚗🚗🚗🚗🚗🚗)
- Bagga Links: 40 cars = 40/10 = 4 symbols (🚗🚗🚗🚗)
- D.D. Motors: 20 cars = 20/10 = 2 symbols (🚗🚗)
- Bhasin Motor: 15 cars = 15/10 = 1.5 symbols (🚗 and half a symbol for 5 cars, which we can represent as 🚗½)
- Competent Motors: 10 cars = 10/10 = 1 symbol (🚗)
Step 4: Draw the Pictograph
Now we can draw the pictograph as follows:
Dealer Cars Sold
Saya 🚗🚗🚗🚗🚗🚗
Bagga Links 🚗🚗🚗🚗
D.D. Motors 🚗🚗
Bhasin Motor 🚗🚗½
Competent Motors🚗
Step 5: Review the Pictograph
Check to ensure that each dealer's representation accurately reflects the number of cars sold based on our calculations.
Final Pictograph Representation
Dea≤rCarsSoldSaya𐀀�𐀀�𐀀�𐀀�𐀀�𐀀�BaggaL∈ks𐀀�𐀀�𐀀�𐀀�D.D.Mo→rs𐀀�𐀀�BhasinMo→r𐀀�𐀀�½CompetentMo→rs𐀀�
We have the following data for the number of cars sold by each dealer:
- Saya: 60 cars
- Bagga Links: 40 cars
- D.D. Motors: 20 cars
- Bhasin Motor: 15 cars
- Competent Motors: 10 cars
We will use a car symbol (🚗) to represent the cars sold. To make it easier, we can represent 10 cars with one car symbol.
- Saya: 60 cars = 60/10 = 6 symbols (🚗🚗🚗🚗🚗🚗)
- Bagga Links: 40 cars = 40/10 = 4 symbols (🚗🚗🚗🚗)
- D.D. Motors: 20 cars = 20/10 = 2 symbols (🚗🚗)
- Bhasin Motor: 15 cars = 15/10 = 1.5 symbols (🚗 and half a symbol for 5 cars, which we can represent as 🚗½)
- Competent Motors: 10 cars = 10/10 = 1 symbol (🚗)
Now we can draw the pictograph as follows:
Dealer Cars Sold
Saya 🚗🚗🚗🚗🚗🚗
Bagga Links 🚗🚗🚗🚗
D.D. Motors 🚗🚗
Bhasin Motor 🚗🚗½
Competent Motors🚗
Check to ensure that each dealer's representation accurately reflects the number of cars sold based on our calculations.
Dea≤rCarsSoldSaya𐀀�𐀀�𐀀�𐀀�𐀀�𐀀�BaggaL∈ks𐀀�𐀀�𐀀�𐀀�D.D.Mo→rs𐀀�𐀀�BhasinMo→r𐀀�𐀀�½CompetentMo→rs𐀀�
Similar Questions
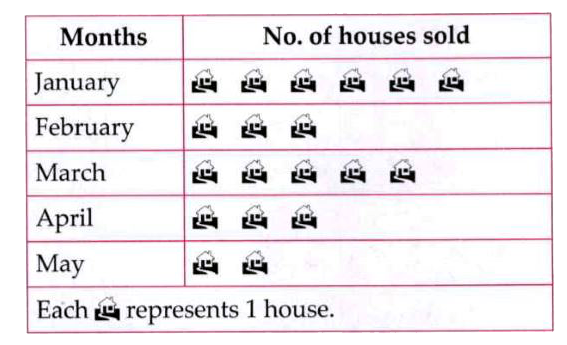
The given pictograph shows the sale of houses by a property dealer in different months.

How many houses did the dealer sold in February and March altogether ?
View SolutionMotor Car: Garage : : Aeroplane : ?
View SolutionThe number of months, in which the number of computers sold by dealer B was less than the average number of computers sold by dealer C over six months, is:
View SolutionThe bar graph shows the number of cars of different brands sold by a dealer in a month. Study the diagram and answer the following question. Units sold of which car brand were the second highest?
View SolutionThe bar graph shows the number of cars of different brands sold by a dealer in a month, Study the diagram and answer the following question. If the average price of a car sold by the dealer is Rs 5 lakhs then what is the sales (in Rs lakhs) of all the cars sold by the dealer in the month?
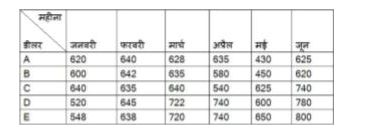
View Solutionदी गई तालिका का अध्ययन करें और प्रश्न का उत्तर दें।
2018 के पहले छह महीनों के दौरान A, B, C, D और E डीलरों द्वारा बेची गई कारों की संख्या।
जनवरी, अप्रैल और जून में डीलर B द्वारा बेची गई कारों की कुल संख्या और मार्च में डीलर A और D द्वारा बेची गई कारों की कुल संख्या का अनुपात ज्ञात करें।

View Solutionदी गई तालिका का अध्ययन करें और प्रश्न का उत्तर दें। 2018 के पहले छह महीनों के दौरान A, B, C, D और E डीलरों द्वारा बेची गई कारों की संख्या।

अप्रैल में डीलर B और E द्वारा बेची गई कारों की कुल संख्या का 80%, फरवरी में डीलर C और D द्वारा बेची गई कारों की संख्या से कितने प्रतिशत कम है?
View Solutionदी गई तालिका का अध्ययन करें और प्रश्न का उत्तर दें। 2018 के पहले छह महीनों के दौरान A, B, C, D और E डीलरों द्वारा बेची गई कारों की संख्या।

फरवरी, अप्रैल और मई में डीलर द्वारा बेची गई कारों की औसत संख्या, जनवरी में डीलर E द्वारा बेची गई कारों की संख्या से x अधिक है। x का मान ______ के बीच होगा।
View Solution