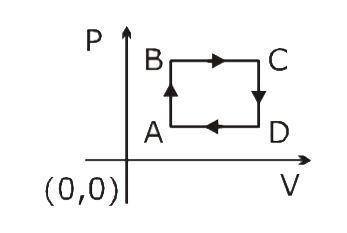
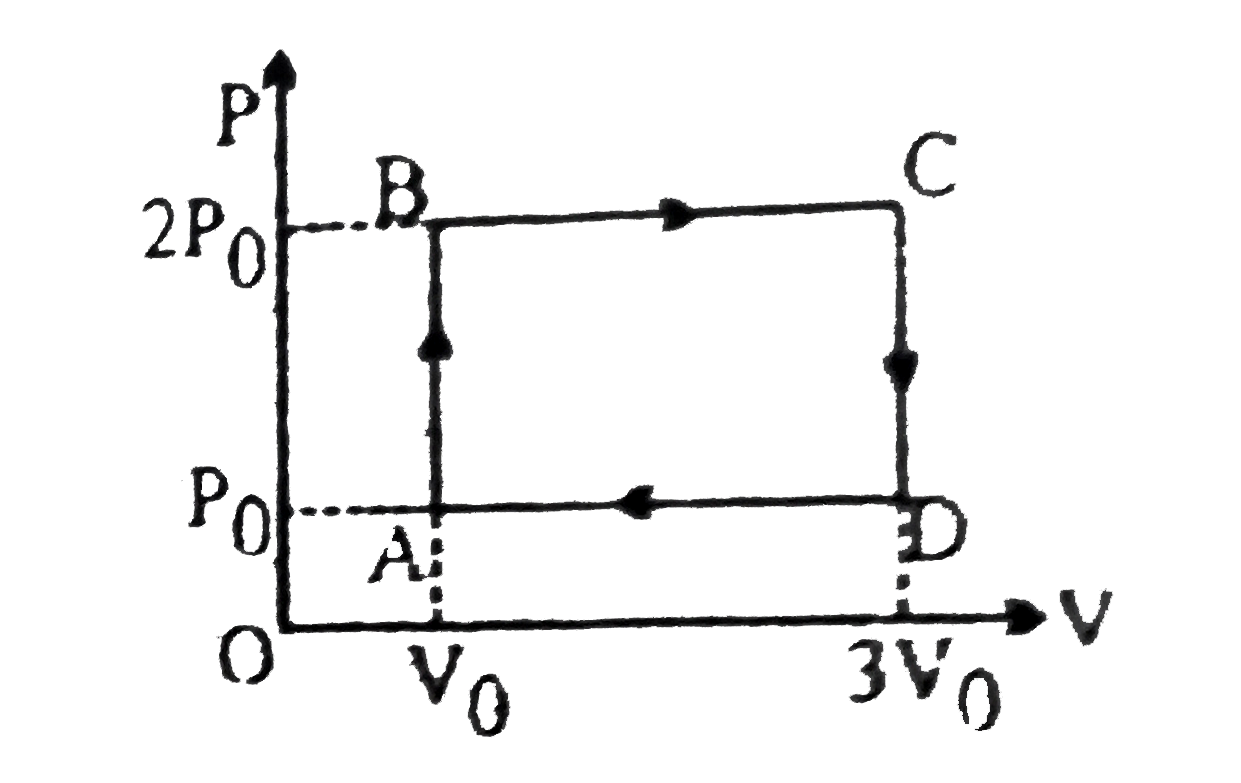
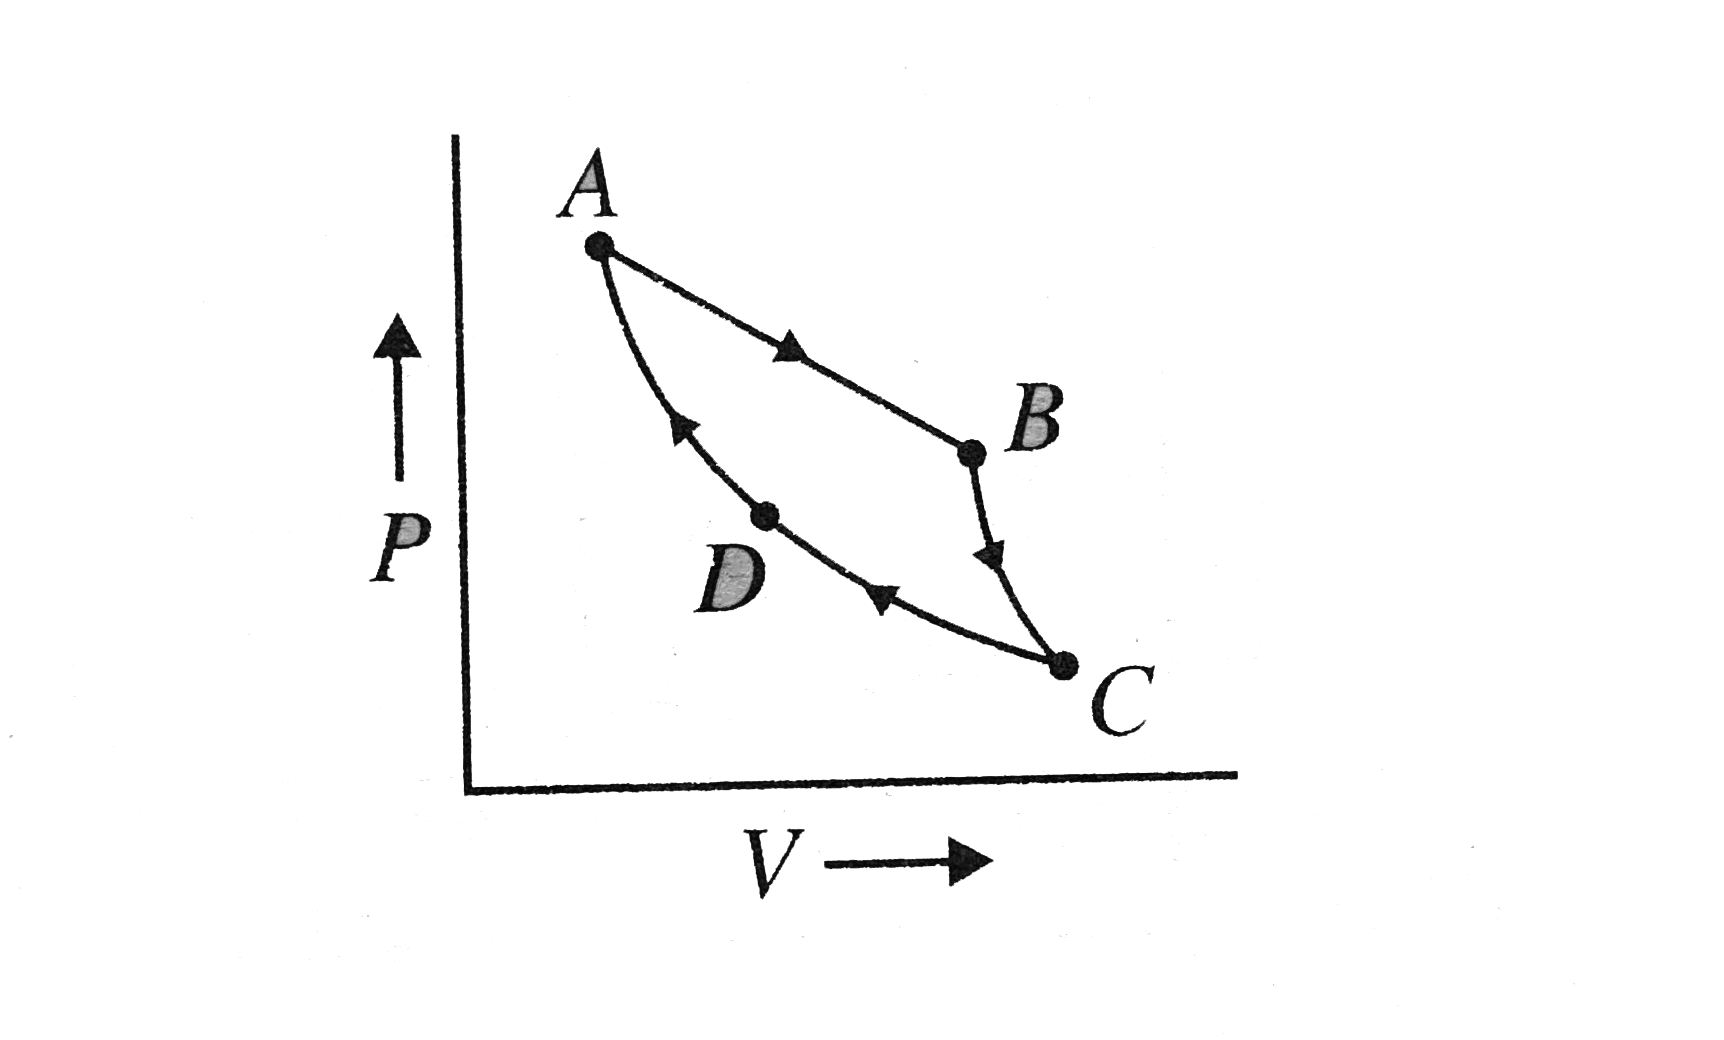
The figure shows P - V diagram of a thermodynamic cycle
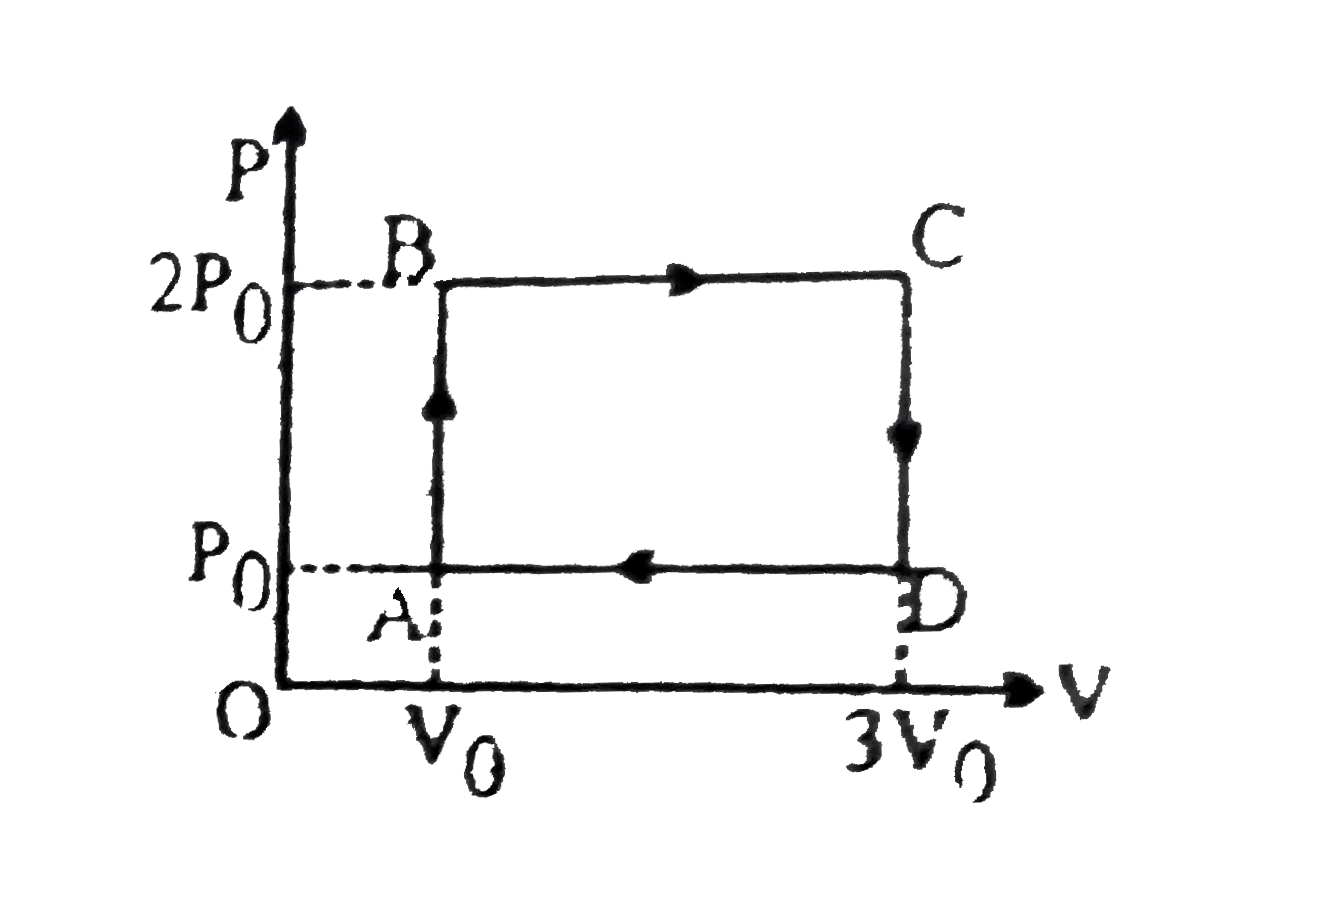
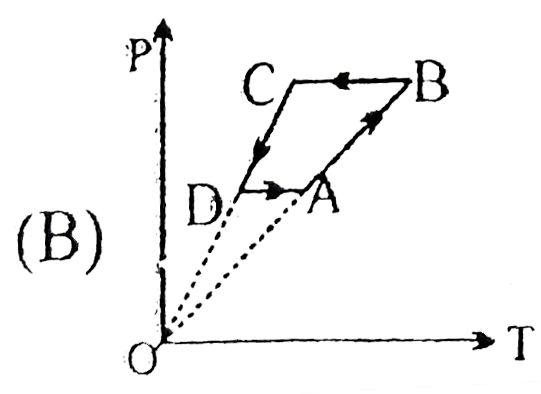
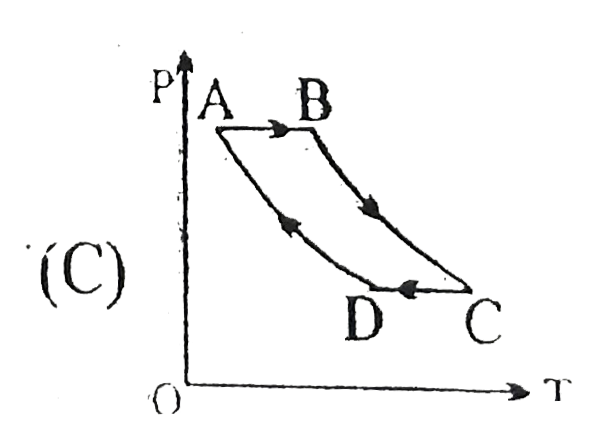
Choose the correct V - T diagram for the given cyclic process.
A
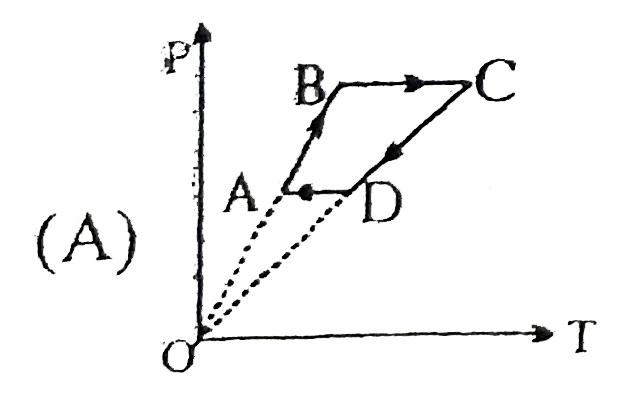
B
C
D
none of these
Video Solution
Text Solution
The correct Answer is:A
|
Answer
Step by step video, text & image solution for The figure shows P - V diagram of a thermodynamic cycle Choose the correct V - T diagram for the given cyclic process. by Physics experts to help you in doubts & scoring excellent marks in Class 12 exams.
Updated on:21/07/2023Similar Questions
Knowledge Check
The figure shows P - V diagram of a thermodynamic cycle
The work done in the cycle isA2P0V0B3P0V0CP0V0D6P0V0The figure shows P - V diagram of a thermodynamic cycle
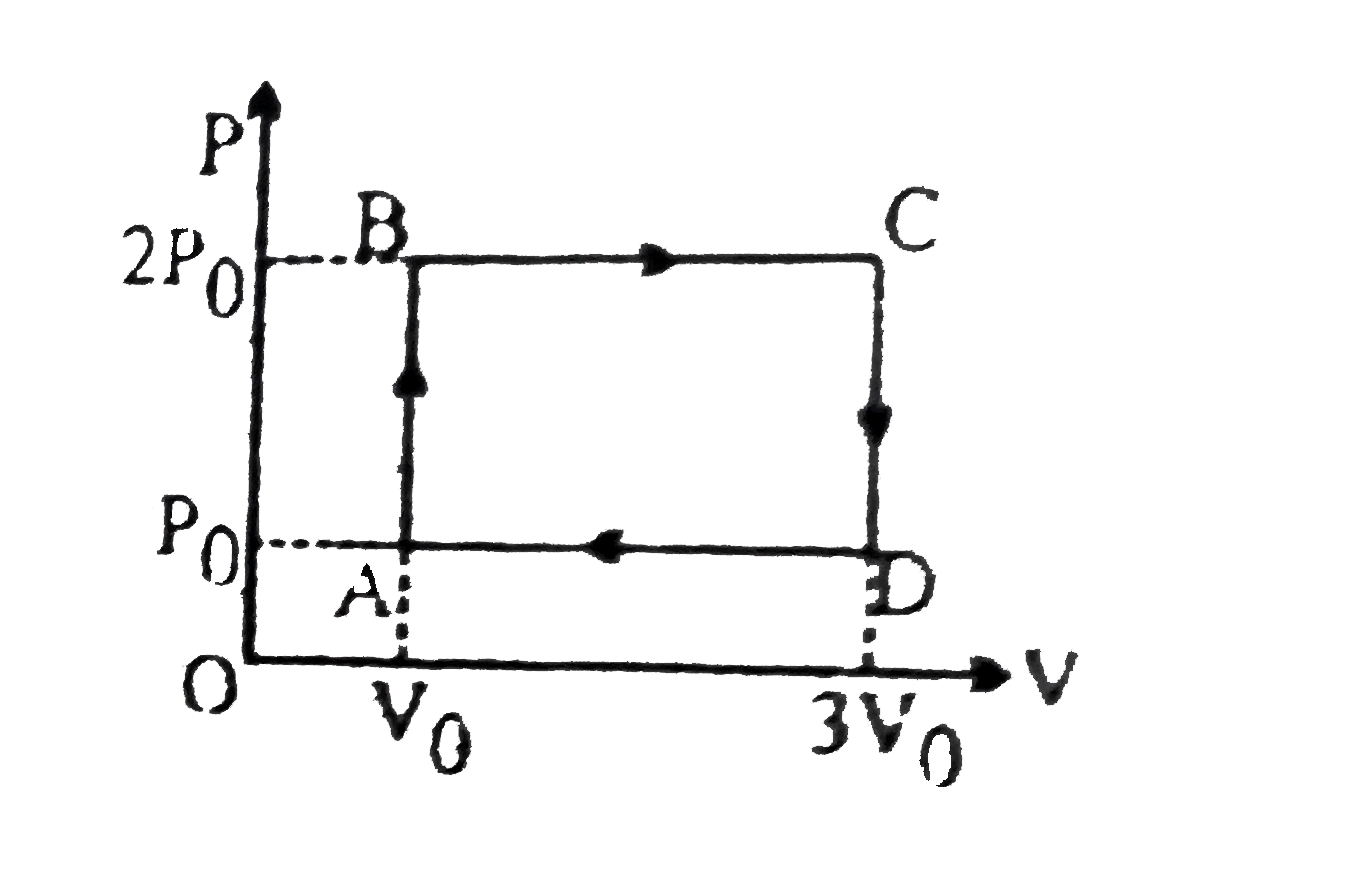
Identify the diagram which correctly represents the heat inflow and outflow of the systemA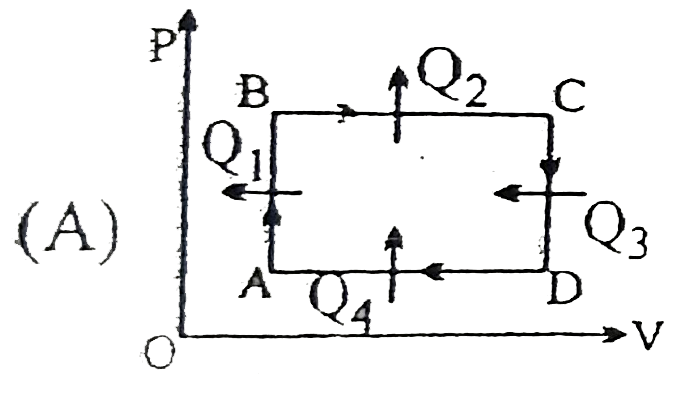 B
B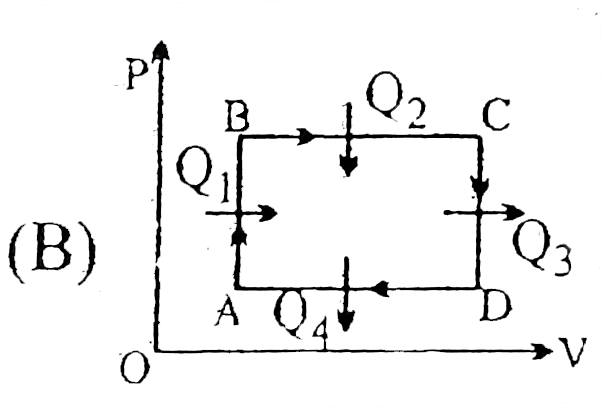 C
C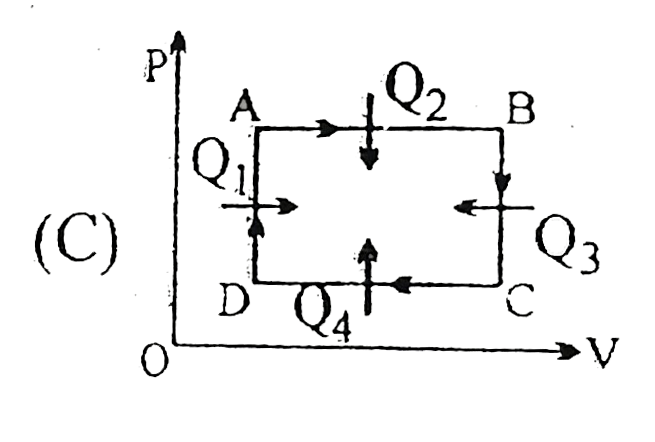 D
D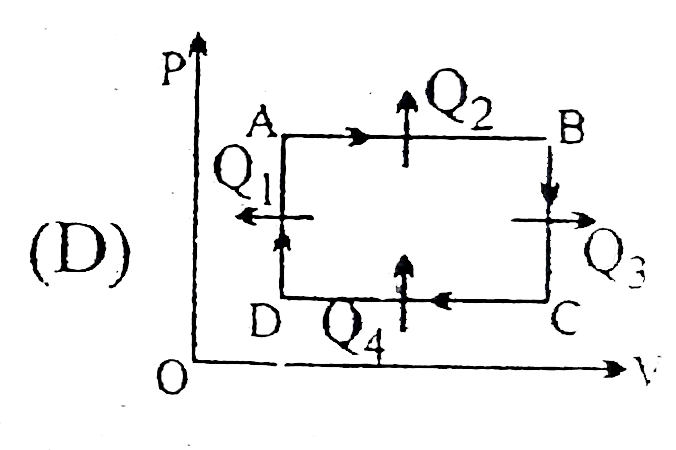
Work done in the given P - V diagram in the cyclic process is
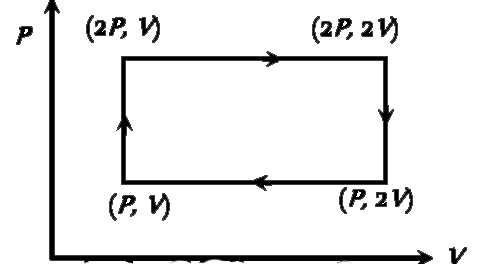 A2pB2PVCPV/2D3pv
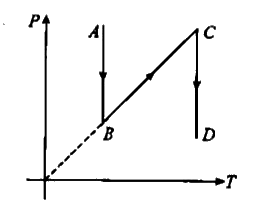
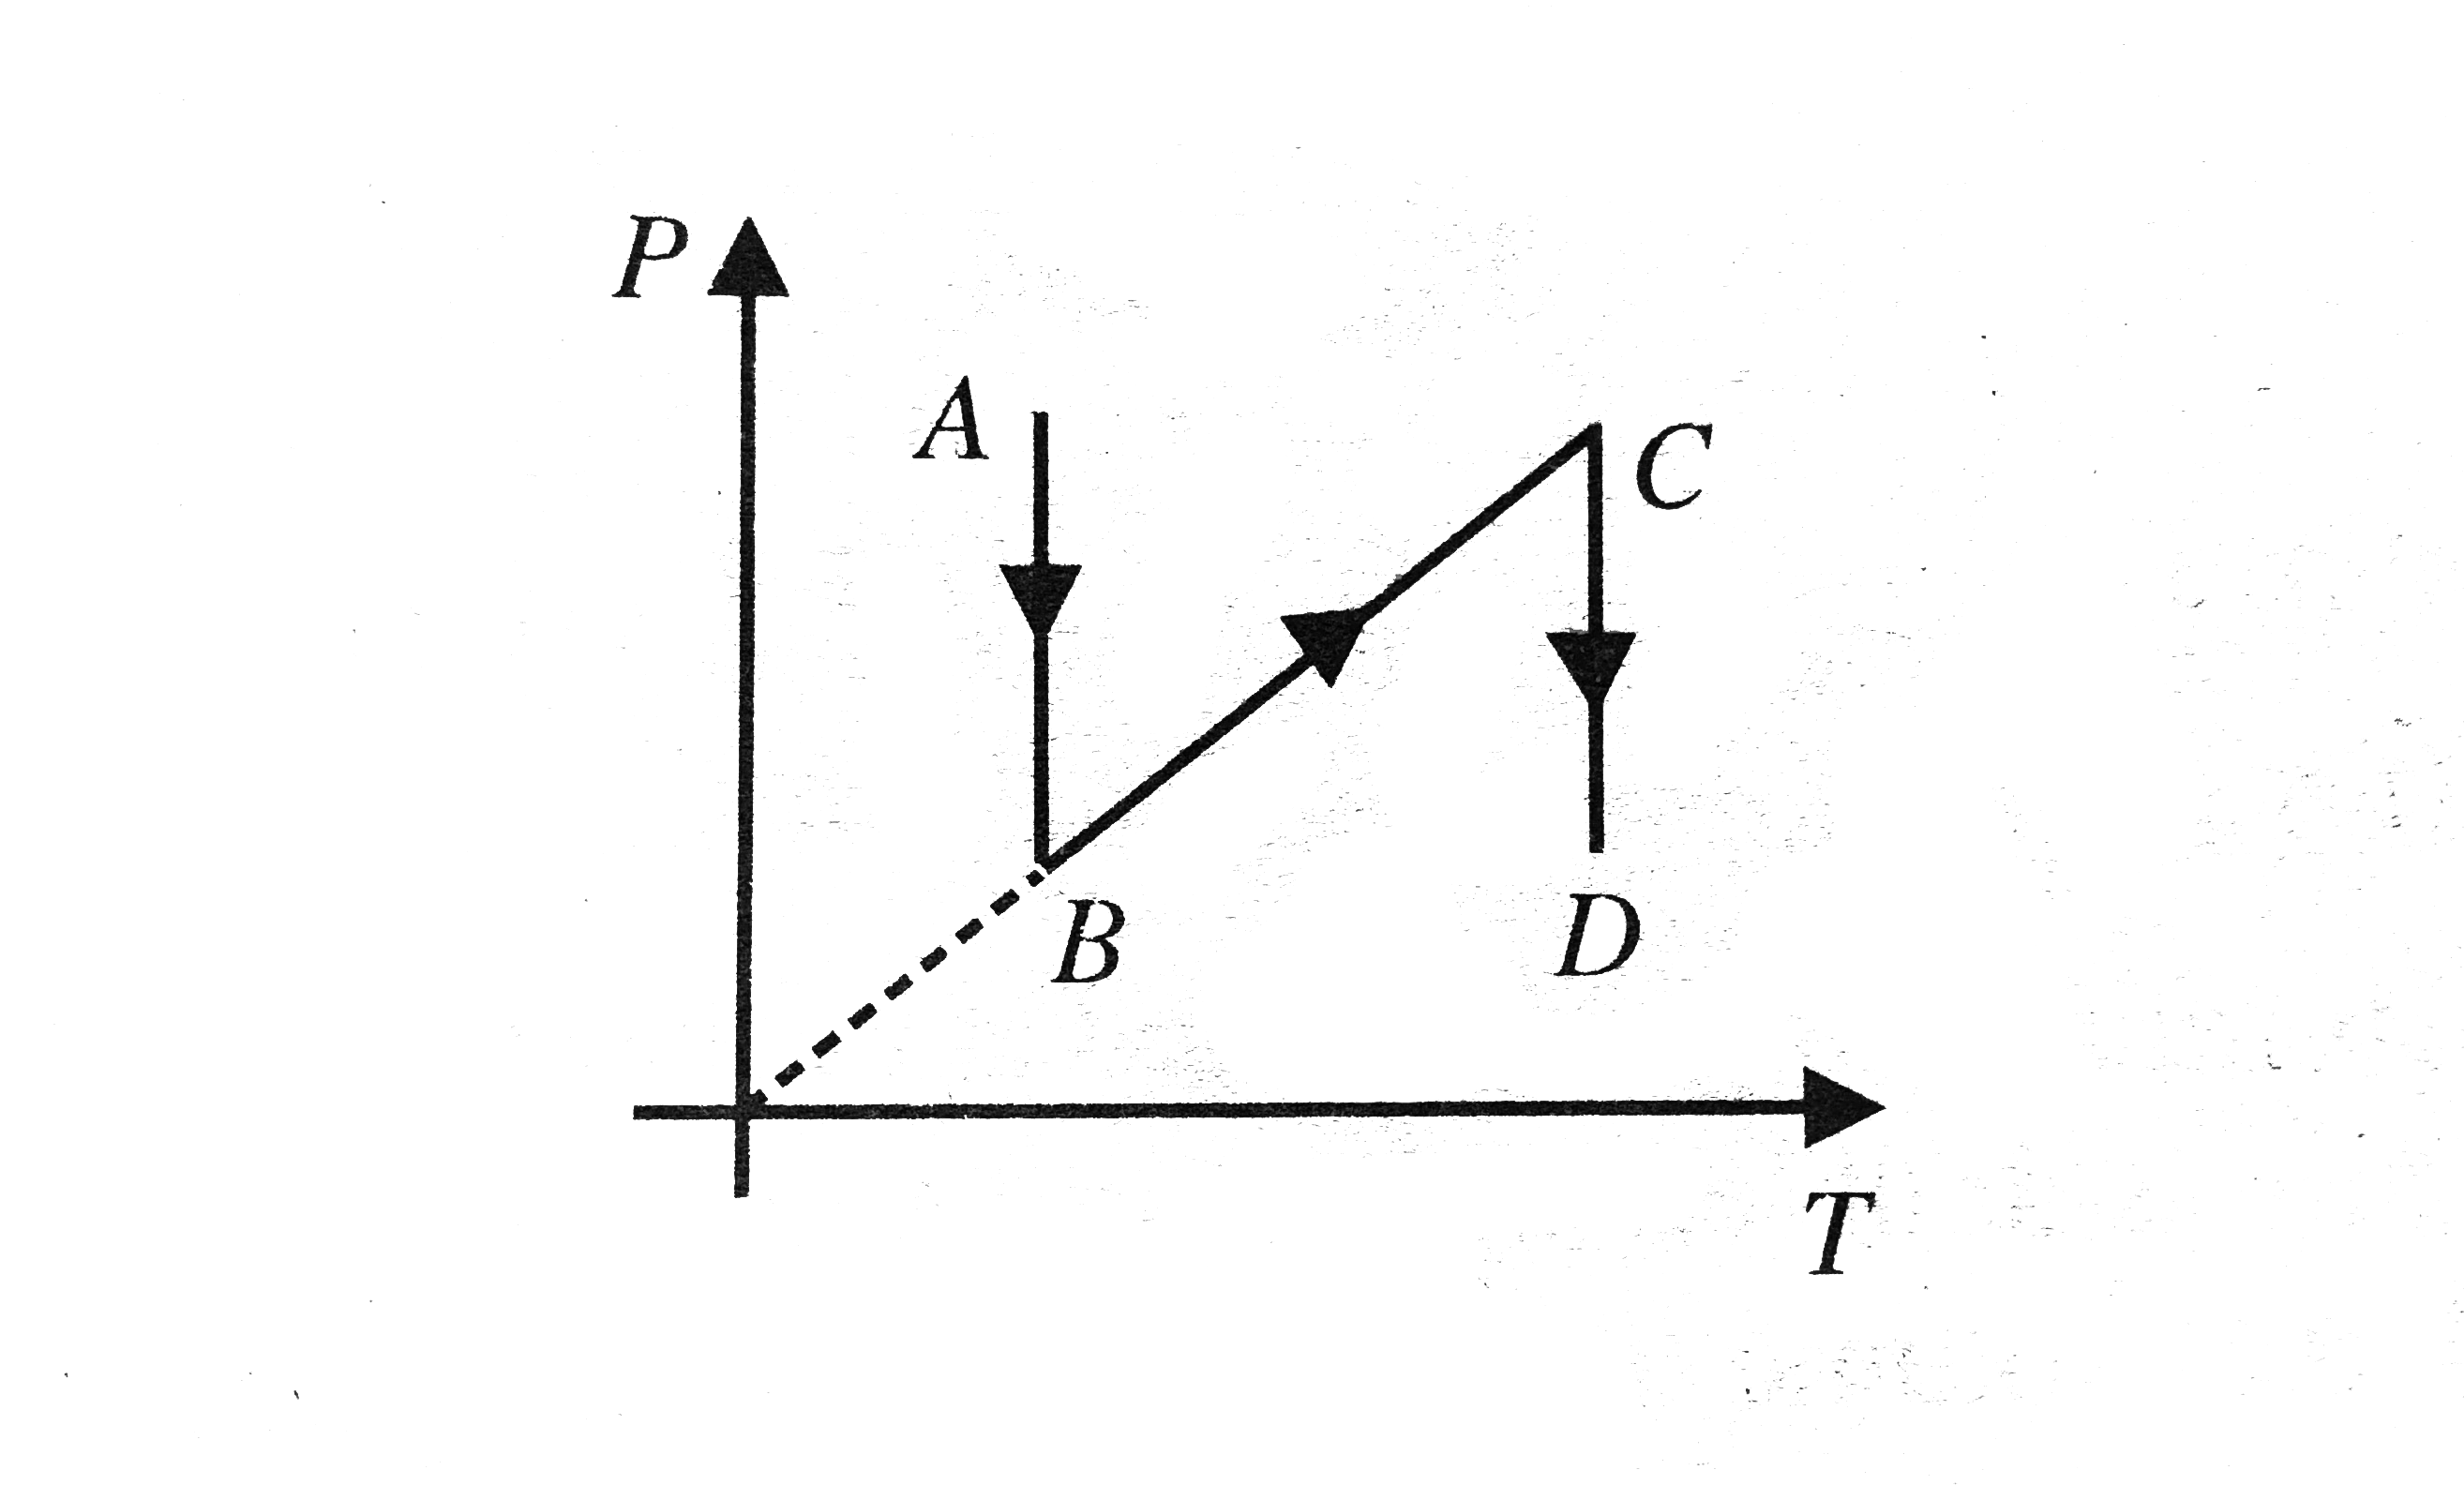
P−T diagram is shown in Fig. Choose the corresponding V−T diagram.
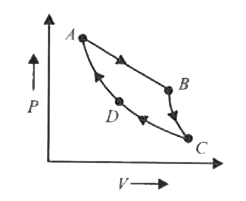
View SolutionThe given figure shows the P−Vdiagram for a Camot cycle. In this diagram,
View SolutionThe figure shows P - V diagram of a thermodynamic cycle
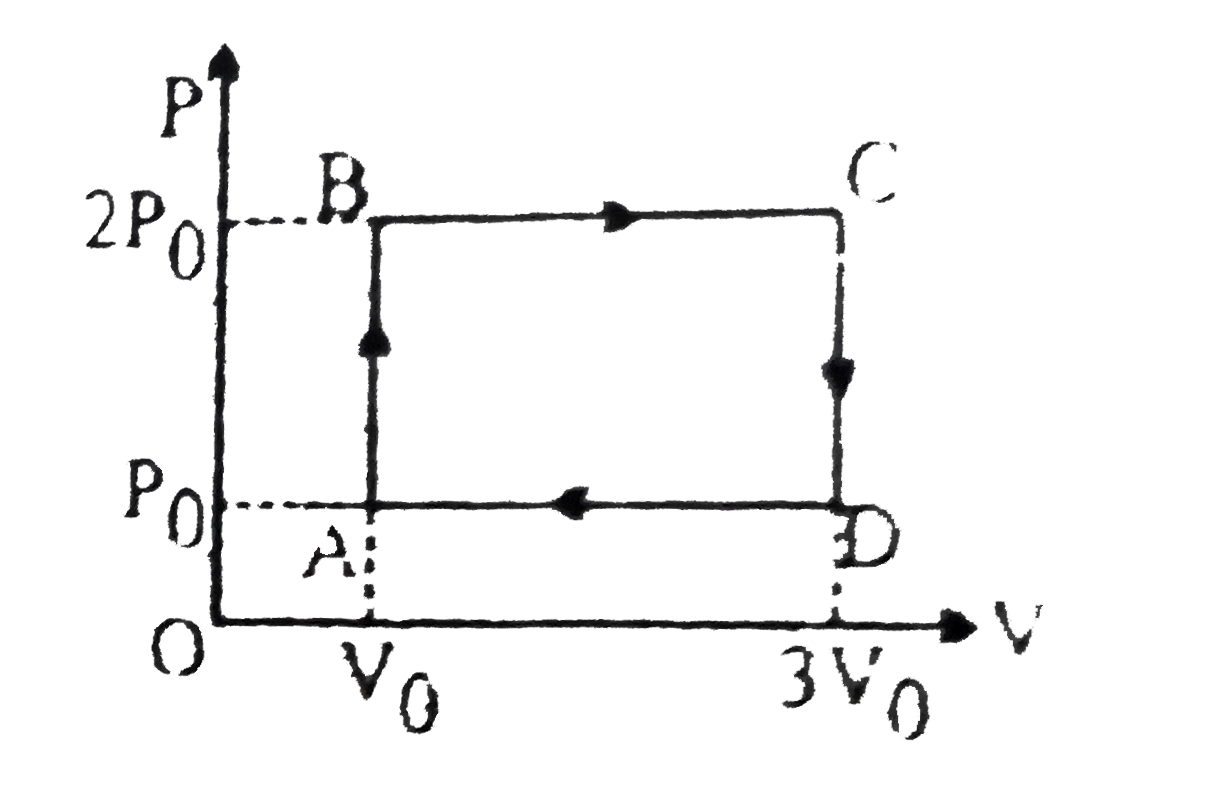
If TA,TB,TCandTD are the respective temperature at A,B,C and D. Then, choose the correct statement TA=T0
View SolutionFigure. Shows the P−V diagram for a Carnot cycle. In this diagram
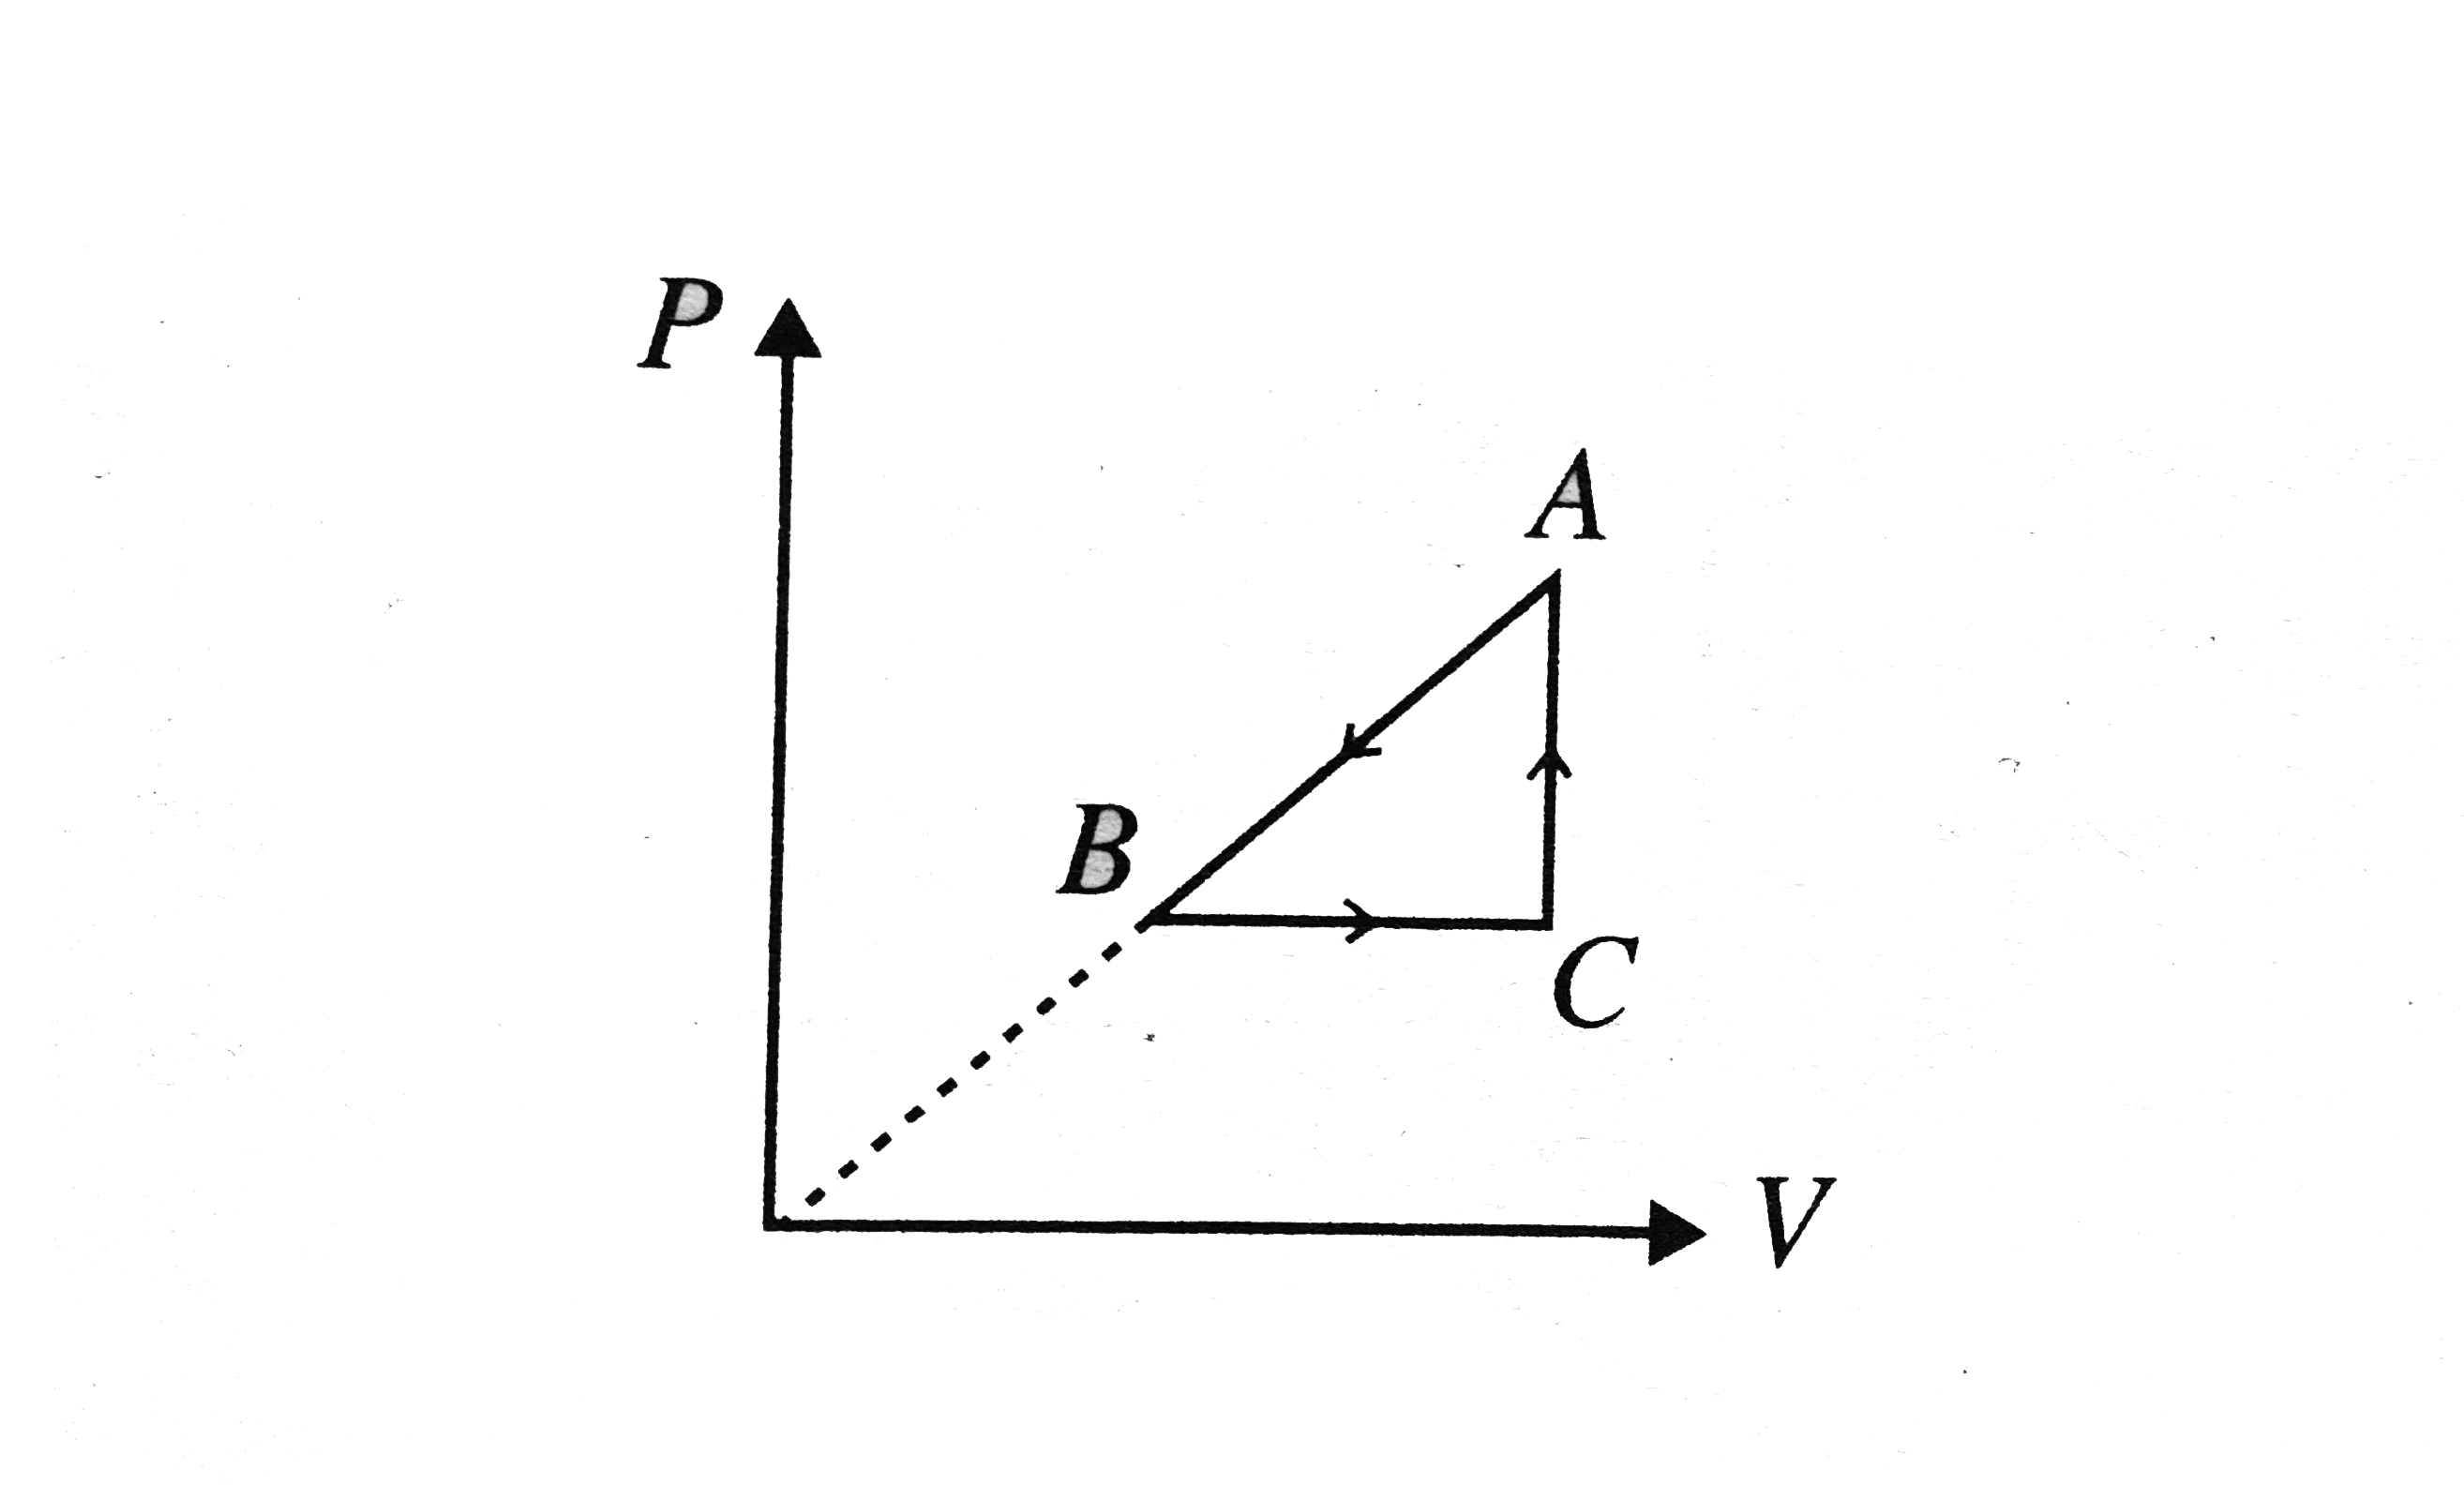
View SolutionP−V diagram of a cyclic process ABCA is as shown in Fig. Choose the correct alternative
View Solution

