Which graph represents the effect of pHk/temp on the velocity of a typical enzymatic reaction (V)


The correct Answer is:B
Step by step video, text & image solution for Which graph represents the effect of pHk/temp on the velocity of a typical enzymatic reaction (V) by Biology experts to help you in doubts & scoring excellent marks in Class 11 exams.
Updated on:21/07/2023Similar Questions
Knowledge Check
Which one of the graphs show the effect of temperature on the velocity of a typical enzymatic reaction?
A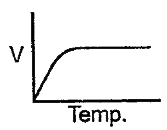 B
B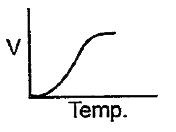 C
C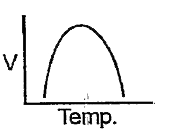 D
D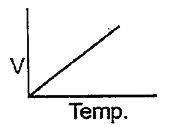
Which graph represents an objects at rest ?
A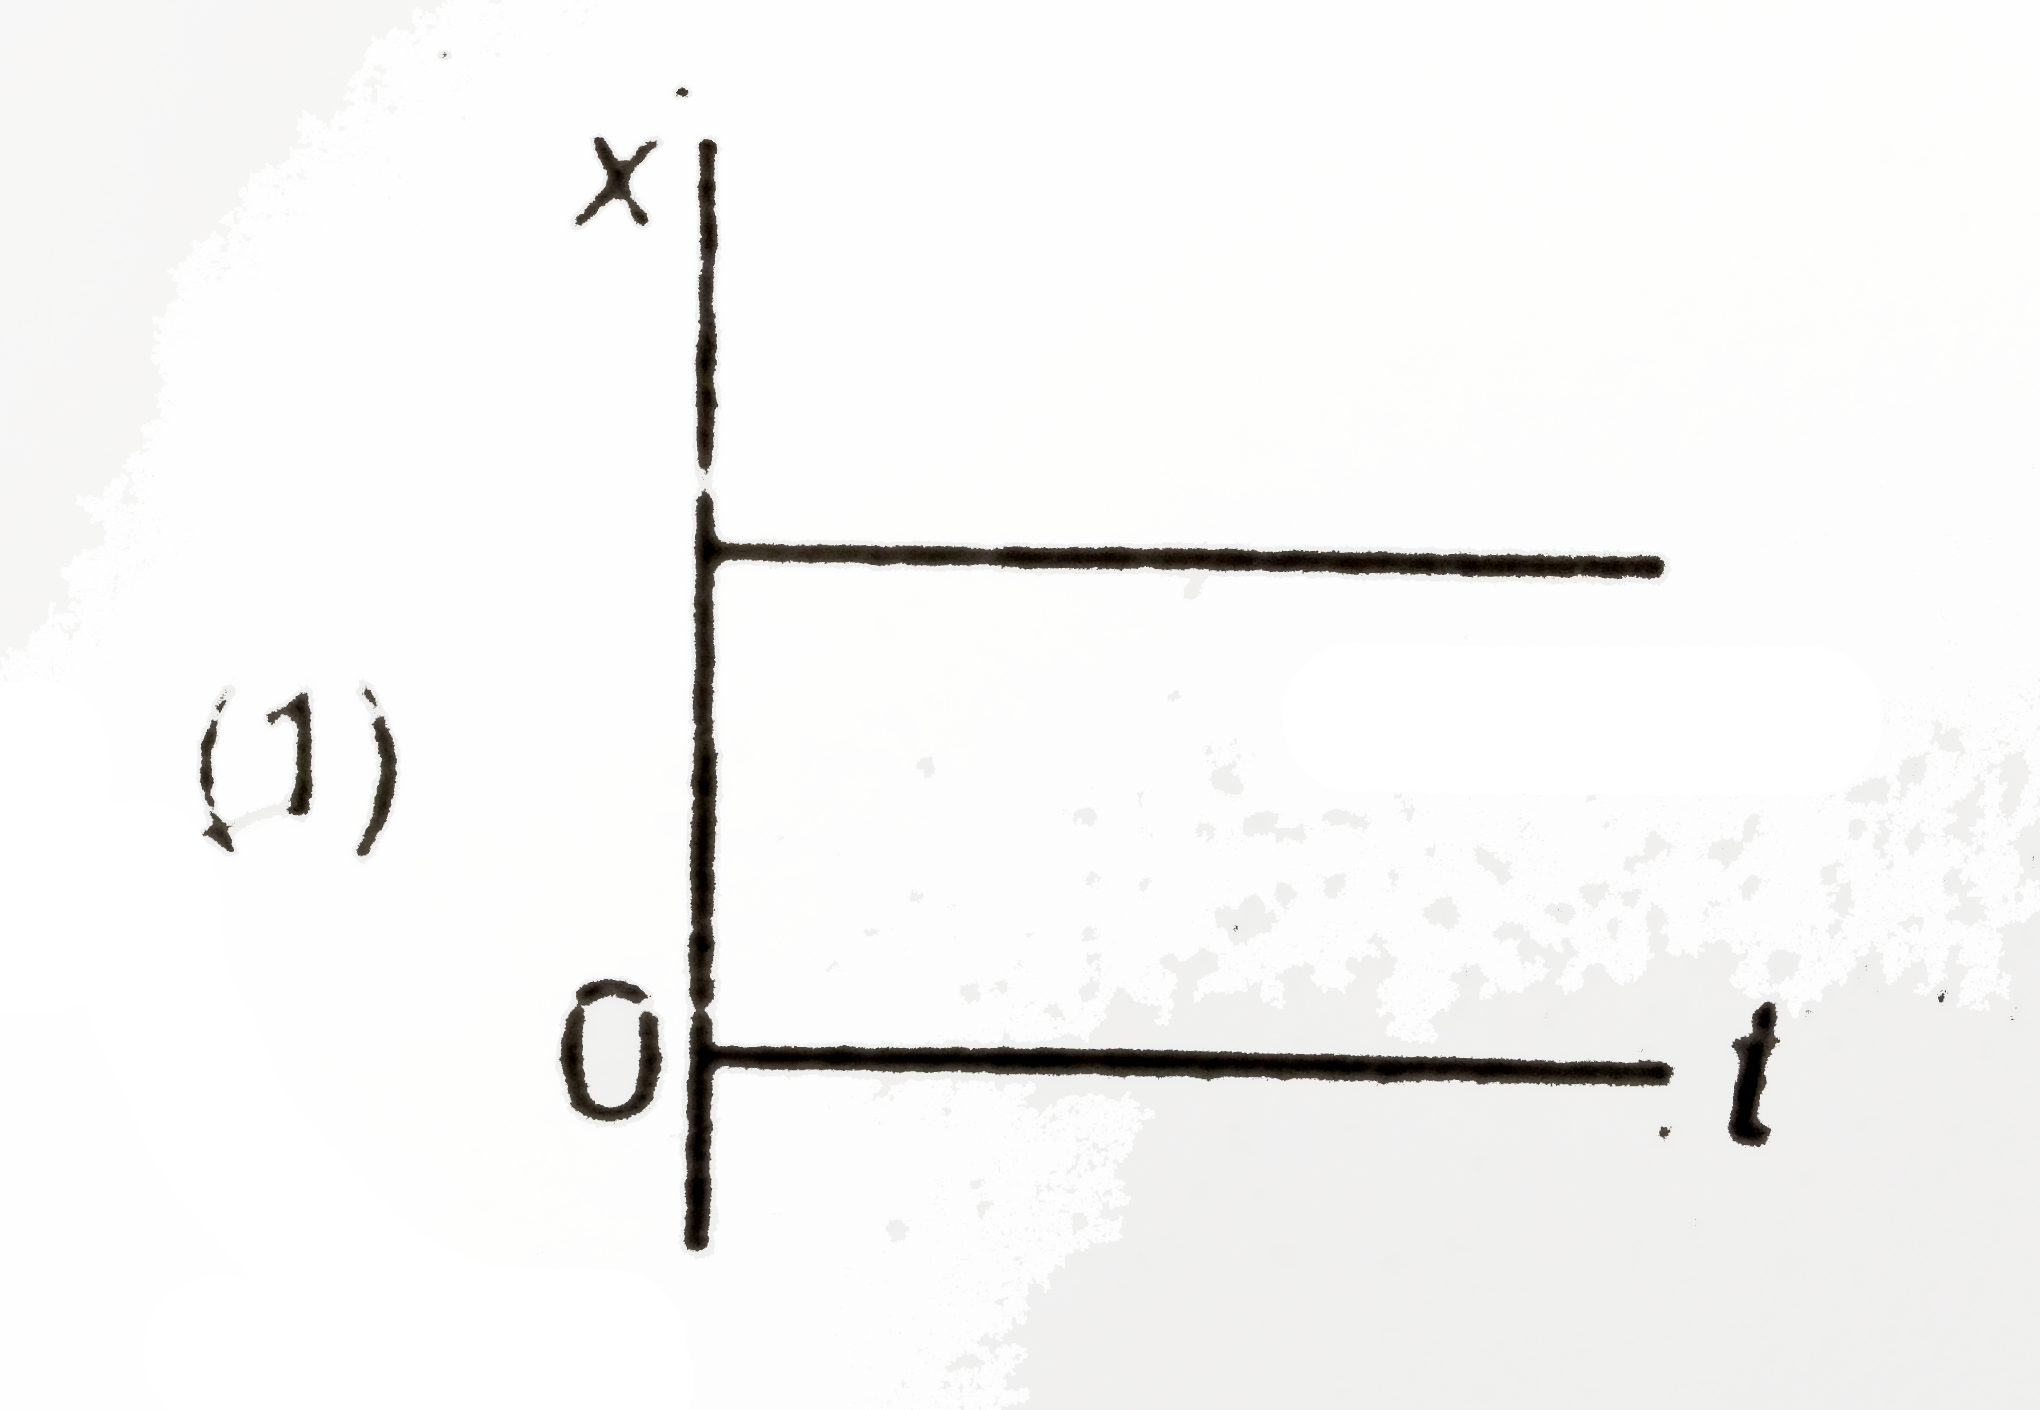 B
B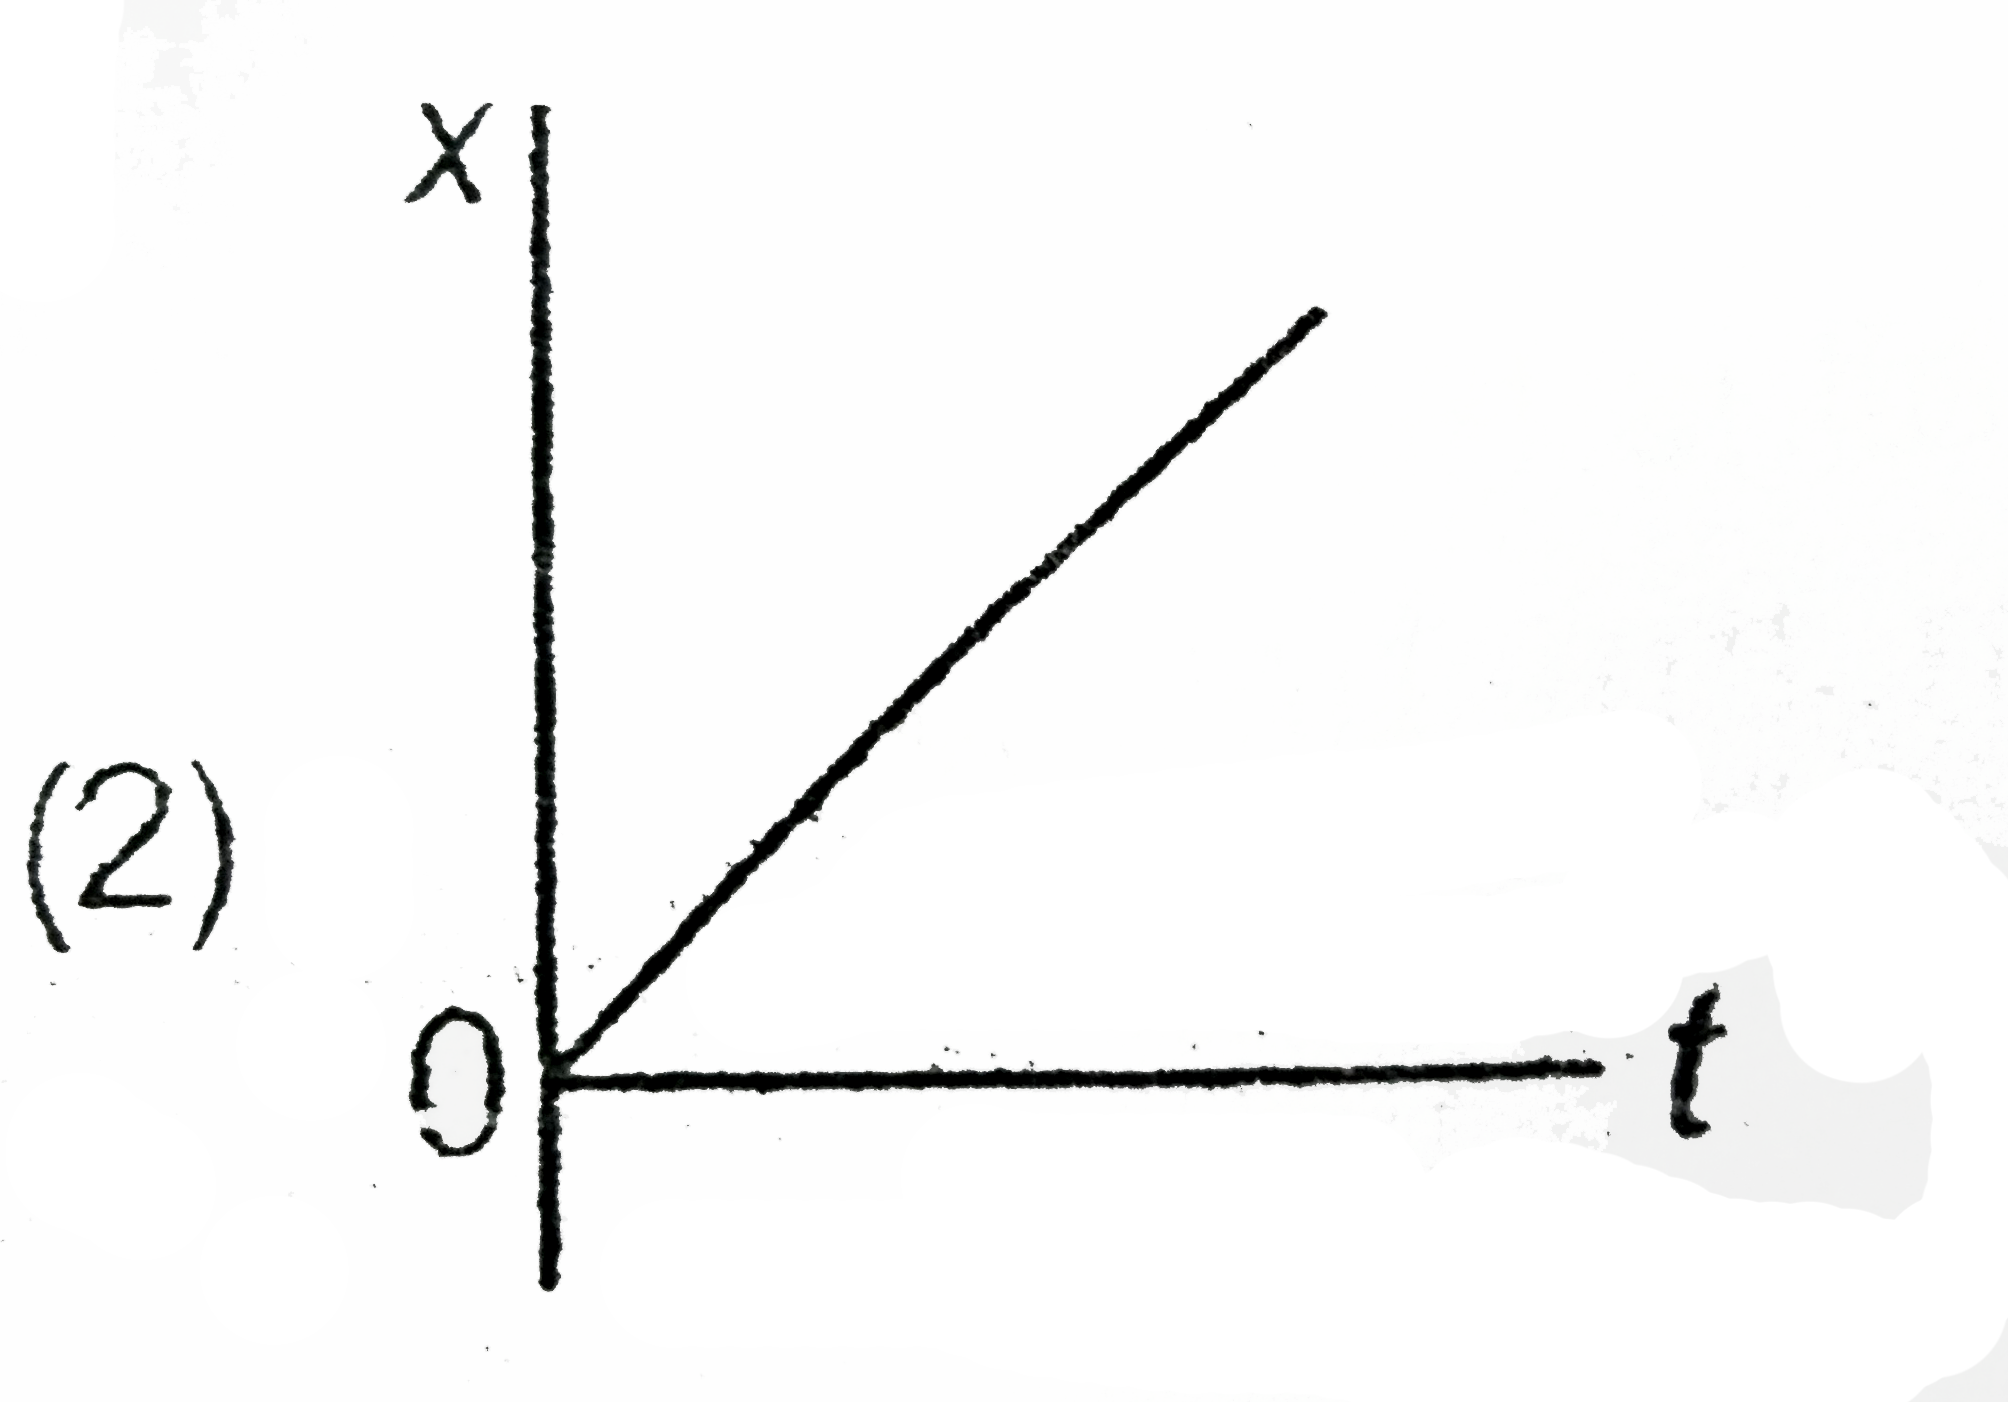 C
C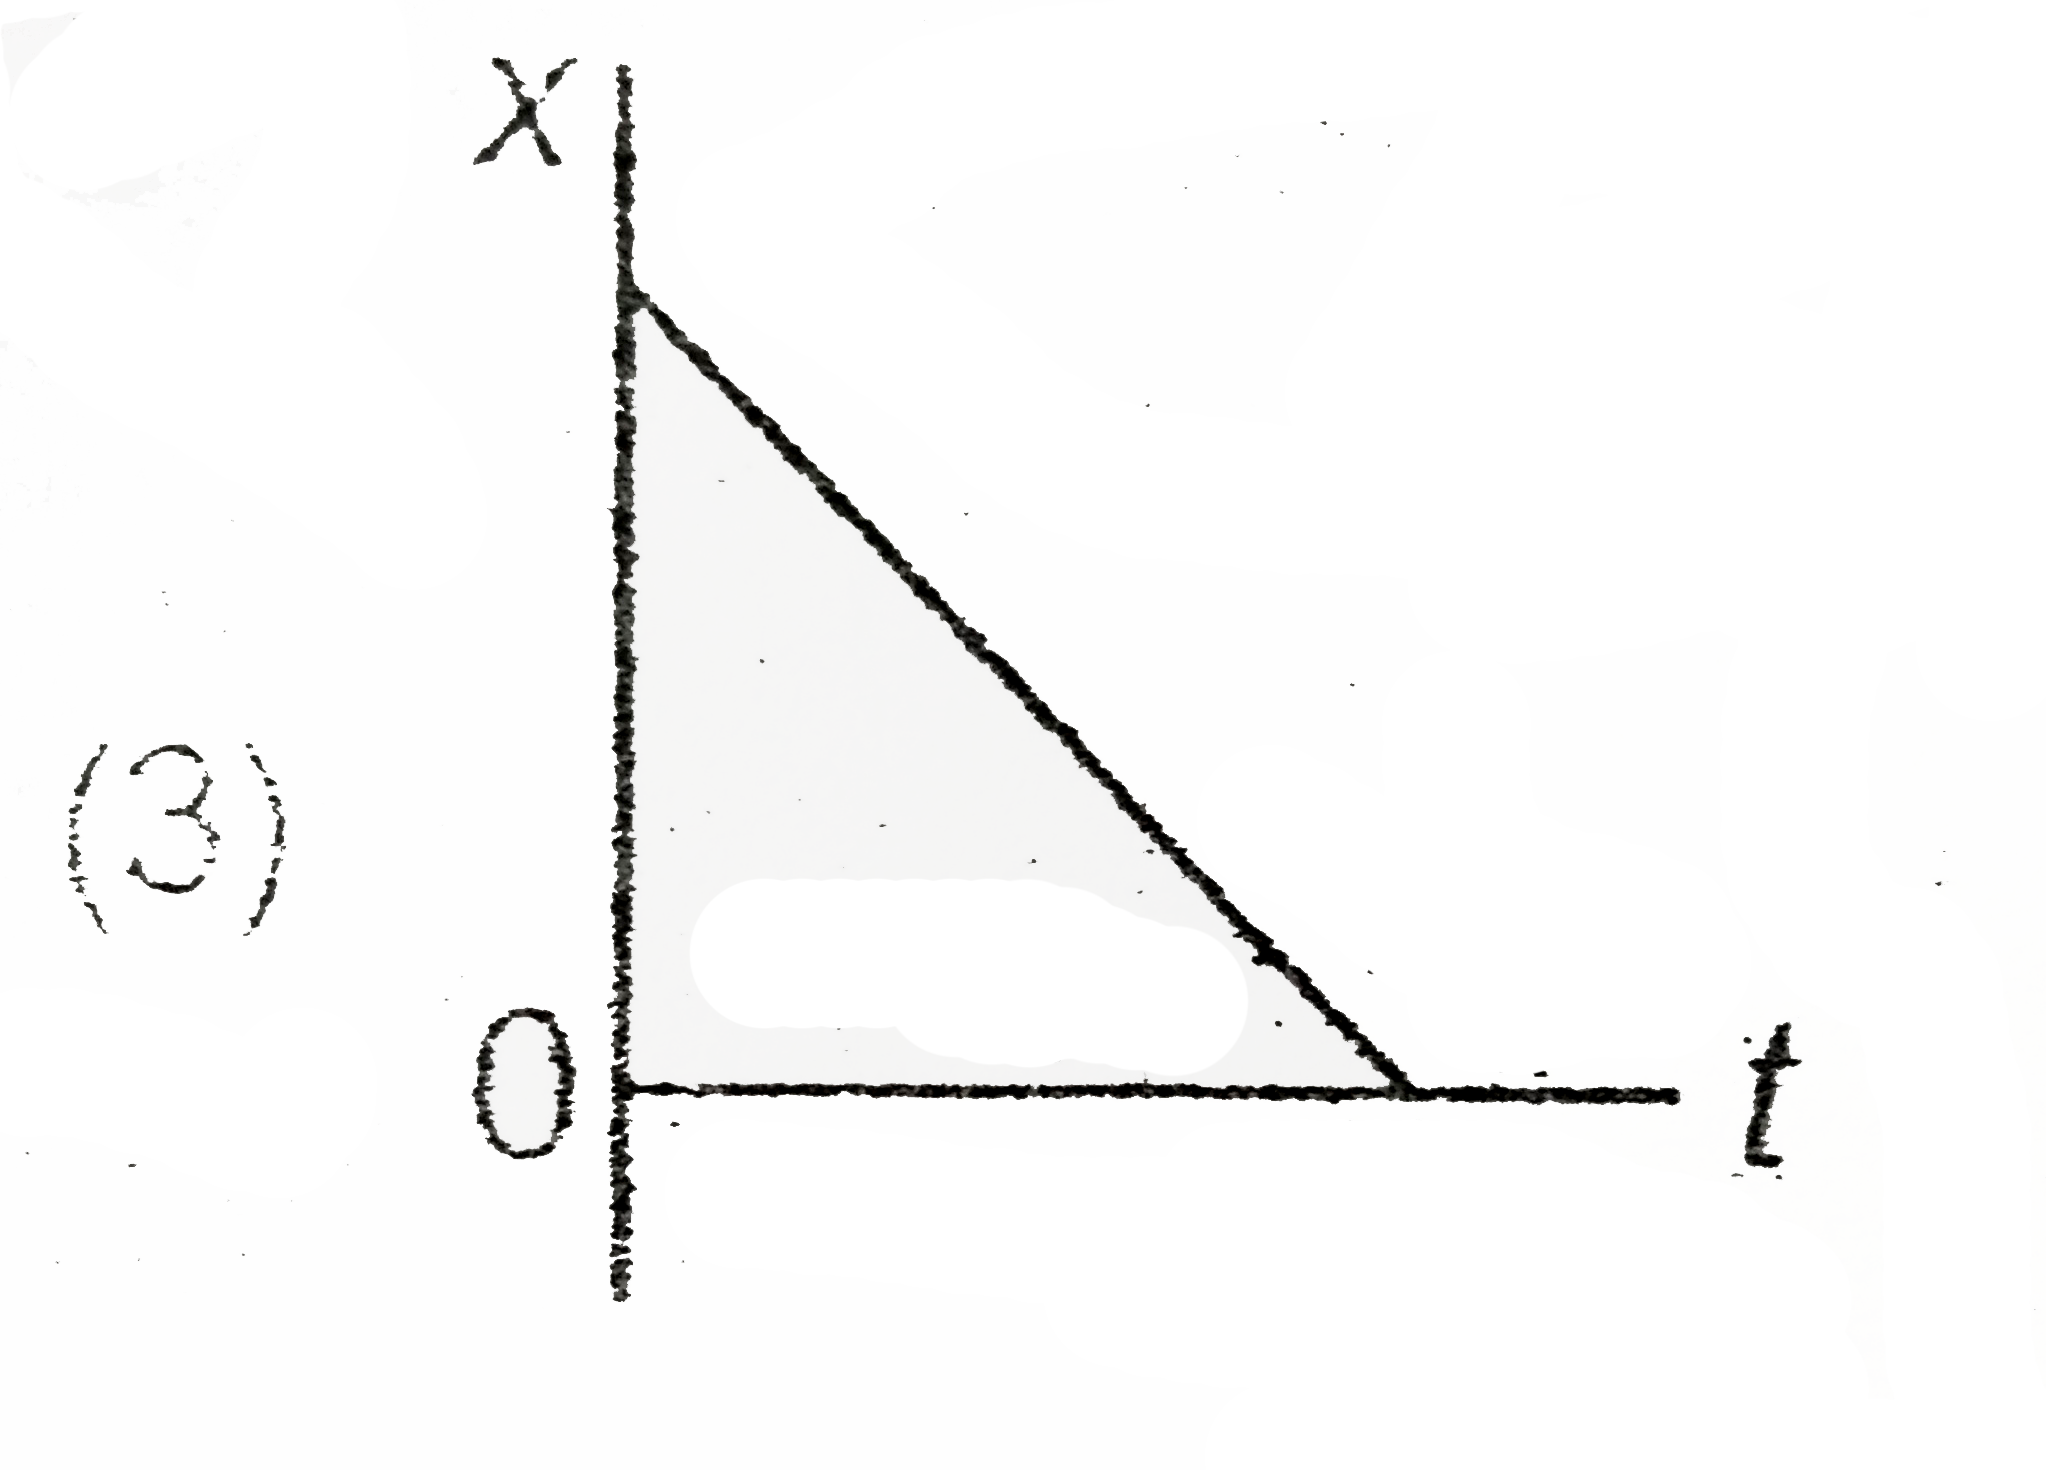 D
D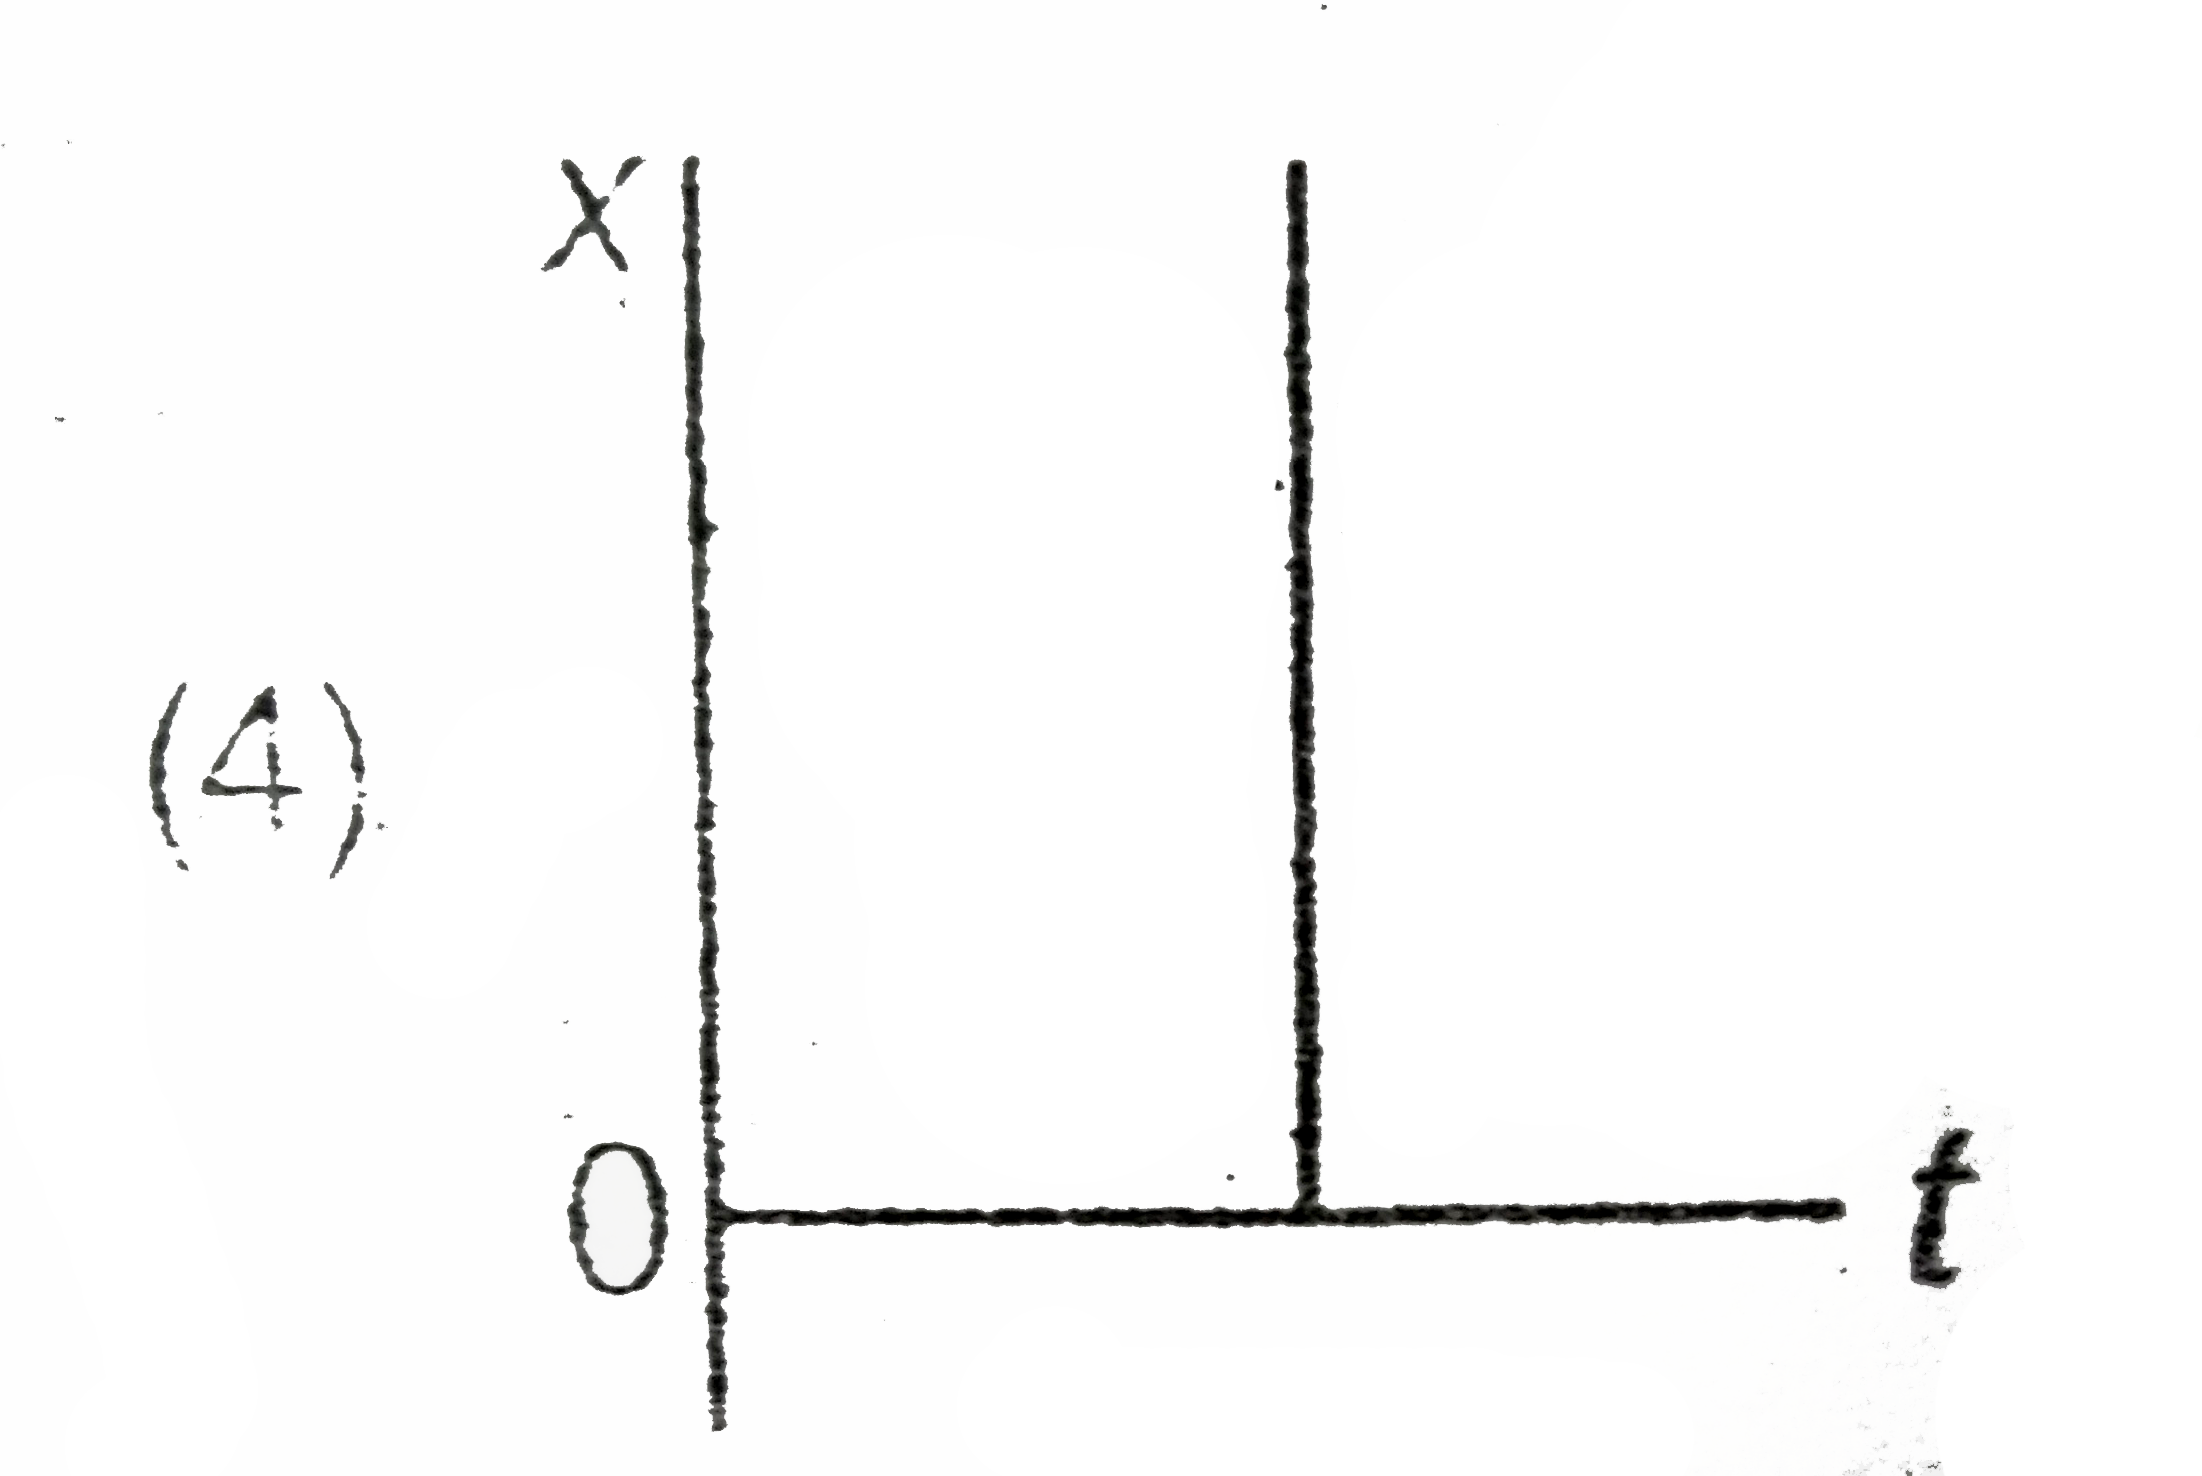
Which graph represents the correct relationship between various velocities for an idela gas ?
A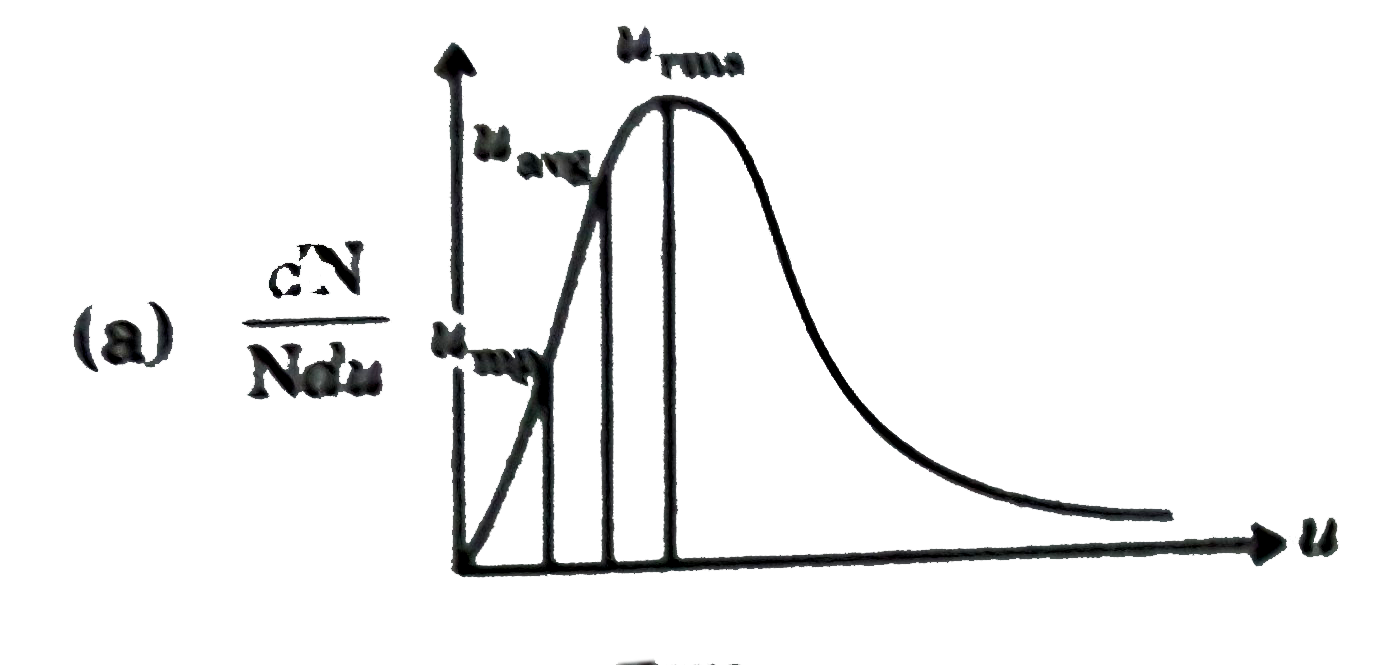 B
B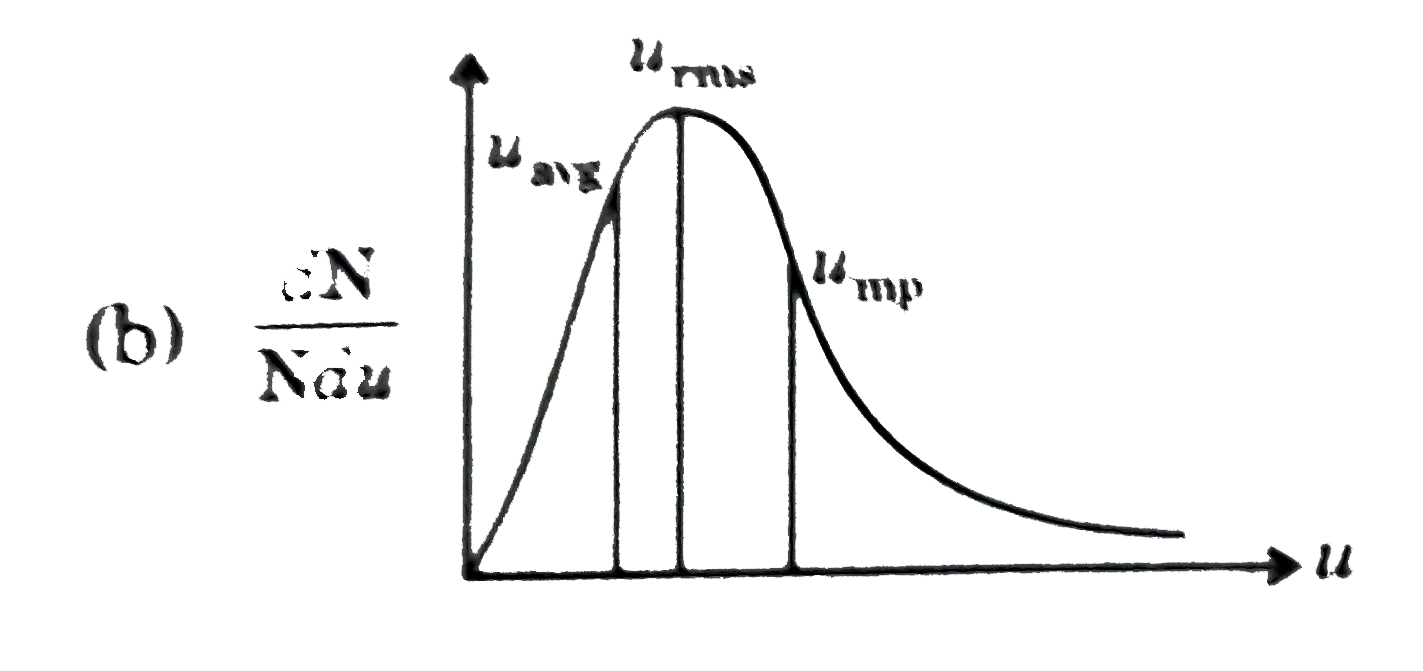 C
C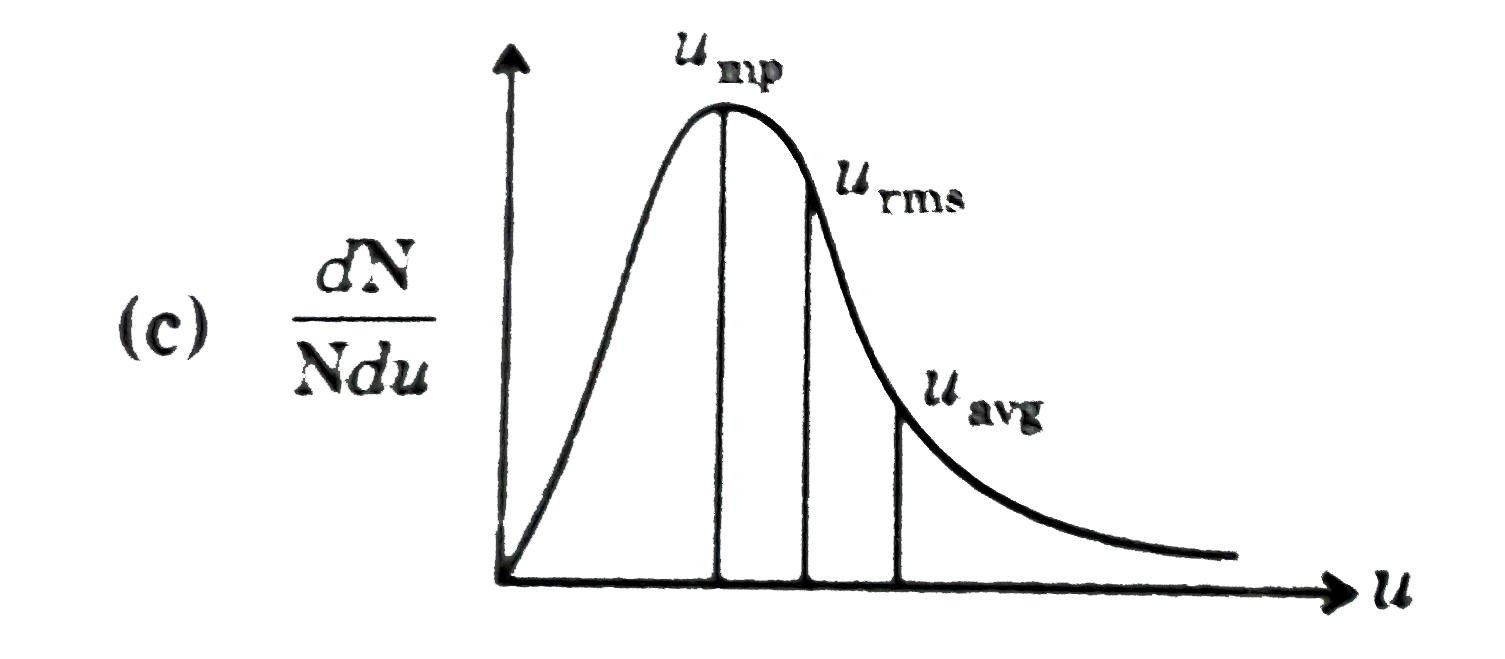 D
D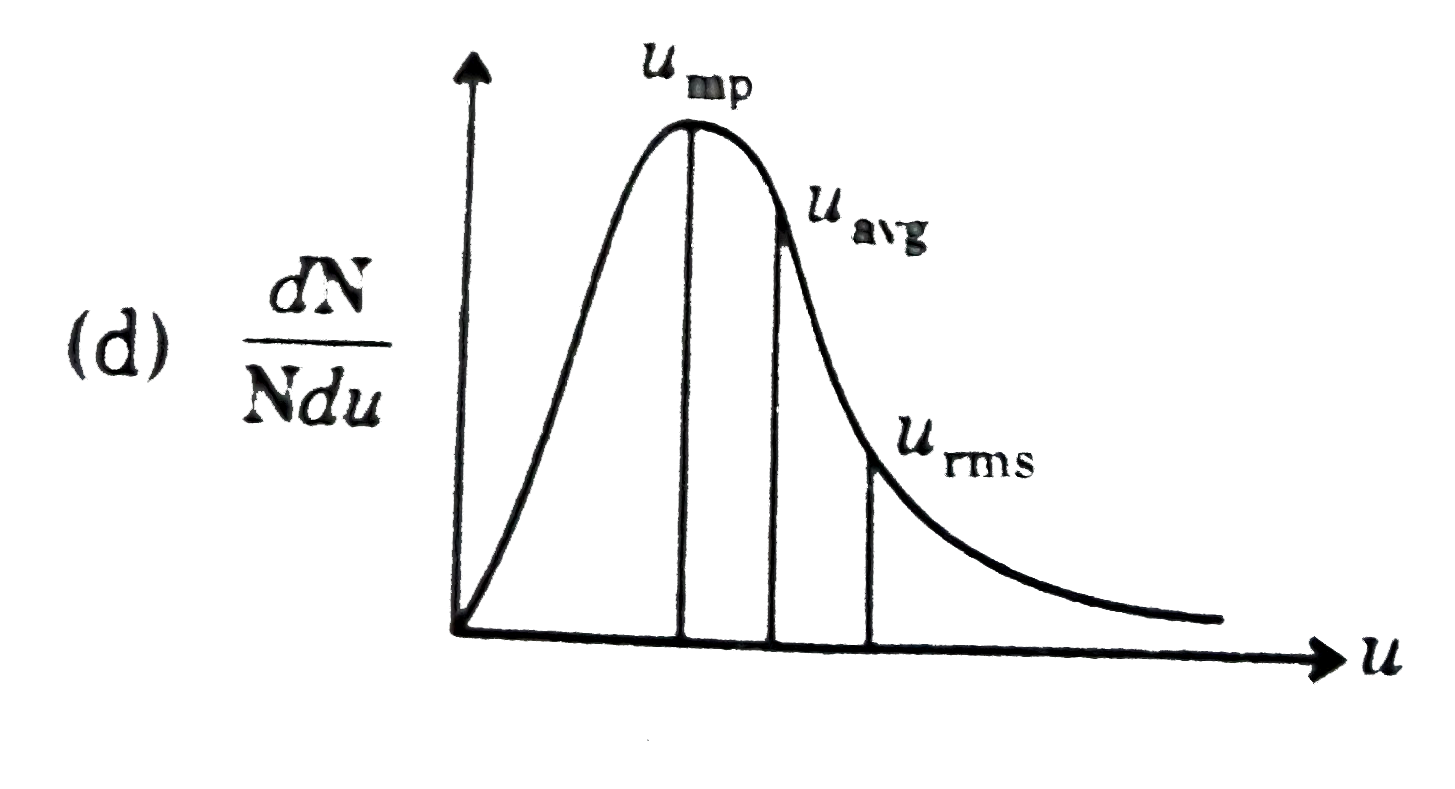
Which one of the given graph shows the effect of pH on the velocity of a typical enzymatic reaction (V)?
View SolutionWhich one of the given graphs shows the effect of temperature on the velocity of a typical enzymatic reaction ?
View SolutionThe given graph illustrates the effect of two hormones " X and Y on blood sugar level of a person. Xrepresents the effect of __i__and Y represents the effect of ___ii__.
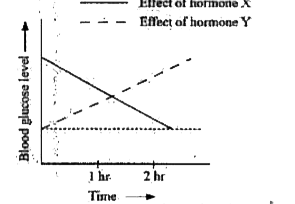
The information in which alternative correctly completes the given statement?
View SolutionFigure shows the position the graph for a particle in one dimensional motion. Which of the graphs in fugure represent the variation in the velocity of the particle with time ?
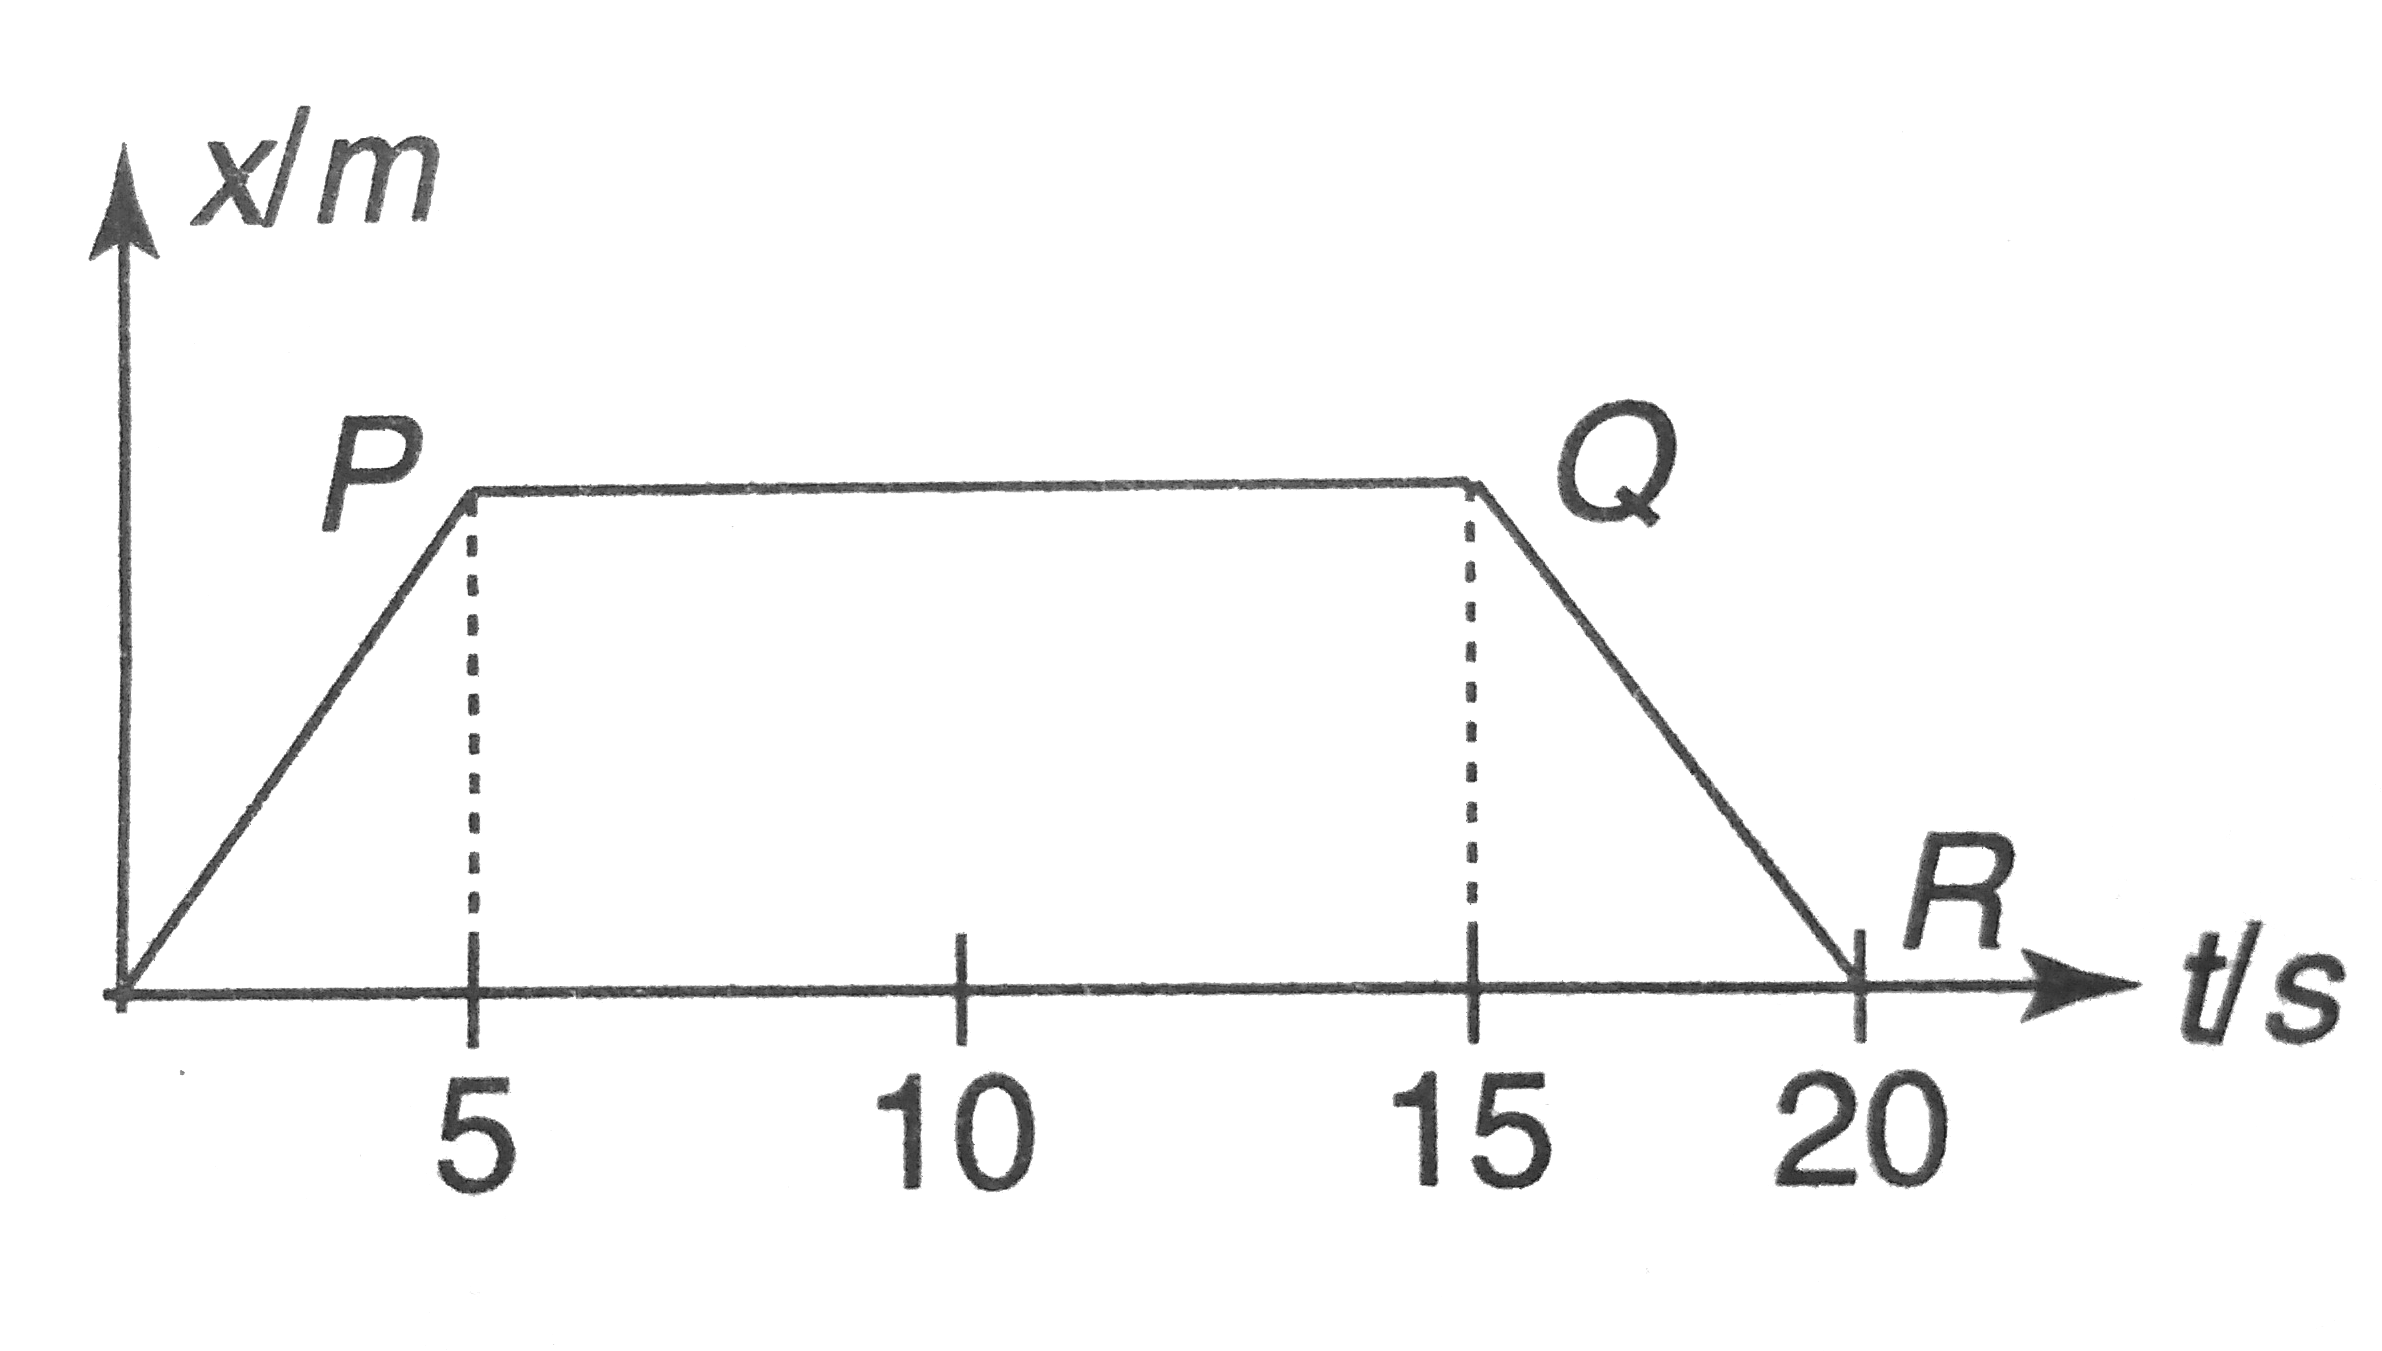
View SolutionThe graph that represents the relation between orbital velocity (v0) of a satellite and radius (r) of the orbit around earth is
View Solution

