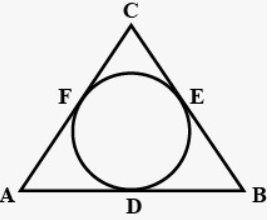
The semi perimeter of Δ=28cm then AF+BD+CE is ………Solution in Telugu
23 cm
28 cm
56 cm
14 cm
The correct Answer is:B
Step by step video & image solution for The semi perimeter of Delta=28 cm " then " AF +BD +CE is ……… by Maths experts to help you in doubts & scoring excellent marks in Class 10 exams.
Updated on:21/07/2023Topper's Solved these Questions
- TANGENT AND SECANTS TO A CIRCLE Book:VGS PUBLICATION-BRILLIANTChapter:TANGENT AND SECANTS TO A CIRCLE Exercise:CREATIVE QUESTIONS FOR CCE MODEL EXAMINATION GIVEN IN THE PUBLE EXAMINATION (PART-B)
Explore 20 Videos
- SUMMATIVE ASSESSMENTBook:VGS PUBLICATION-BRILLIANTChapter:SUMMATIVE ASSESSMENTExercise:SUMMATIVE ASSESSMENT
Explore 61 Videos
- TANGENTS AND SECANTS TO A CIRCLEBook:VGS PUBLICATION-BRILLIANTChapter:TANGENTS AND SECANTS TO A CIRCLEExercise:EXERCISE
Explore 201 Videos
Similar Questions
The maximum nuber of possible tangents that can be draw to a circle is ……..
View SolutionRamu says, "If log10x=0, value of x=0". Do you agree with him ? Give reason.
View SolutionDraw a circle with any radius . Draw four tangents at different points . How many tangents can you draw to this circle ?
View SolutionIdentify the cell organelle 'A' :-
ltimg src="https://d10lpgp6xz60nq.cloudfront.net/physics_images/ALN_BIO_C10_E08_018_Q01.png" width="80%"gt
View SolutionHow many lines of symmetry does the above figure have ?
View SolutionWhich of the following are correct chain isomers of butane ? (i)
View SolutionDetermine the point of symmetry of a regular hexagon.
View SolutionDtermine the images of the following figure about the given line :
View SolutionMatch the following Column A to Column B

View SolutionMatch the following Column A to Column B

View SolutionMatch the following Column A to Column B

View SolutionFind the perimeter of the figure given below.

View SolutionFind the area of the figure given below.

View SolutionThe inequation represented by the graph given below is :
View SolutionThe inequation that best describes the graph given below is _________
View SolutionThe inequation that best describes the following graph is _________
View Solution