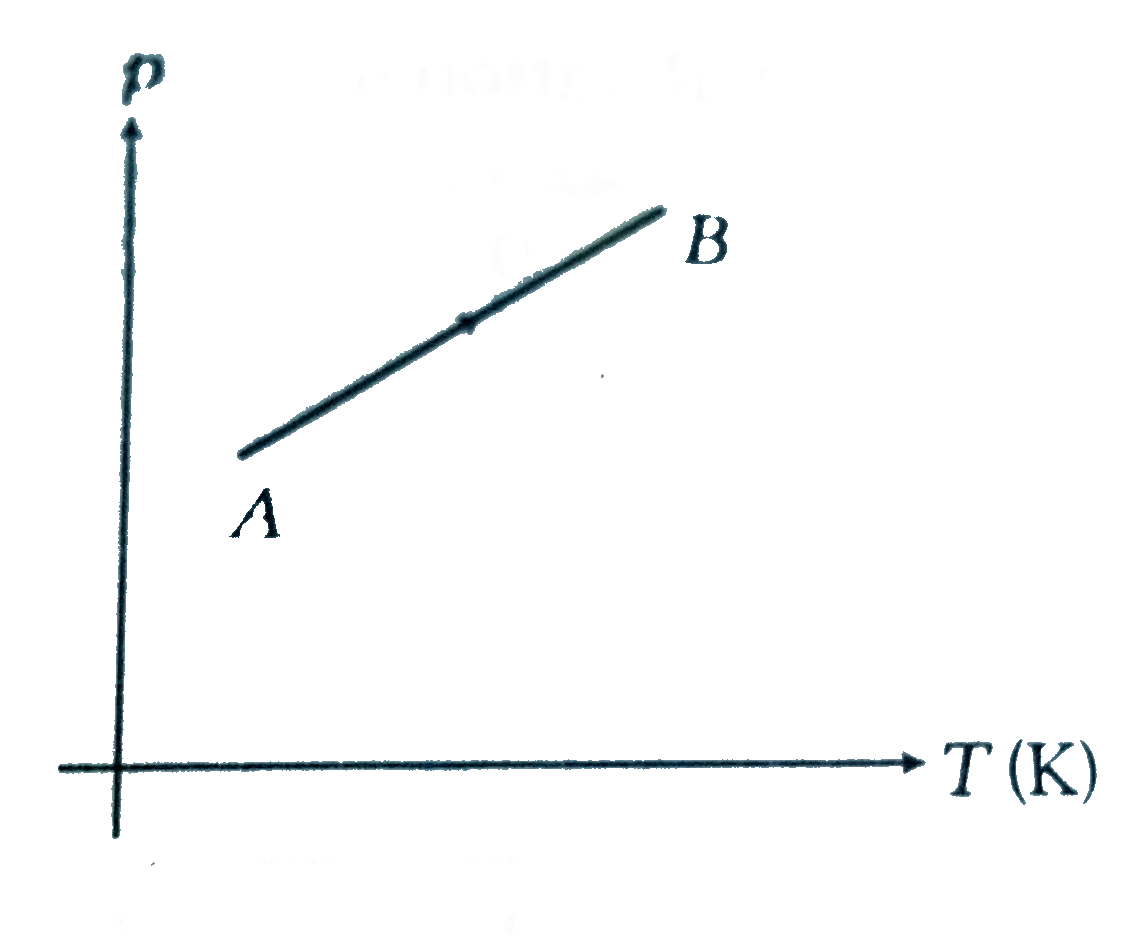
P-T graph for same number of moles of two ideal gases are shown . Find the path along which volume decreases .
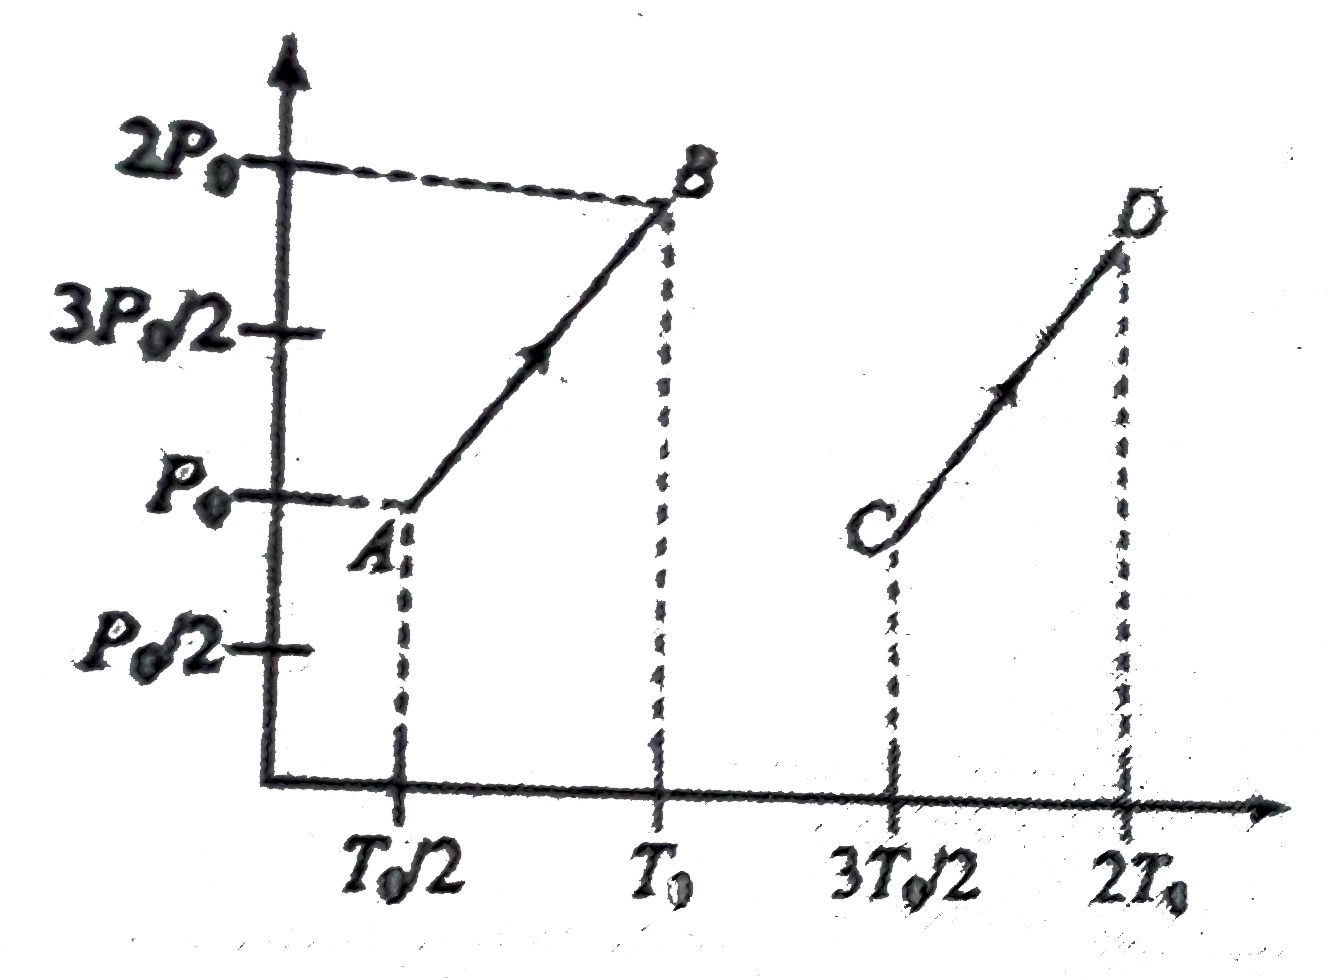
A to B
B to A
C to D
D to C
The correct Answer is:C
Step by step video, text & image solution for P-T graph for same number of moles of two ideal gases are shown . Find the path along which volume decreases . by Physics experts to help you in doubts & scoring excellent marks in Class 11 exams.
Updated on:21/07/2023Similar Questions
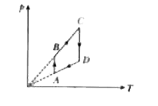
Pressure temperature (p-1) graph of n moles of an ideal gas is shown in the figure. Among the following four graphs, which are the corresponding pressure volume (p-V) and density pressure (p-p) graphs?
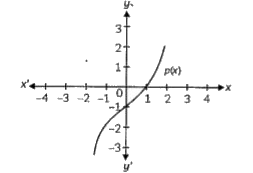
View SolutionFind the number of zeroes, for the polynomial p(x) shown in the graph below :
View Solution
Knowledge Check
The P−T graph for the given mass of an ideal gas is shown in figure. Then the volume
_E01_022_Q01.png) AincreasesBdecreasesCremains constantDdata insuficient
AincreasesBdecreasesCremains constantDdata insuficientFind the number of zeroes, for the polynomial p(x) shown in the graph below:
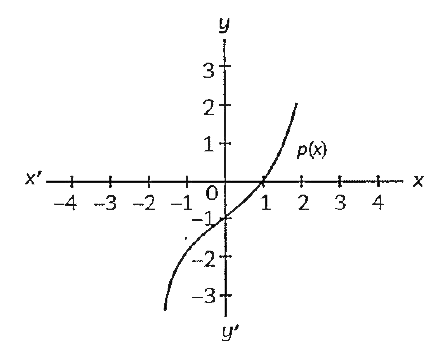 A0B1C2D3
a graph between prssure P (along y-axis) and absolute temperature, T(along x-axis) for equal moles of two gases has been drawn . Given that volume of second gas is more than volume of first gas. Which of the following statement is correct?
ASlope of gas 1 is less than gas 2BSlope of gas 1 is more than gas 2CBoth have some slopesDNone of the above
The p−T graph for the given mass of an ideal gas is shown in figure. What inference can be drawn regarding the change in Volume (whtherit is constant, increasing or decreasing) ?
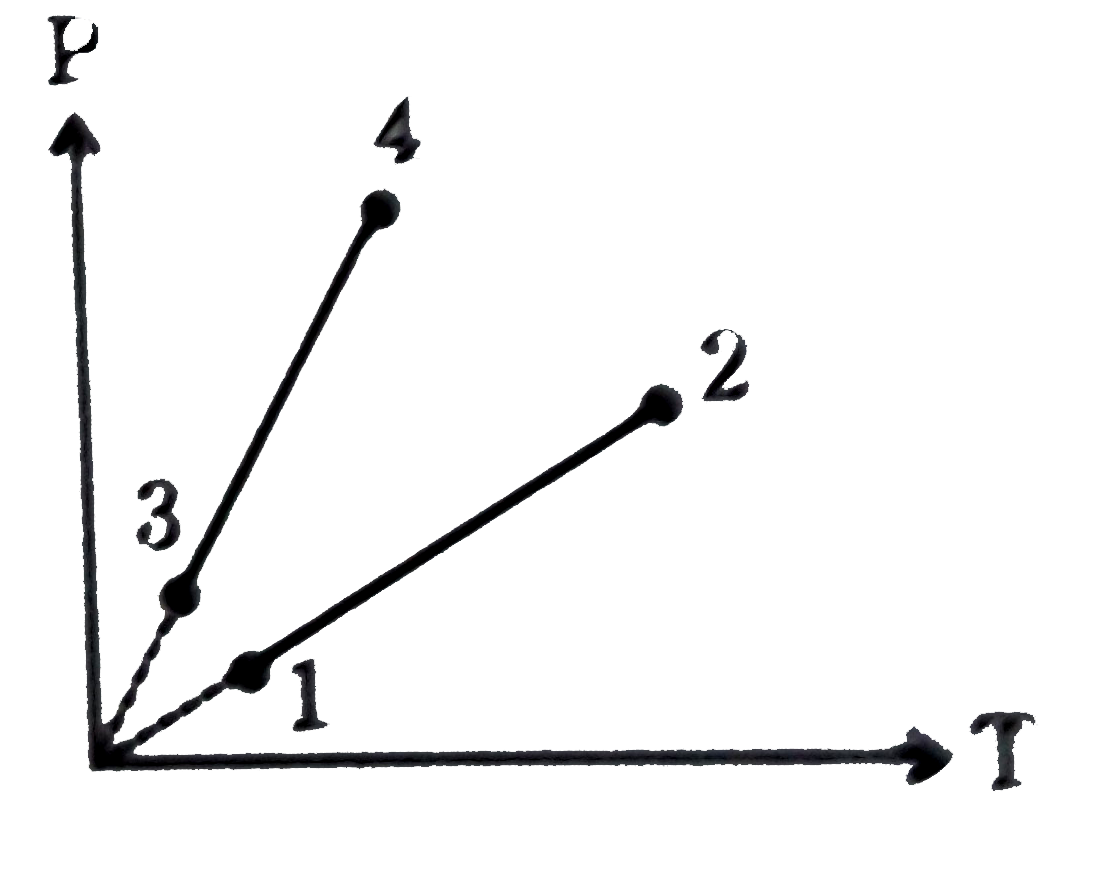
View SolutionPressure versus temperature graph of an ideal gas of equal number of moles of different volumes is plotted as shown in figure. Choose the correct alternatives.
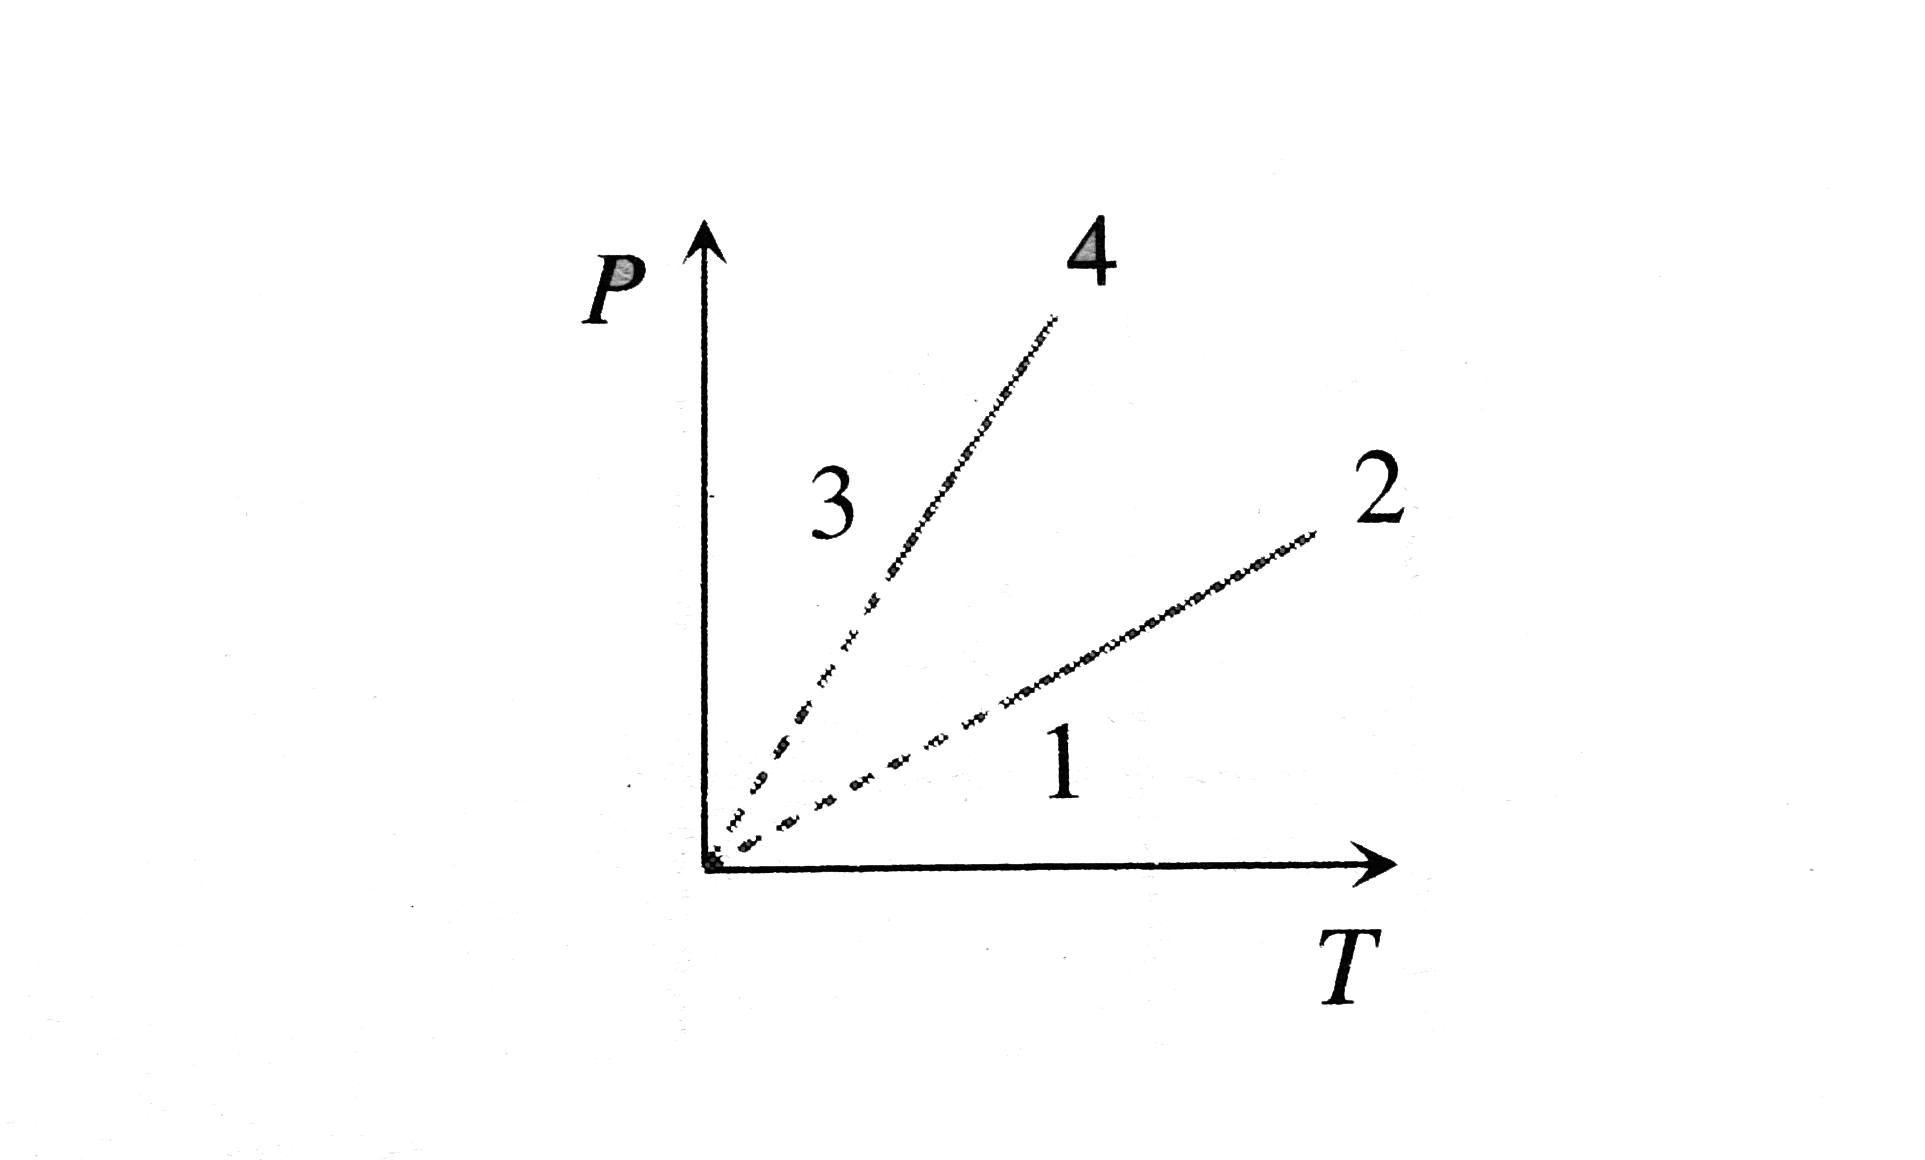
View SolutionPressure versus temperature graph of an ideal gas of equal number of moles of different volumes is plotted as shown in Fig. Choose the correct alternative.
View SolutionTwo different masses m and 3m of an ideal gas are heated separately in a vessel of constant volume, the pressure P and absolute temperature T, graphs for these two cases are shown in the figure as A and B. The ratio of slopes of curves B to A is

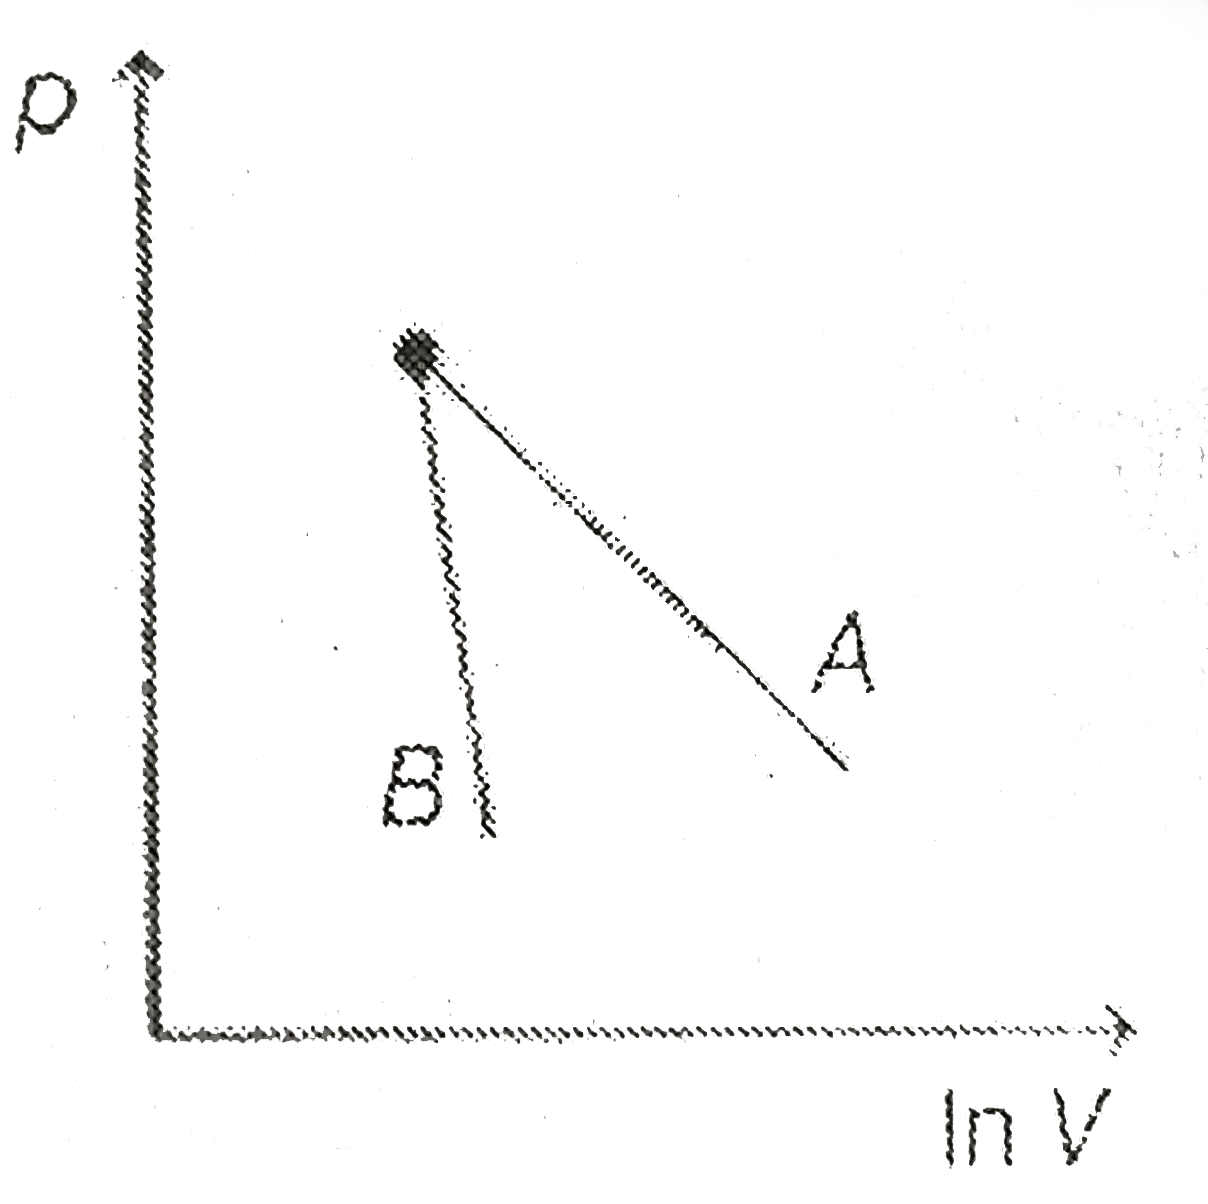
View SolutionThe figure shows the graph of logarithmic reading of pressure and volume for two ideal gases A and B undergoing adiabatic process. From figure, it can be concluded that
View Solution

