The current in a 4.0 mH inductor vaires in time as shown in the figure. The corresponding graph of the self induced emf across the inductor over the time interval t=0 to t=12.0 ms is


The correct Answer is:A
Similar Questions
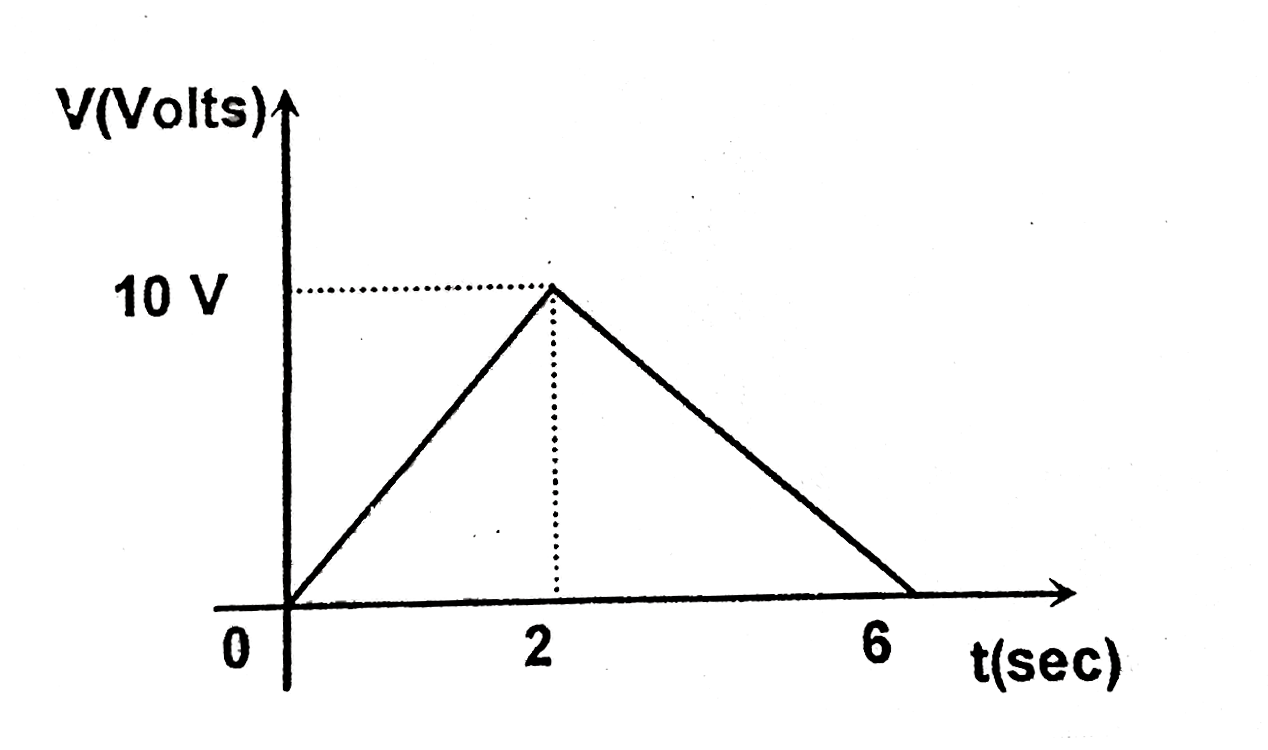
The potential difference across a 10H inductor as a function of time is shown in the figure. At t=0 current is zero. Then
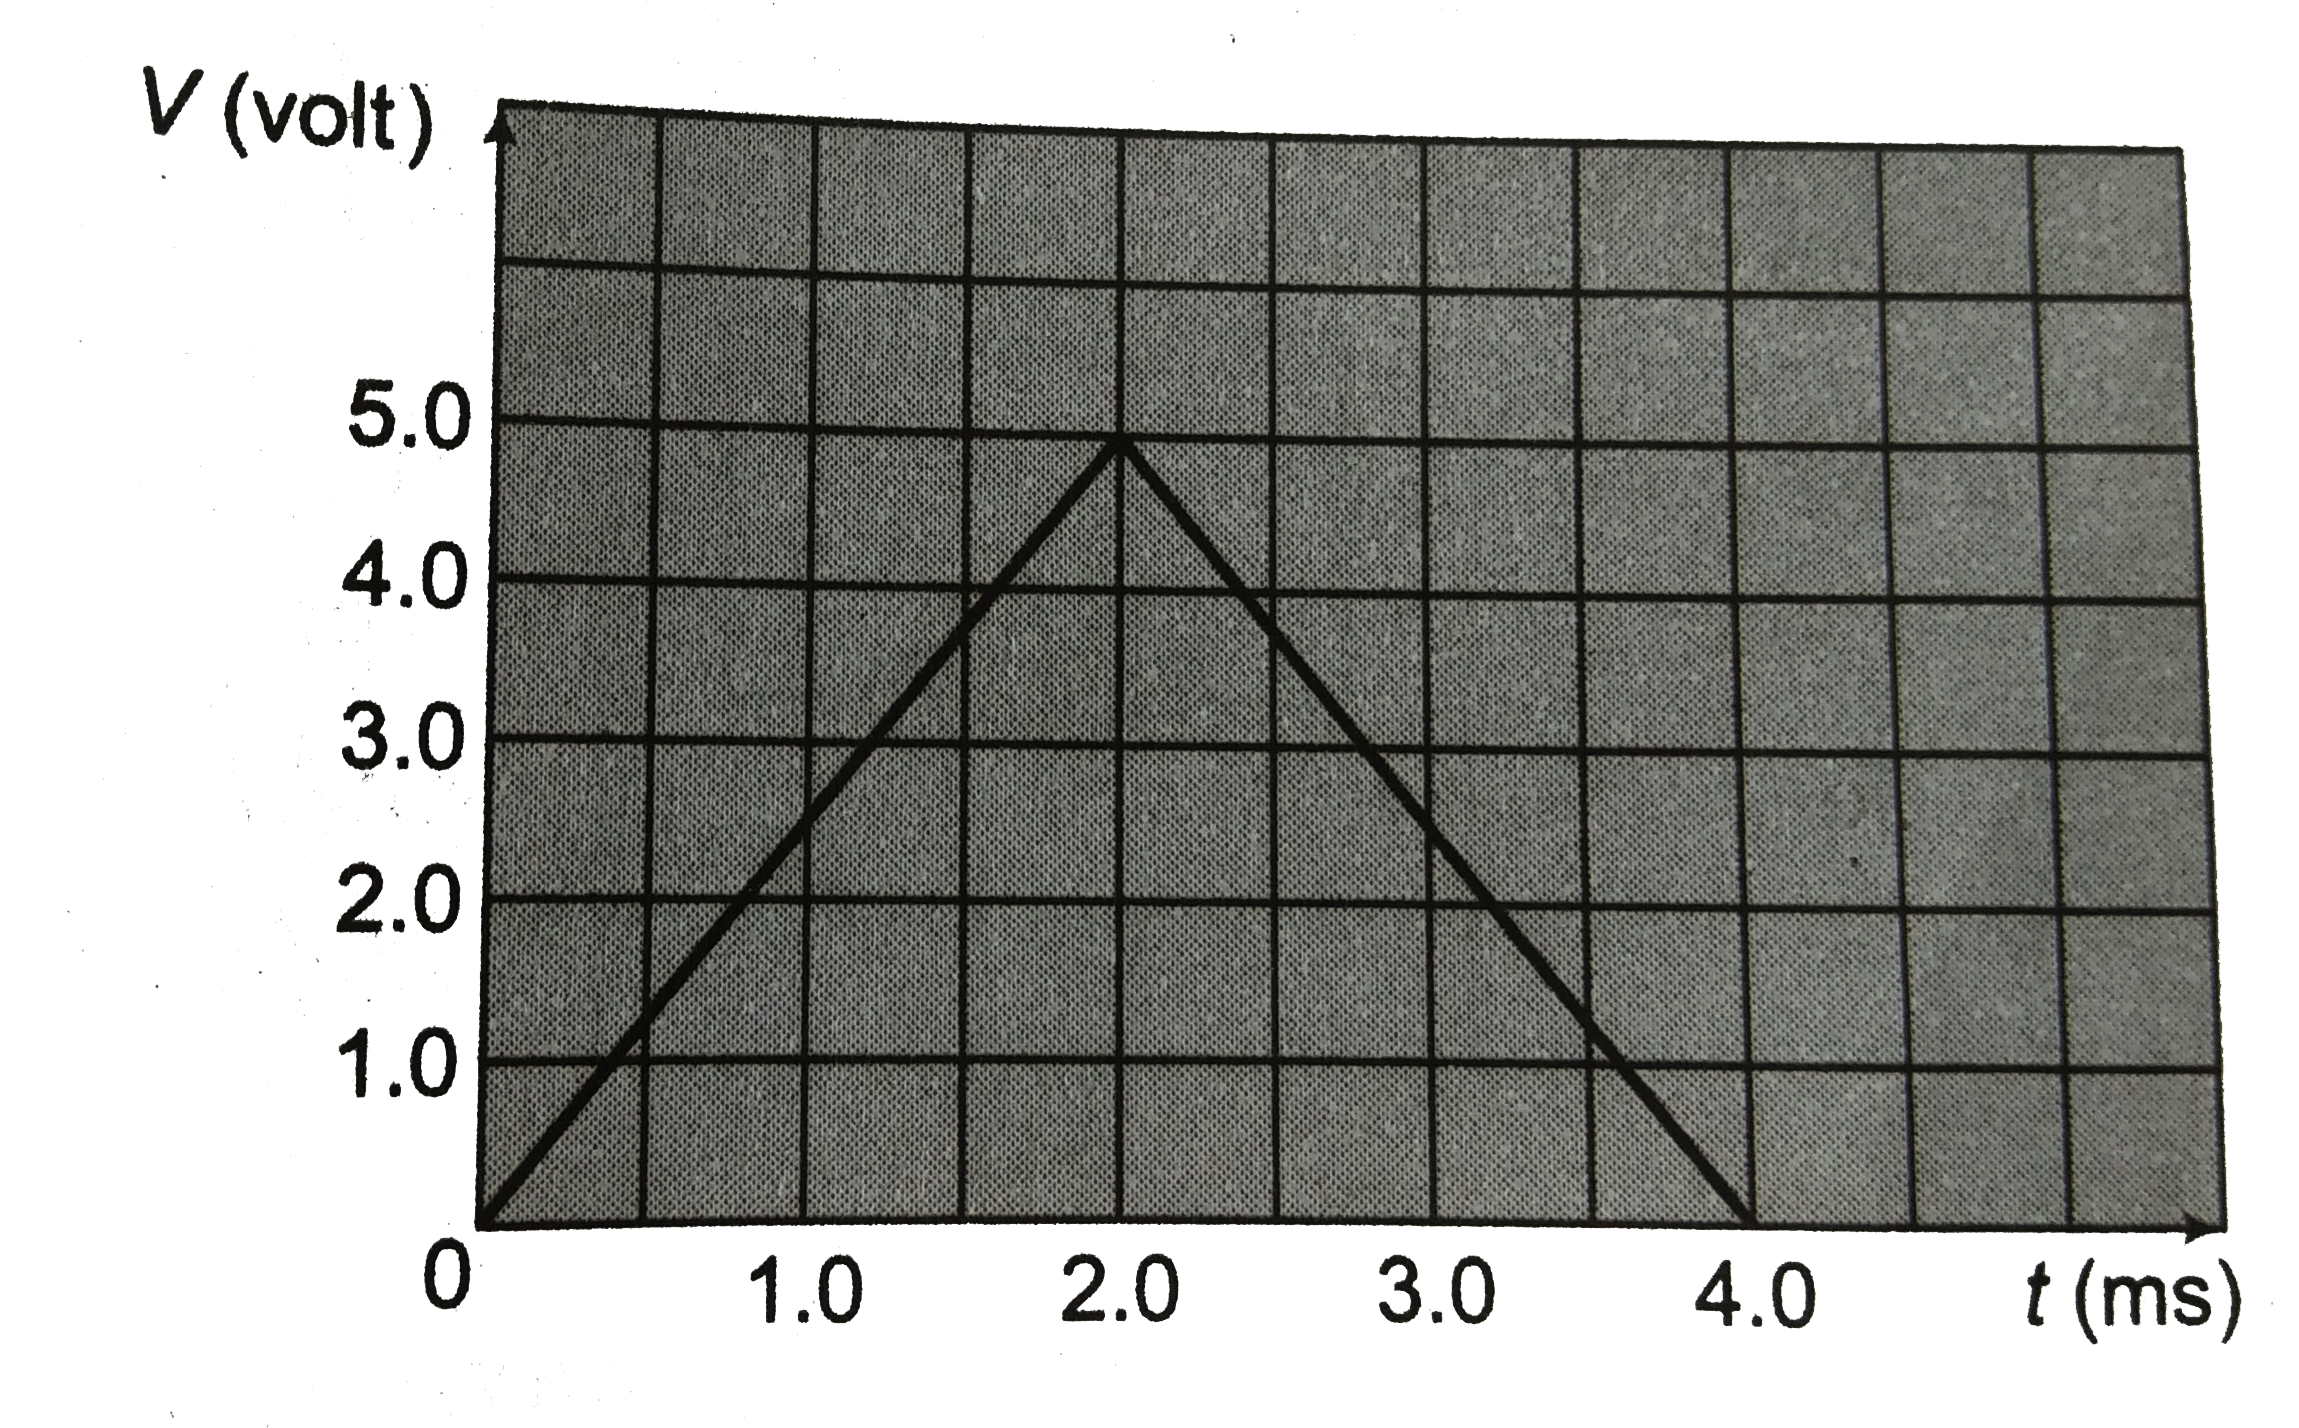
View SolutionThe potential difference across a 150mH inductor as a function of time is shown in figure. Assume that the initial value of the current in the inductor is zero. What is the current when t=2.0ms? and t=4.0ms ?
View Solution
Knowledge Check
The current in a 90mH inductor changes with time as i=1.0t2, where I is in amperes and t is in seconds.
Athe magnitude of the induced emf at t=4.0s is 180 mVBthe emf zero at time t=3.0sCthe magnitude of the induced emf at t=4.0s is 360 mVDthe emf zero at time t=4.0sThe potential difference across a 10H inductor as a function of time is shown in the figure. At t=0 current is zero. Then
 AThe current in the inductor at t=6 is 3 ampBThe current in the inductor at t=1 sec is 1/4 ampCThe current in the inductor at t=4 is 5/2 amp.DThe variation of current versus time parabola.
The current is an induction coil varies with time t, according to the graph shown in figure. Which of the following graphs shows the induced emf (e) in the coil with time.
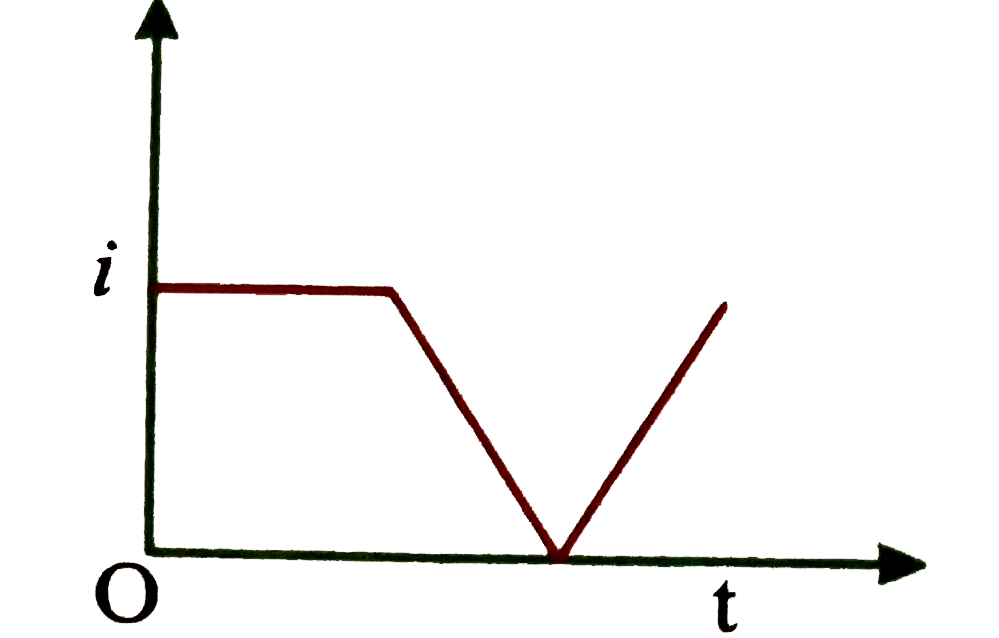 A
A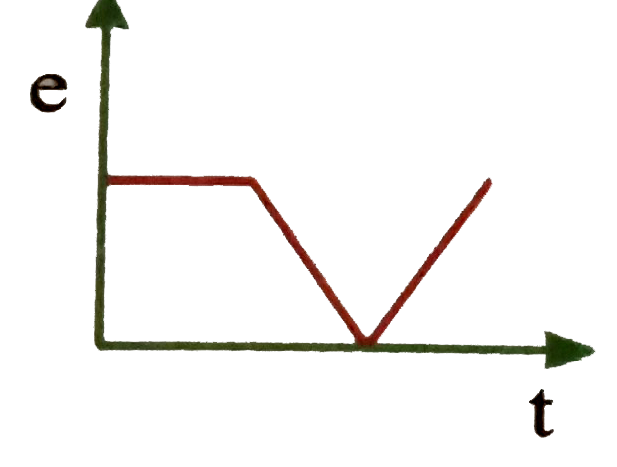 B
B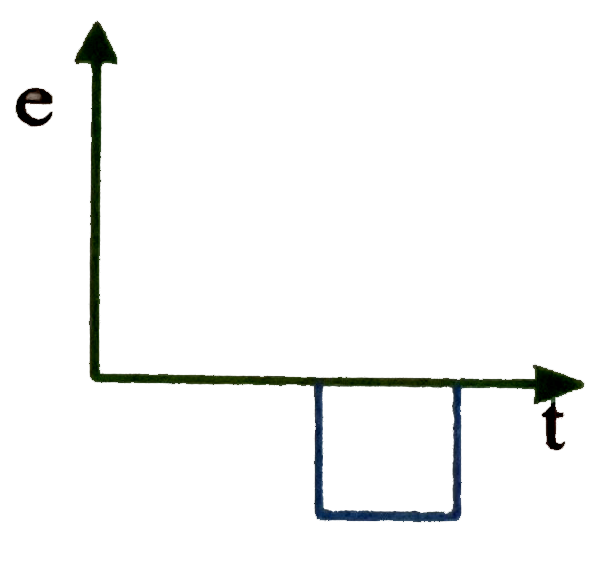 C
C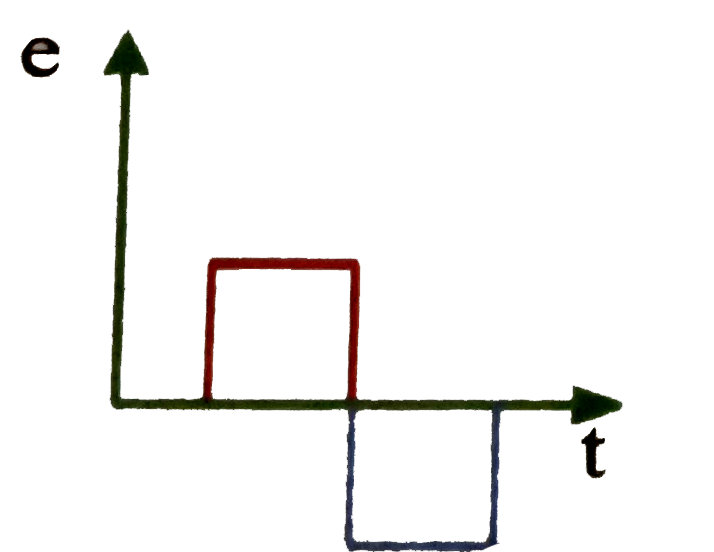 D
D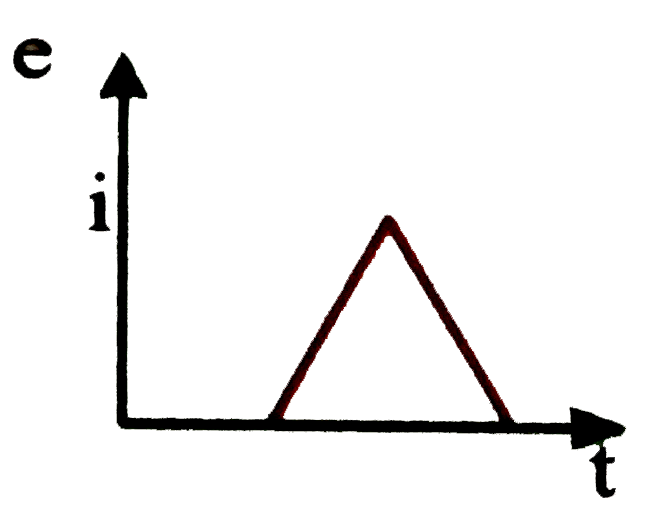
The potential difference across a 150mH inductor as a function of time is shown in figure. Assume that the initial value of the current in the inductor is zero. What is the current when t=2.0ms? and t=4.0ms ?

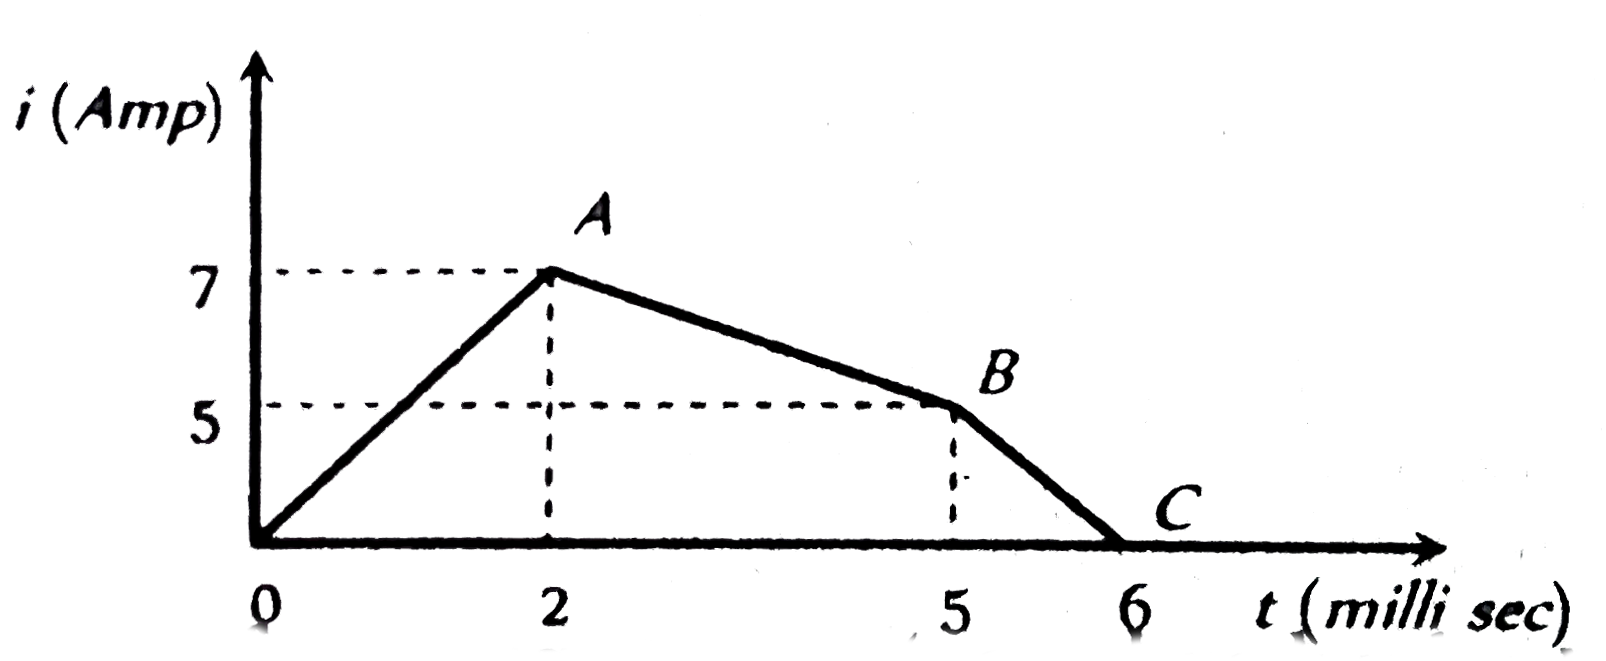
View SolutionThe current through a 4.6 H inductor is shown in the following graph. The induced emf during the time interval t = 5 milli - sec to 6 milli - sec will be
View SolutionThe current in a 90mH inductor changes with time as i=1.0t2−6t, where I is in amperes and t is in seconds.
View SolutionThe potential difference a 2H inductor as a function of time is shown in figure. At time t=0, current is zero
Current versus time graph across the inductor will be
View SolutionThe current through a 4.6 H inductor is shown in the following graph. The induced emf during the time interval t = 5 milli - sec to 6 milli - sec will be

View Solution

