A block of ice, initially at −20∘C, is heated a steady rate until the temperature of the sample reaches 120∘C. Which of the following graphs best illustrates the temperature of the sample as a function of time?


The correct Answer is:A
Ice melts at 0∘C and boils at 100∘C during these phase transitions, the temperature remains constant. Therefore, the graph of the sample's temperature must be momentarily flat at both 0∘C and at 100∘C.
Topper's Solved these Questions
Similar Questions
A person standing on a horizontal floor feels two forces : the downward pull of gravity and the upward supporting force from the floor. These two forces
View SolutionA block of mass m slides with constant speed down a ramp whose incline angle is θ. If F1 is the magnitude of the gravitational force acting parallel to the ramp and F2 is the magnitude of the normal force acting on the block, what is the value of F1/F2?
View SolutionA sample of gas is taken in a closed vessel at 20^(@)C . The gas is heated until the pressure is doubled. What is the final temperature?
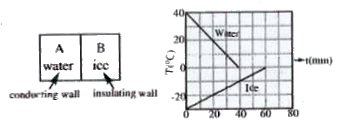
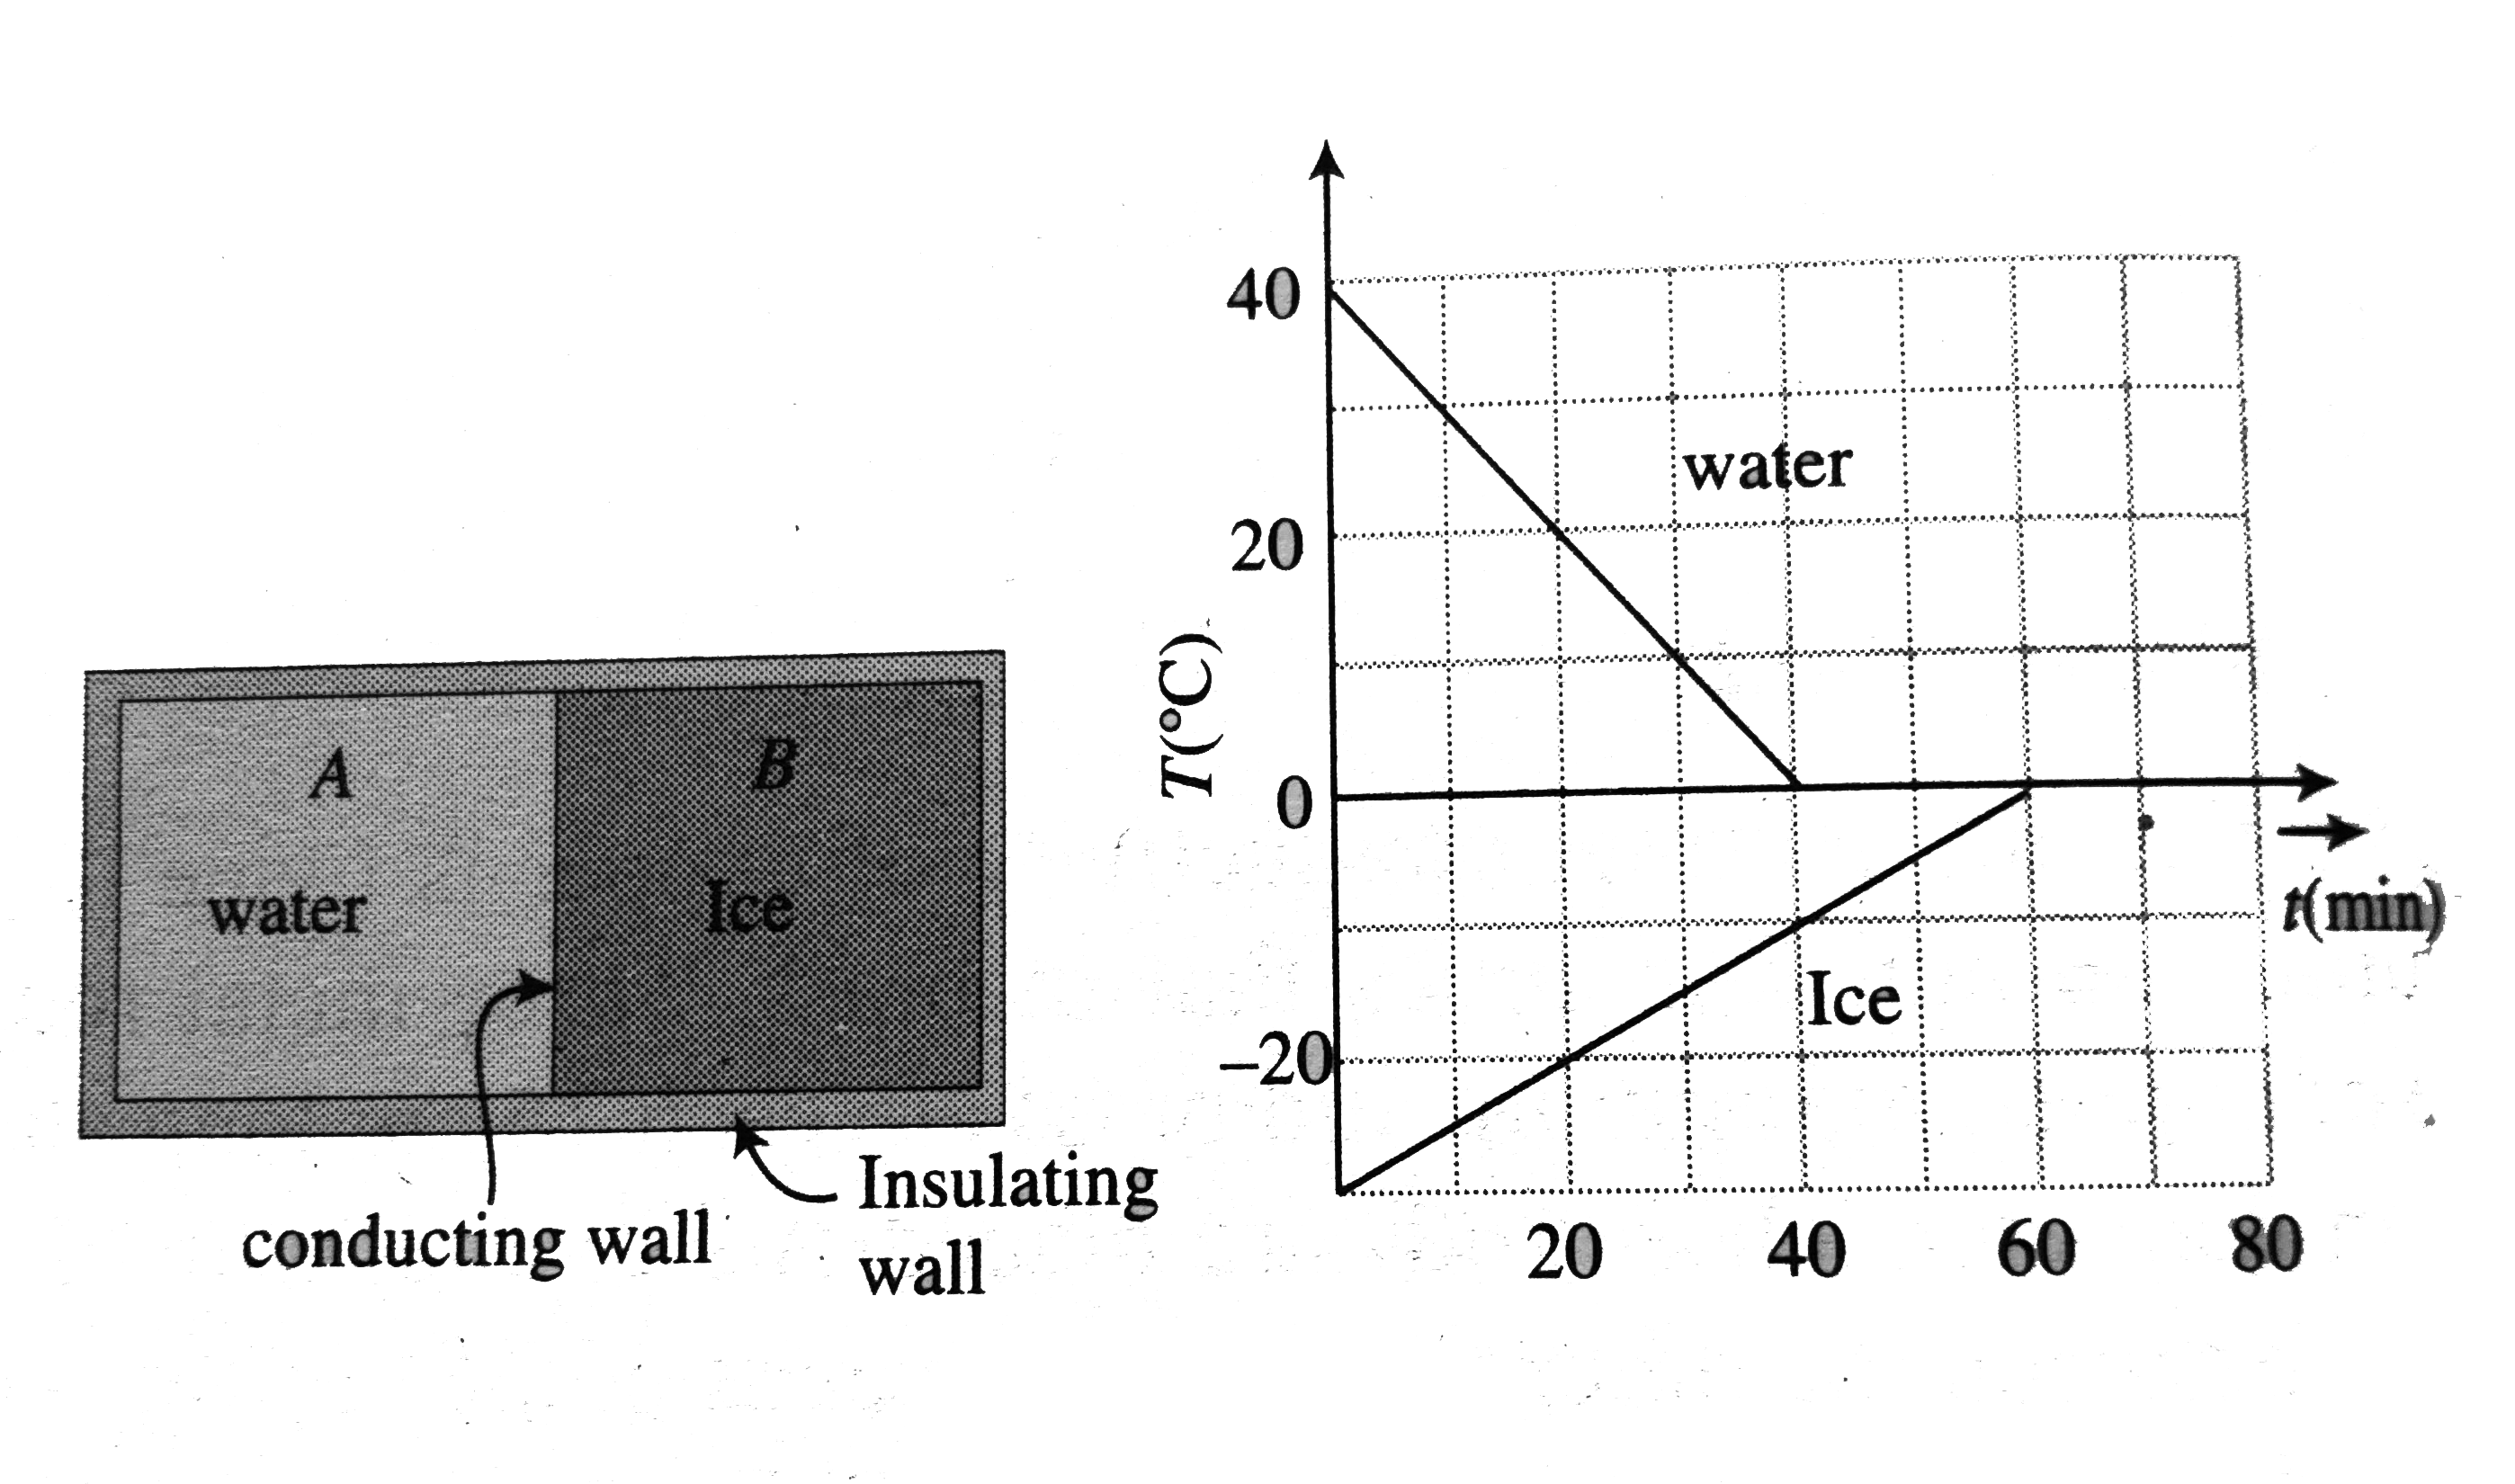
View SolutionA 0.60 kg sample of water and a sample of ice are placed in two compartmetnts A and B separated by a conducting wall, in a thermally insulated container. The rate of heat transfer from the water to the ice through the conducting wall is constant P, until thermal equilibrium is reached. The temperature T of the liquid water and the ice are given in graph as functions of time t. Temperature of the compartments remain homogeneous during whole heat transfer process. Given specific heat of ice =2100 J//kg-K , specific heat of water =4200 J//kg-K , and latent heat of fusion of ice =3.3xx10^5 J//kg . Initial mass of the ice in the container equal to
View SolutionA cylindrical rod of heat capacity 120J/K in a room temperature 27∘C is heated internally by heater of power 250W, The steady state temperature attained by the rod is 37∘C. Fin the following:
(a) The initial rate of increse in temperature
(b) The steady state rate of emission of radiant heat.
If the heater is switched off, find
(c) The initial rate of decrease is temperature
(d) The rate of decrease in temperature of the cylinder when its temperature falls to 31∘C and
(e) The maximum amount of heat lost by the cylinder
View SolutionA block is kept in a room which is at 20^(@)C . To raise the temperature of the block, heat is given to it at a constant rate of 600 watt (using an electric heater). The temperature of the block rises with time as shown in the graph. The slope of the graph at time t = 0 is 3^(@)C s^(-1) . Once the temperature rises to 60^(@)C , the heater is switched off and another heater is switched on to maintain the temperature of the block at 60^(@)C . This new heater supplies heat at a constant rate of 100 watt. Assume that heat capacity of the block remains constant for the range of temperature involved. (a) Explain why the slope of the given graph is decreasing with time. (b) Calculate the heat capacity of the block. (c) If the 100 W heater is also switched off, what will be initial rate of cooling of the block? (d) Assuming that rate of heat loss by the block to the surrounding is proportional to difference in its temperature with surrounding, calculate the heat radiated per second by the block when it was at 30^(@)C .
View SolutionA sample of an ideal gas is heated doubling its absolute temperature . Which of the following statements best describes the result of heating the gas?
View Solution
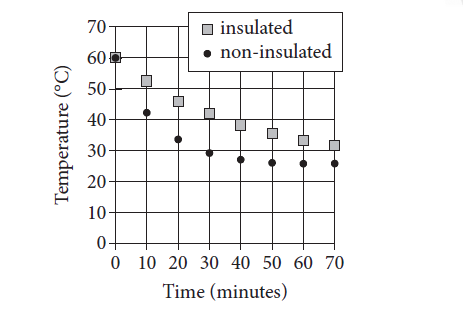
Two samples of water of equal mass are heated to 60 degrees Celsius (°C). One sample is poured into an insulated container, and the other sample is poured into a non-insulated container. The samples are then left for 70 minutes to cool in a room having a temperature of 25°C. The graph above shows the temperature of each sample at 10-minute intervals. Which of the following statements correctly compares the average rates at which the temperatures of the two samples change?
View Solution−20∘C तापमान का बर्फ के एक ब्लॉक (block) को धीरे-धीरे गर्म किया जाता है तथा 100∘C ताप पर यह भाप में बदल जाता है। निम्न में से कौन-सा ग्राफ अत्यधिक सन्निकट है?
View SolutionA block of ice at temperature −20∘C is slowly heated and converted to steam at 100∘C. Which of the following diagram is most appropriate?
View SolutionA 0.60 kg sample of water ans a sample of ice are placed in two compartments A and B that are separated by a conducting wall in a thermally insulated container. The rate of heat transfer from the water to the ice through the conducting wall is constant P, until thermal equilibrium is reached. The temperatures T of the liquid water and the ice are given in graph as functions of time t. Temperatures of the compartments remain homogeneous during the whole heat transfer process. Given, specific heat of ice = 2100 J/kg-K Specific heat of water = 4200 J/kg-K latent heat of fusion of ice = 3.3 xx 10^(-5) J/kg The value of rate P is
View SolutionA 0.60 kg sample of water ans a sample of ice are placed in two compartments A and B that are separated by a conducting wall in a thermally insulated container. The rate of heat transfer from the water to the ice through the conducting wall is constant P, until thermal equilibrium is reached. The temperatures T of the liquid water and the ice are given in graph as functions of time t. Temperatures of the compartments remain homogeneous during the whole heat transfer process.
Given, specific heat of ice = 2100 J/kg-K
Specific heat of water = 4200 J/kg-K
latent heat of fusion of ice = 3.3×10⁻⁵ J/kg

The initial mass of the ice in the container is equal to
View SolutionA block of ice at temperature −20∘C is slowly heated and converted to steam at 100∘C . Which of the following diagram is most appropriate?
View Solutionकिसी समांग पदार्थ के नमूने को एक समान दर से ऊष्मा प्रदान की गई। नीचे दिए चित्र के अनुरूप उसके ताप का समय के साथ ग्राफ खिंचा गया। नीचे दिए गए निष्कर्षो में कौनसा सही है ?

View Solution
A 0.60 kg sample of water and a sample of ice are placed in two compartmetnts A and B separated by a conducting wall, in a thermally insulated container. The rate of heat transfer from the water to the ice through the conducting wall is constant P, until thermal equilibrium is reached. The temperature T of the liquid water and the ice are given in graph as functions of time t. Temperature of the compartments remain homogeneous during whole heat transfer process. Given specific heat of ice =2100J/kg−K, specific heat of water =4200J/kg−K, and latent heat of fusion of ice =3.3×10⁵J/kg.
The value of rate P is?
View Solution

