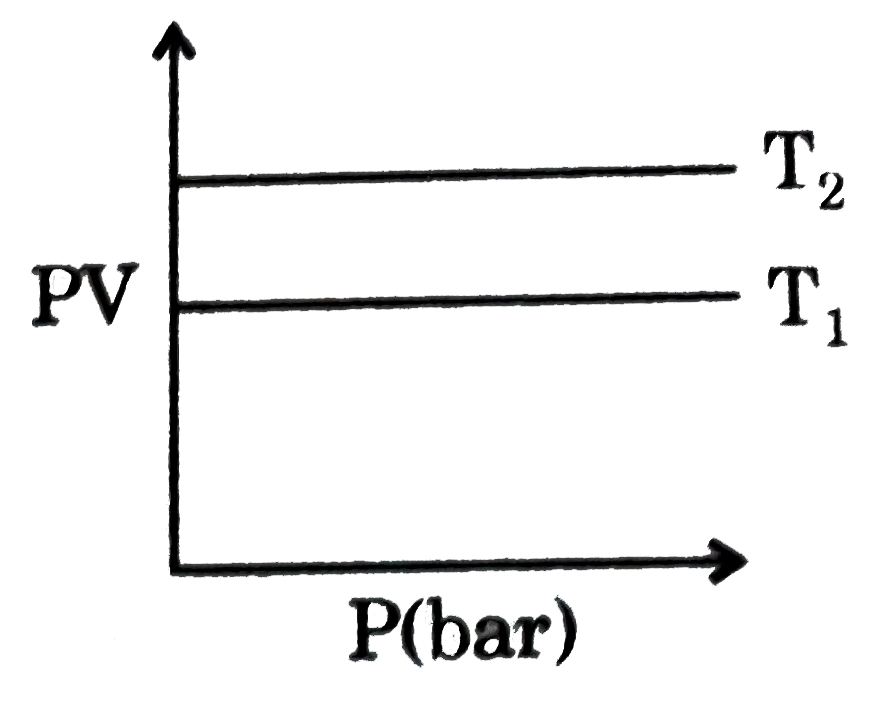
The product of PV is plotted against P at two temperatures T1 and T2 and the result is shown in figure. What is correct about T1 and T2?

T1>T2
T2>T1
T1=T2
T1+T2=1
The correct Answer is:B
Similar Questions
At two different temperature T_(1) and T_(2), (T_(2) gt T_(1)) , draw two PV-P graphs for a definite amount of an ideal gas.
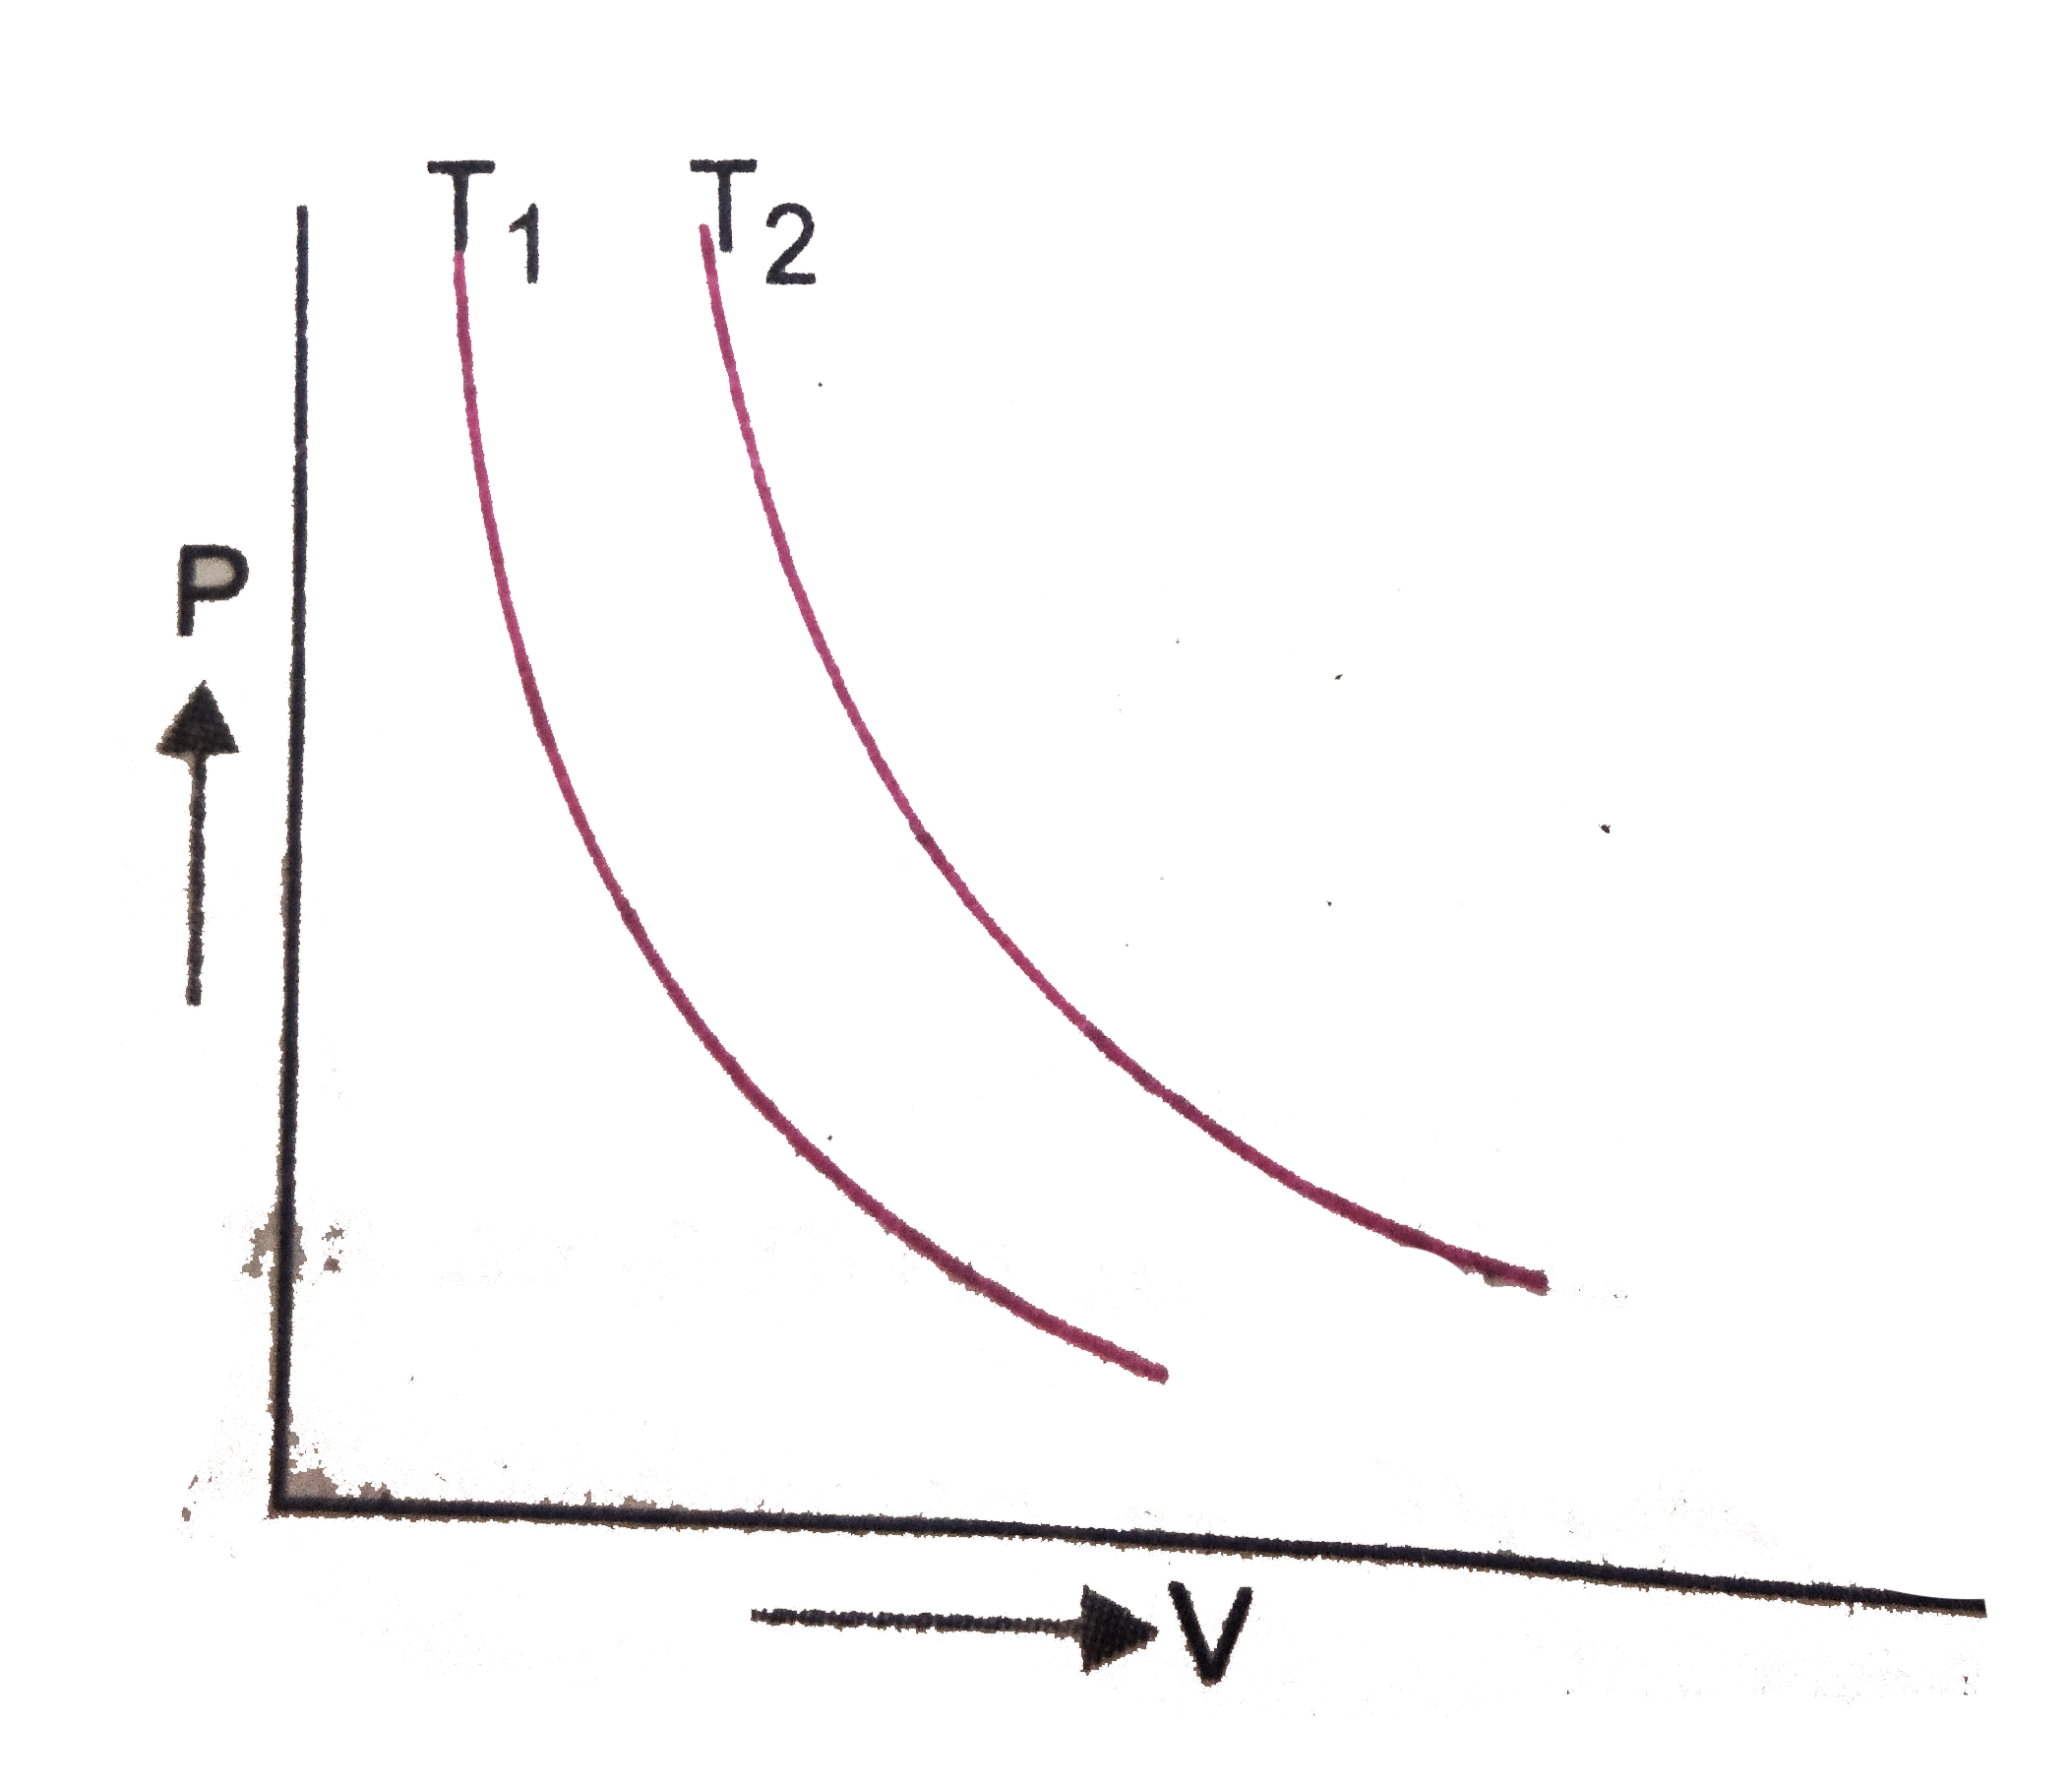
View SolutionIsothermal curves for a given mass of gas are shown at two different temperture T1andT2 in Fig. State whether T1>T2orT2>T1. Justify your answer.

View SolutionFreundlich adsorption isotherms for the physical adsorption of a gas at temperature T_(1), T_(2) and T_(3) are shown in the graph given below. The correct relationship between T_(1), T_(2) and T_(3) is
View Solutionनिम्न चित्रों में T1 तथा T2(T2>T1) ताप पर कृष्ण वस्तु हेतु ऊर्जा वितरण दर्शाये गये हैं, कौन सा ग्राफ सही है
View SolutionThe V - i graph for a conductor at temperature T_(1) and T_(2) are as shown in the figure. ( T_(2) - T_(1)) is proportional to
View SolutionV - I graph of a conductor at temperature T_(1) and T_(2) are shown in the figure (T_(2)-T_(1)) is proportional to
View SolutionIf t_(1)+t_(2)+t_(3)=-t_(1)t_(2)t_(3) , Then points [at_(1)t_(2),a(t_(1)+t_(2))] , [at_(2)t_(3),a(t_(2)+t_(3))] And [at_(3)t_(1),a(t_(3)+t_(1))] The perpendicular of the triangle with vertices will be
View SolutionThe stress-strain graph for a metallic wire is shown at two different temperature, T_(1) and T_(2) which temperature is high T_(1) or T_(2) ?
View Solution

