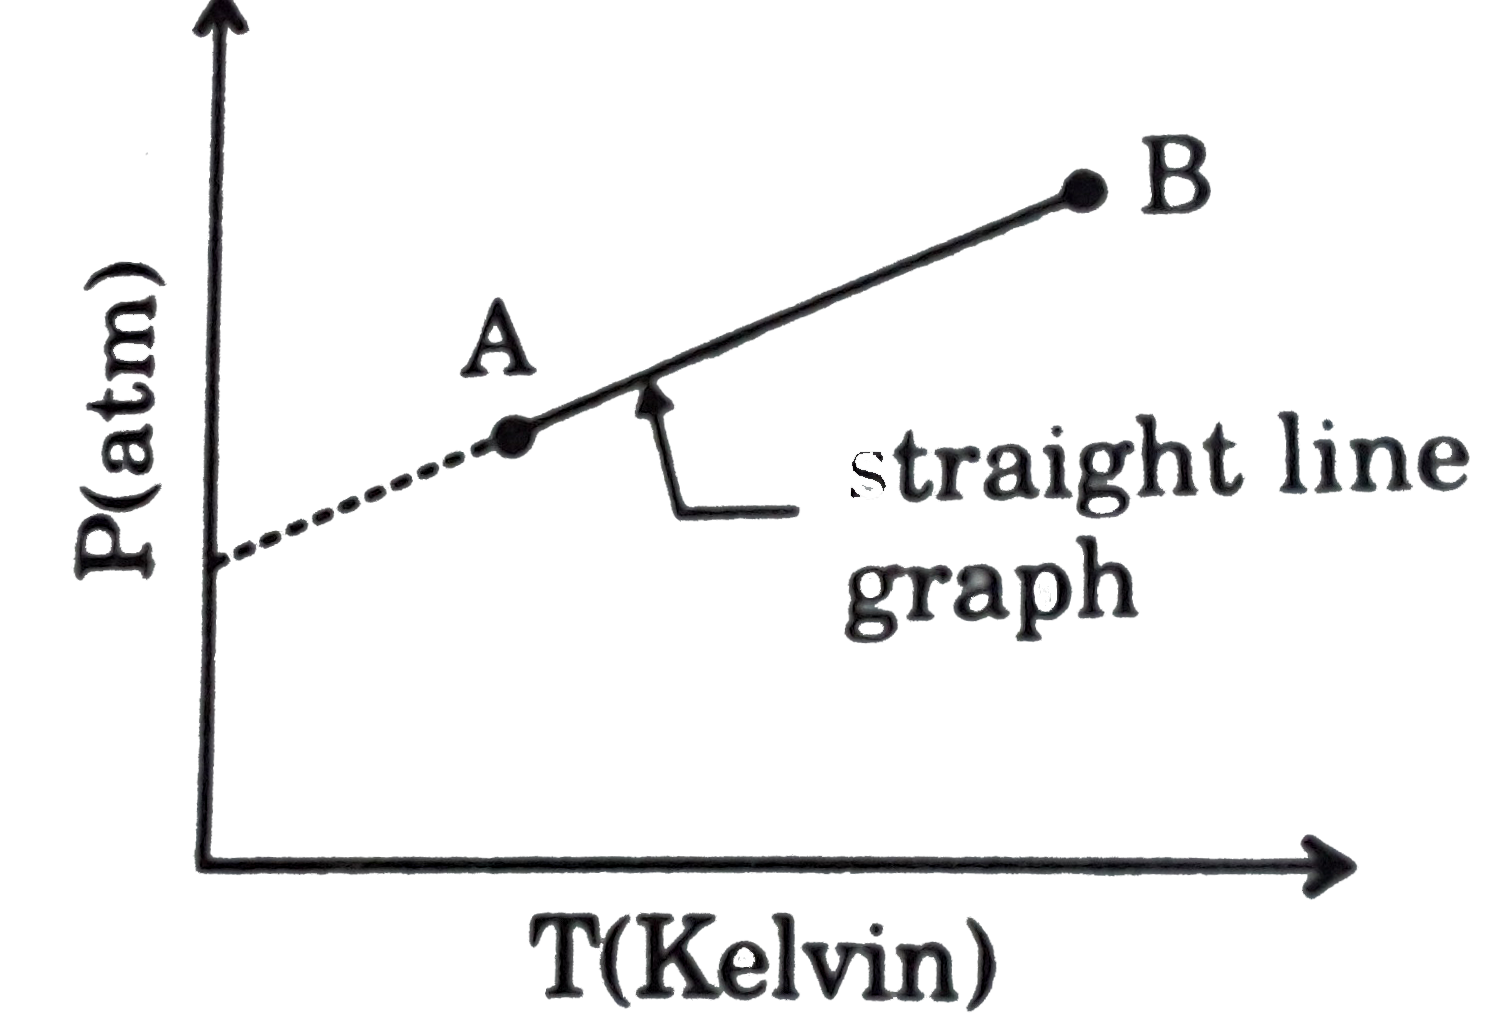
For a fixed amount of an ideal gas P us T plot is given as shown. Identify the correct option.

The change from A to B should be isochoric
Volume first increases reached maxima and then decreases
PV=nRT is not applicable
None of the statements are correct
The correct Answer is:D
Similar Questions
When a sample of ideal gas is changed from an initial state to a final state, various curves can be plotted for the process like P-V curve, V-T curve,P-T curve etc. For example, P-V curve for a fixed amount of an ideal gas at constant temperature is a rectangular hyperbola, V-T curve for a fixed amount of an ideal gas at constant volume is again a straight line. However, the shapes may vary if the constant parameters are also changed. Now, answer the following questions : From the given plot between Z and P for a real gas the correct is :
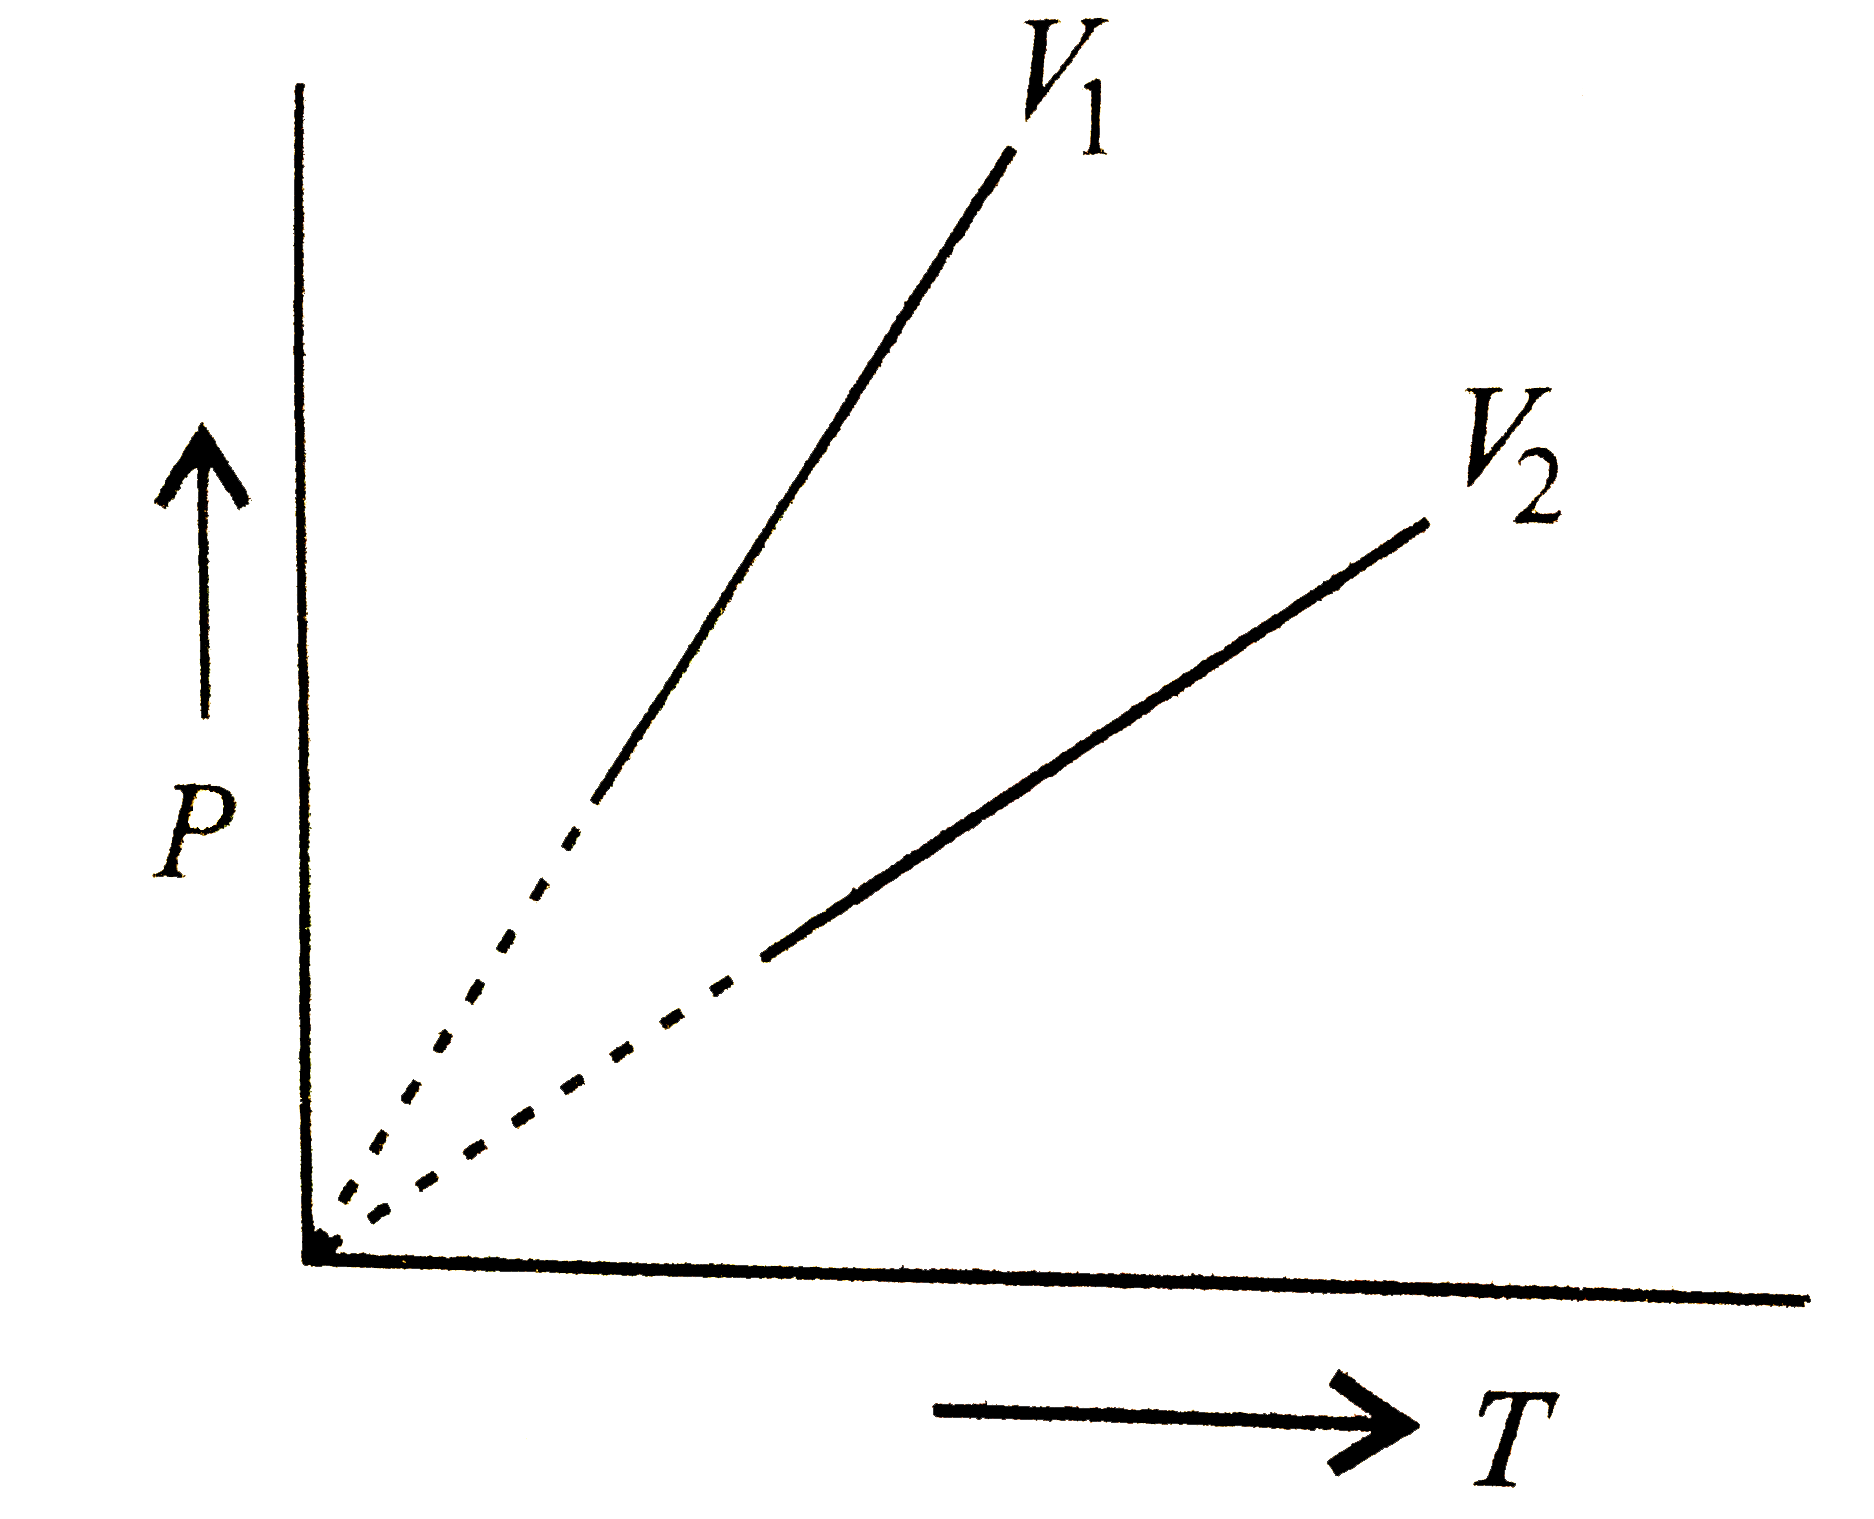
View SolutionA plot of P vs T for a given mass of gas at constant volume is a straight line . P vs T at constant volumes V1 and V2 for an ideal gas are shown below :
Which of the following is correct ?

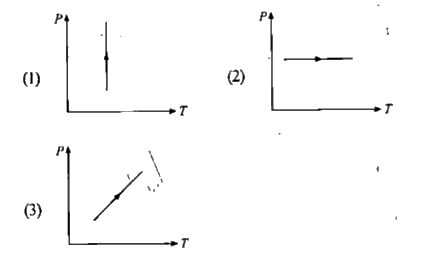
View SolutionP-T graphs of an ideal gas are as shown in figures-2.42 below. Choose the wrong statement from the options given:

View SolutionWhich of the following is a correct plot of the volume of fixed amount of ideal gas as a function of temperature (at constant pressure)
View SolutionThe graph of P vs T is a straight line for a given mass of a gas at a fixed volume. Fixed volume for an ideal gas V_(1) "व" V_(2) But P vs T is shown Which of the following is correct ?
View SolutionA plot of P vs T for a given mass of gas at constant volume is a straight line . P vs T at constant volumes V_(1) and V_(2) for an ideal gas are shown below : Which of the following is correct ?
View SolutionPlot P-V, V-T and p-T graph correspongidng to the P-T graph for an ideal gas shown in figure.
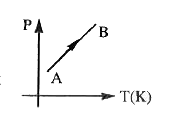
View SolutionThe P-T graph for the given mass of an ideal gas is shown in figure. Then the volume

View Solution

