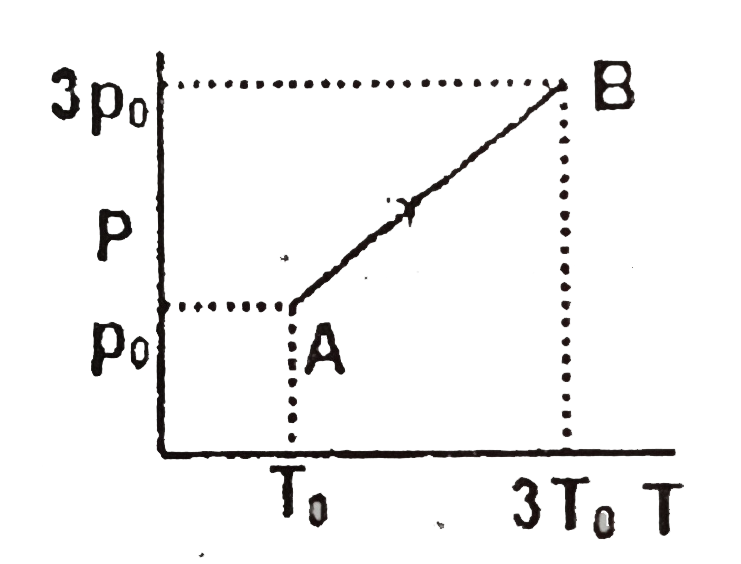
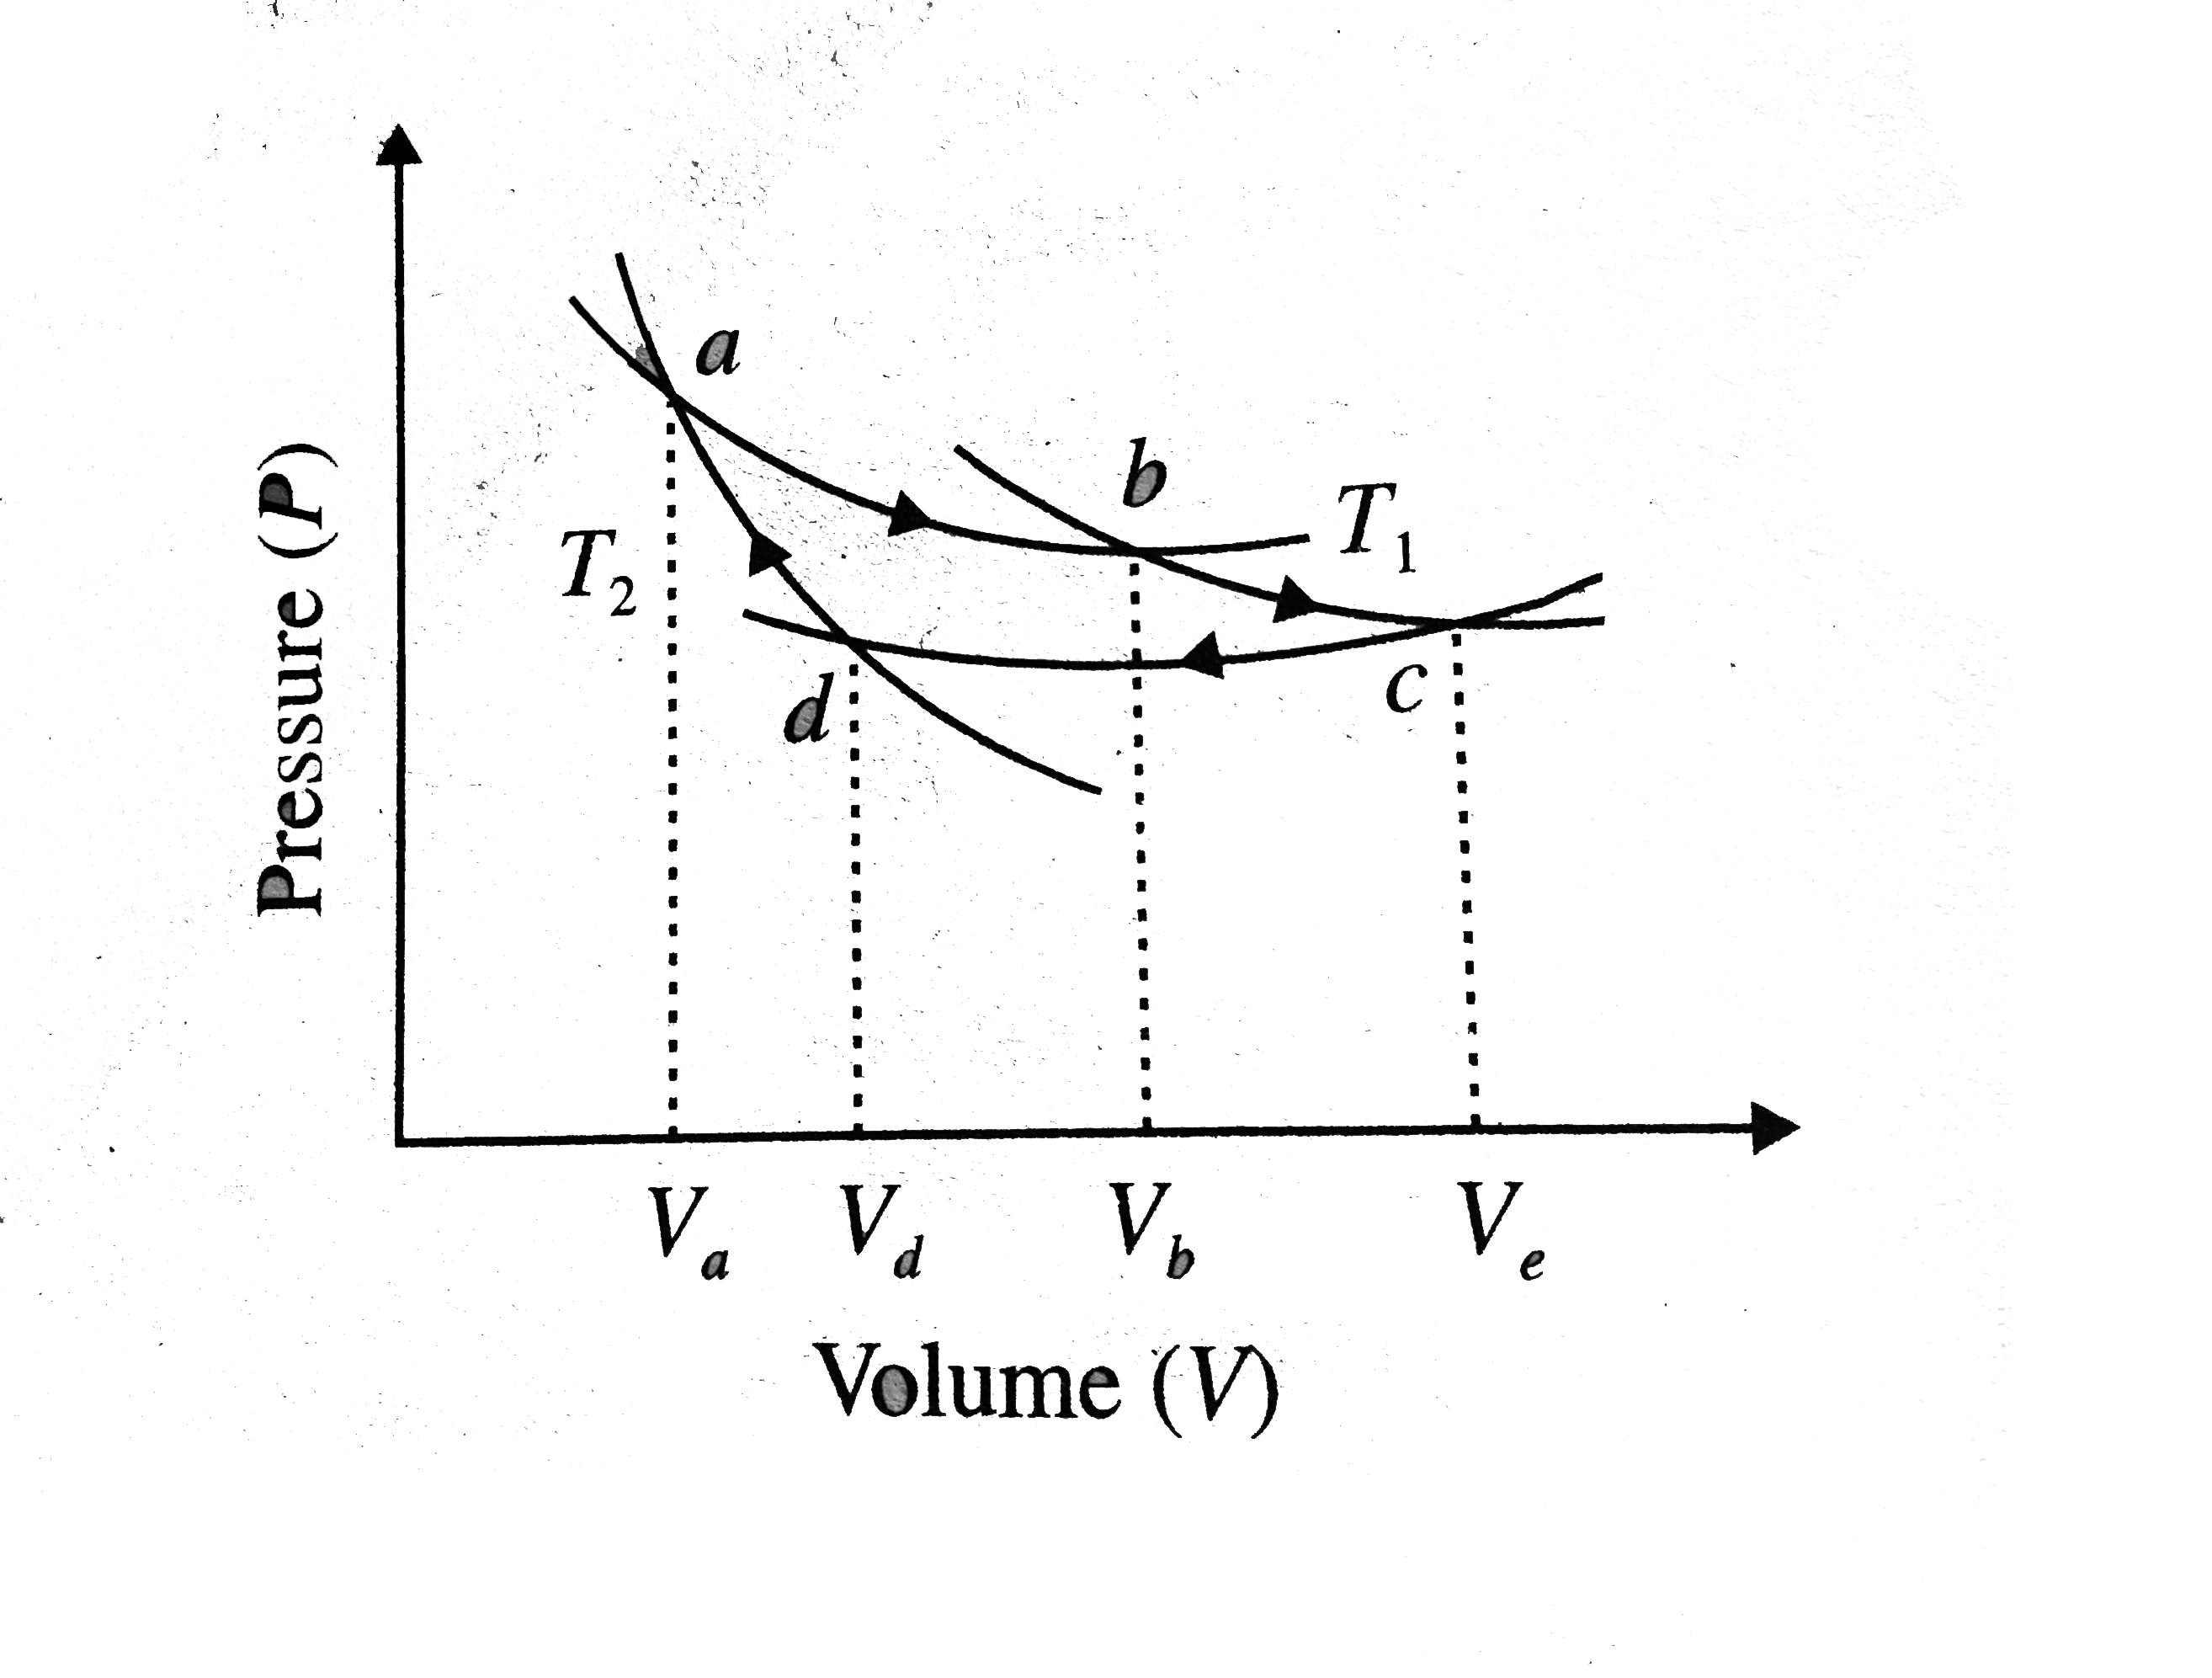
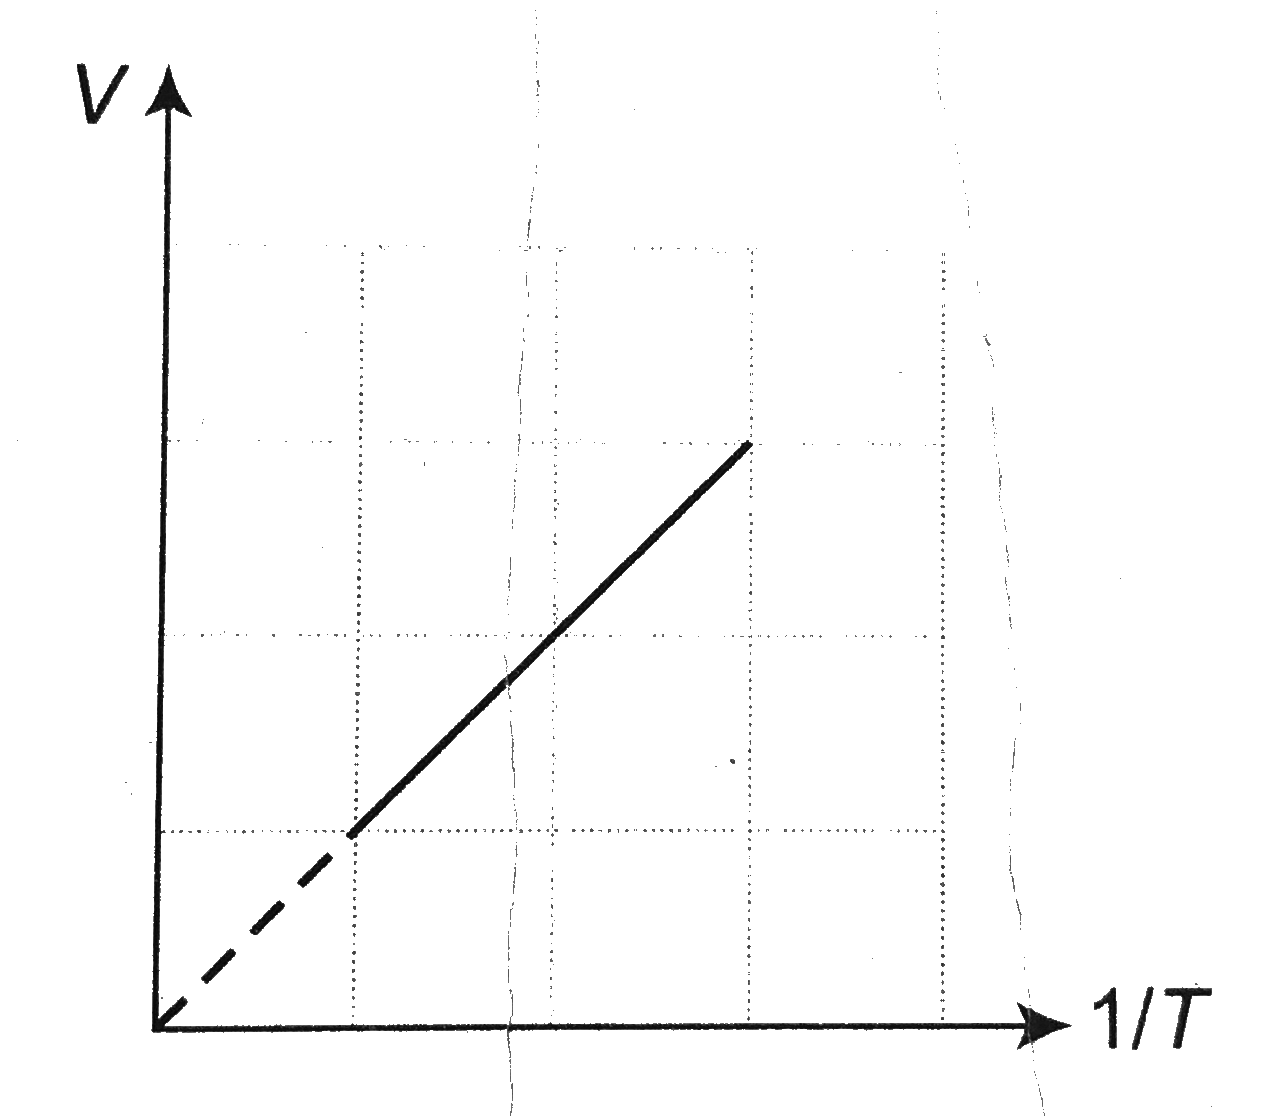
One moles of an ideal monoatomic gas undergo the state change as shown in following graph (ln 2 = 0.7)
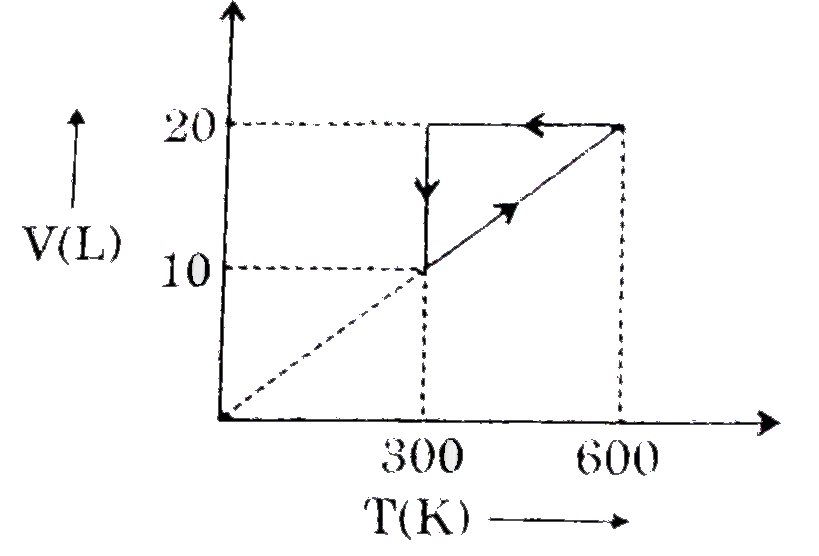
Correct graph for the process in paragraph is:
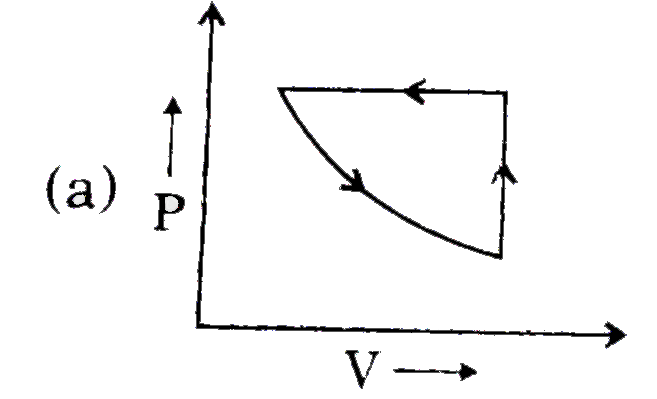
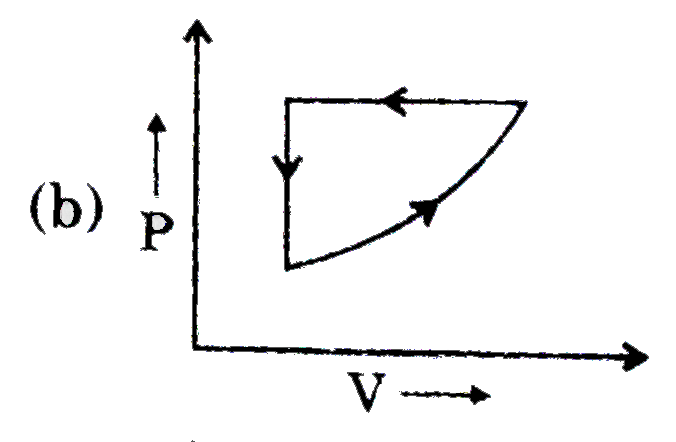
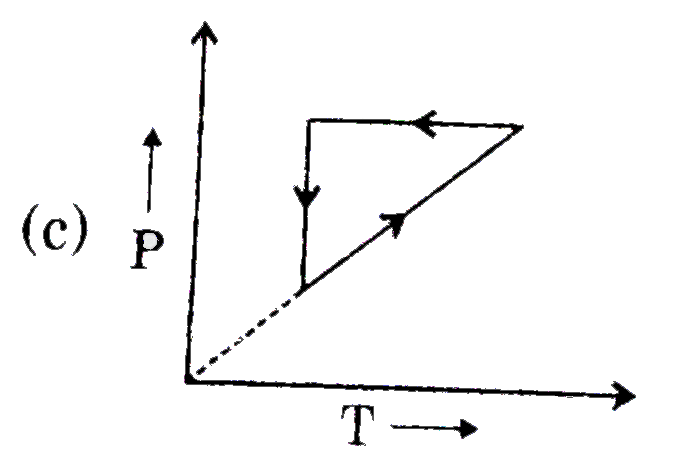
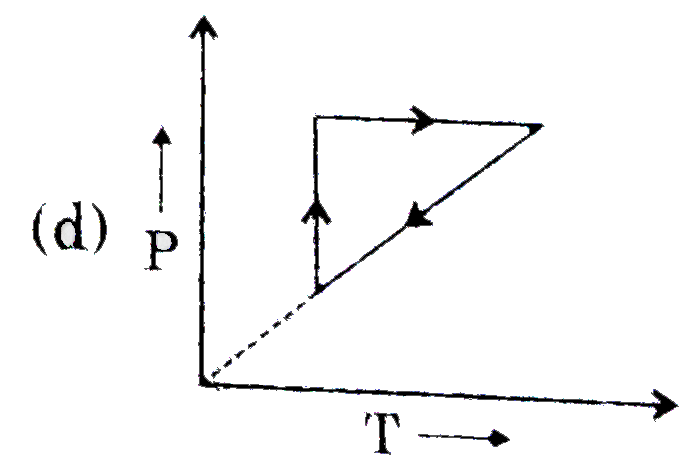
The correct Answer is:D
Step by step video, text & image solution for One moles of an ideal monoatomic gas undergo the state change as shown in following graph (ln 2 = 0.7) Correct graph for the process in paragraph is: by Chemistry experts to help you in doubts & scoring excellent marks in Class 12 exams.
Updated on:21/07/2023Similar Questions
Knowledge Check
One moles of an ideal monoatomic gas undergo the state change as shown in following graph (ln 2 = 0.7)
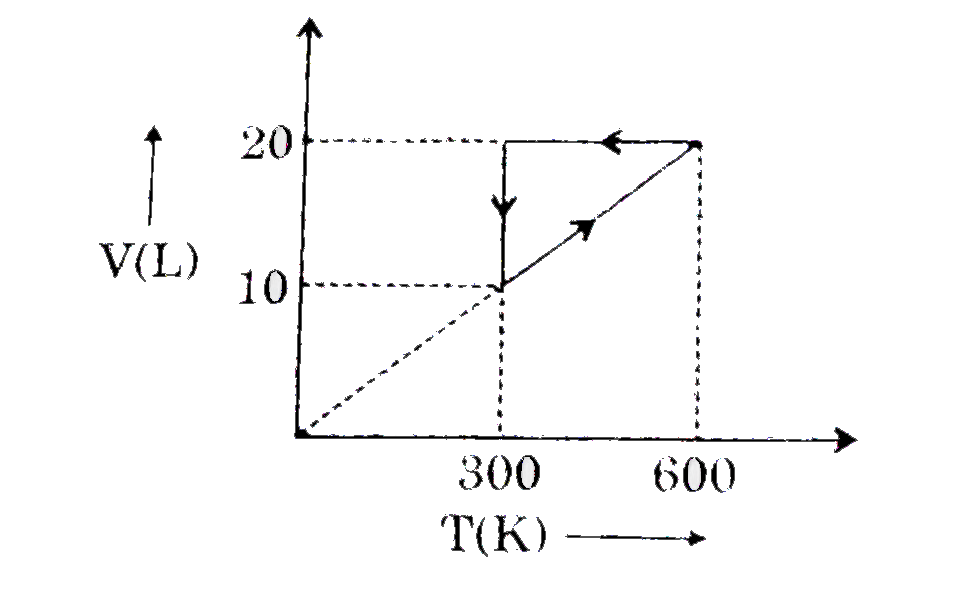
Efficiency of the cycle will be :A50%B25%C13.63%D12%One mole of an ideal monoatomic gas undergoes a process as shown in the figure. Find the molar specific heat of the gas in the process.
R is a gas constant.A3R4BR2CR3D2R3Two moles of an ideal monoatomic gas undergoes a cyclic process ABCA as shown in V-T diagram below:

Heat supplied to the gas during the process AB is :A1200Rln2B1800 RC1200 RDZero
One mole of an ideal monoatomic gas undergoes a described by the equations PV3= constant The heat the gas during this process is :
View SolutionOne mole of an ideal monoatomic gas undergoes a cyclic process as shown in figure . Temperature at point 1 =300K and process 2−3 is isothermal .
_S01_113_O01.png) .
.
Net work done by gas in complete cycle is
View SolutionOne mole of an ideal monoatomic gas undergoes a cyclic process as shown in figure . Temperature at point 1 =300K and process 2−3 is isothermal .
_S01_114_O01.png)
Heat capacity of process 1→2 is
View SolutionOne mole of an ideal monoatomic gas undergoes a cyclic process as shown in figure . Temperature at point 1 =300K and process 2−3 is isothermal .
_S01_115_O01.png)
The efficiency of cycle is
View SolutionOne mole Of an ideal triatomic gas undergoes compression process adiabatically . Then:
View Solution


