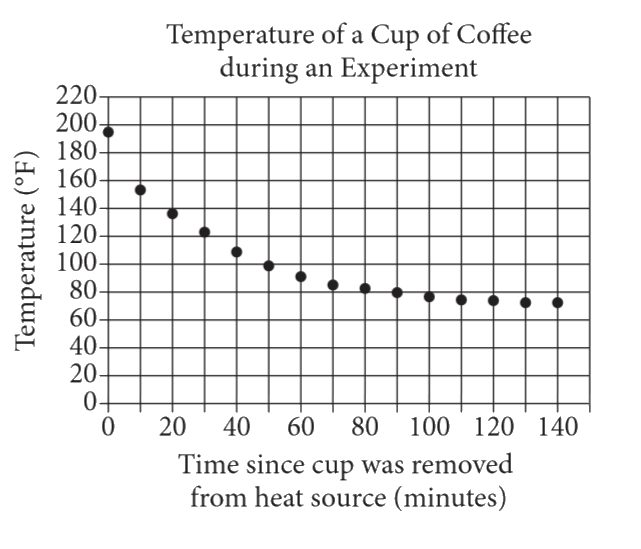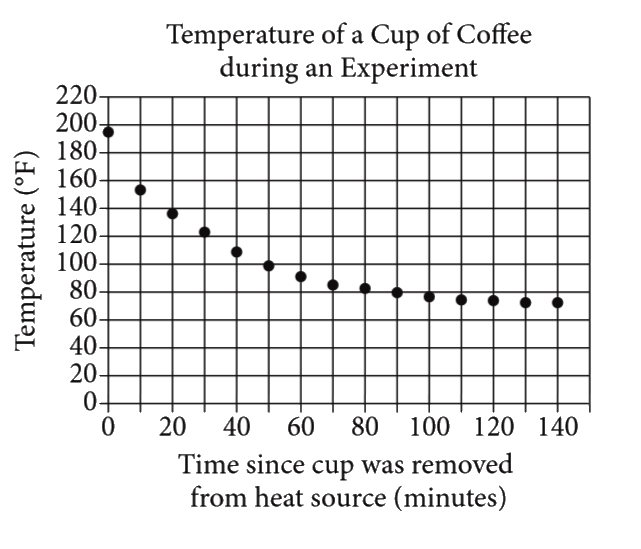
In an experiment, a heated cup of coffee is removed from a heat source, and the cup of coffee is then left in a room that is kept at a constant temperature. The graph above shows the temperature, in degrees Fahrenheit (.∘F), of the coffee immediately after being removed from the heat source and at 10-minute intervals thereafter.
Of the following, which best approximates the temperature, in degrees Fahrenheit, of the coffee when it is first removed from the heat source?
75
100
155
195
The correct Answer is:D
The x-axis of the graph represents the time, in minutes, after the coffee was removed from the heat source, and the y-axis of the graph represents the temperature, in degrees Fahrenheit, of the coffee. The coffee was first removed from the heat source when x = 0. The graph shows that when x = 0, the y-value was a little less than 200∘F. Of the answer choices given, 195 is the best approximation.
Choice A is incorrect and may result from finding the temperature after 140 minutes. Choice B is incorrect and may result from finding the temperature after 50 minutes. Choice C is incorrect and may result from finding the temperature after 10 minutes.
Similar Questions

In an experiment, a heated cup of coffee is removed from a heat source, and the cup of coffee is then left in a room that is kept at a constant temperature. The graph above shows the temperature, in degrees Fahrenheit (.∘F), of the coffee immediately after being removed from the heat source and at 10-minute intervals thereafter.
During which of the following 10-minute intervals does the temperature of the coffee decrease at the greatest average rate?
View SolutionThe absolute zero temperature in Fahrenheit scale is
View SolutionThe absolute zero temperature in Fahrenheit scale is
View Solutionif quantity of heat 1163.4 J supplied to one mole of nitrogen gas , at room temperature at constant pressure , then the rise in temperature is
View SolutionA solution is to be kept between 300C and 350C . What is the range of temperature in degree Fahrenheit?
View SolutionIn a carnot engine, when heat is absorbed from the source, its temperature
View SolutionIn the above problem if heat is supplied at a constant rate of q=10cal/min, then plot temperature versus time graph.
View SolutionIf a piece of metal is heated to temperature θ and the allowed to cool in a room which is at temperature θ0, the graph between the temperature T of the metal and time t will be closet to
View SolutionAt what temperature the Fahrenheit and Celsius scales of temperature give the same reading ?.
View SolutionAt what temperature the Fahrenheit and Celsius scales of temperature give the same reading ?.
View Solution

