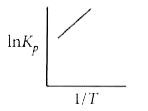
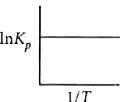
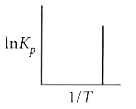
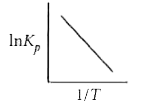
Which of the following plots represents schematically the dependence of the time period of a pendulum if measured and plotted as a function of its oscillations? (Note : amplitude need not be small)
A

B

C

D

Video Solution
Text Solution
The correct Answer is:A
|
Answer
Step by step video, text & image solution for Which of the following plots represents schematically the dependence of the time period of a pendulum if measured and plotted as a function of its oscillations? (Note : amplitude need not be small) by Physics experts to help you in doubts & scoring excellent marks in Class 12 exams.
Updated on:21/07/2023Similar Questions
Knowledge Check
Which of the following plots represents an exothermic reaction?
A B
B C
C D
D
Which of the following plots represents an exothermic reaction?
A B
B C
C D
D
Which of the following plots represents an ideal binary mixture?
Aplot of Ptotalv/s1/XB is linear (XB= mole fraction of 'B' in liquid phase)Bplot of Ptotalv/sYA is linear (YB= mole fraction of 'A' in vapour phase)Cplot of 1Ptotalv/sYA is linearDplot of 1Ptotalv/sYB is non linear
Which of the following plots represents an ideal binary mixture ?
View SolutionWhich of the following plots does not represent Boyle's law?
View SolutionWhich of the following plots may represent is impedence of a series LCR combination?
View SolutionWhich of the following plots represents correctly the variation of conductivity with concentration?
View SolutionWhich of the following plots represents the behavior of an ideal binary liquid solution ?
View Solution

