A student performs an experiment to determine the acceleration due to gravity g. The student throws a steel ball up with initial velocity u and measures the height h travelled by it at different times t. The graph the student should plot on a graph paper to readily obtain the value of g is
h versus t.
h versus t2
h versus √t
ht versus t
The correct Answer is:D
Step by step video, text & image solution for A student performs an experiment to determine the acceleration due to gravity g. The student throws a steel ball up with initial velocity u and measures the height h travelled by it at different times t. The graph the student should plot on a graph paper to readily obtain the value of g is by Physics experts to help you in doubts & scoring excellent marks in Class 12 exams.
Updated on:21/07/2023Similar Questions
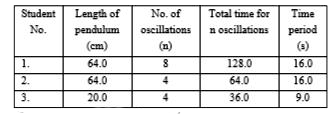
Three students S1,S2andS3 perform an experiment for determining the acceleration due to gravity (g) using a simple pendulum. They use different lengths of pendulum and record time for different number of oscillations. The observations are as shown in the table.

(Least count of length = 0.1 m least count for time = 0.1 s)
If E1,E2andE3 are the percentage errors in 'g' for students 1, 2 and 3 respectively, then the minimum percentage error is obtained by student no._____.
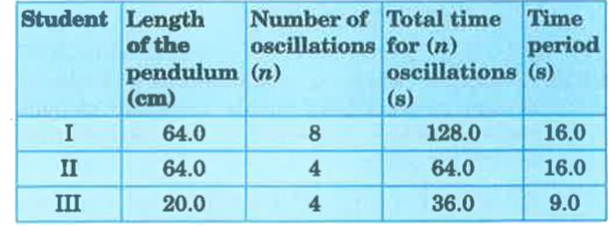
View SolutionStudent I, II and III perform an experiment for measuring the acceleratioon due to gravity (g) using a simple pendulum . Theu use different lengths of the pedulum and /or record time for different number of oscillations . The observation are shoen in the table .
Least count for length =0.1cm
Least count for time =0.1s

If EI, EIIand EIIIare the percentage errors in g,i.e
Δgg×100for students I, II, and III respectively ,
View Solution
Knowledge Check
In an experiment on simple pendulum to determine the acceleration due to gravity, a student measures the elngth of the thread as 632 cm and diameter of the pendulum bob as 2.256 cm. The student should take the lenght of the pendulum to be
A64.328cmB64.36 cmC65.456 cmD65.5 cmIn an experiment of determine acceleration due to gravity by simple pendulum, a student commits 1% positive error in the measurement of length and 3% negative error in the time then % error in g will be
A3%B4%C7%D10%A student performs an experiment an for determination of g(=4π2lT2). The error in length l is Δl and in time T is ΔTandn is number of times the reading is taken. The measurment of g is most accurate for
A(a) Δl=5mm,Δ=0.2sec,n=10B(b) Δl=5mm,Δ=0.2sec,n=20C( c ) Δl=5mm,Δ=0.1sec,n=10D( d ) Δl=1mm,Δ=0.1sec,n=50
A student performs an experiment to determine the Young's modulus of a wire, exactly2m long, by Searle's method. In a partcular reading, the student measures the extension in the length of the wire to be 0.8mmwithanuncerta∫yof+- 0.05mmataloadofexactly1.0kg,thestudentalsomeasuresthediameterofthewire→be04mmwithanuncerta∫yof+-0.01mm.Takeg=9.8m//s^(2) (exact). the Young's modulus obtained from the reading is
View SolutionStudent I,II,andIII perform an experiment for measuring the acceleration due to gravity (g) usinf a simple pendulum. They use lengths of the pendulum and // or record time for different number of oscillations . The observations are shown in the following table . Least count for length =0.1cm
StudentIIIIIILength of Pendulam(cm)64.064.020.0Number ofn Oscillation(n)844TimePeriod(s)16.016.09.0
Least count for time =0.1s.
If EI,EII , and EIII are the percentage errors in g , i.,e., (Δgg×100) for students I,II , and III, respectively , then
View SolutionIn a simple pendulum experiment for determination of acceleration due to gravity (g), time taken for 20 oscillation is measured by using a watch of 1 second least count. The mean value of time taken comes out to be 30 s. The length of pendulum is measured by using a meter scale of least count 1 mm and the value obtained is 55.0 cm. The percentage error in the determination of g is close to :
View SolutionStudents I1,J1,J3 and I2 perform an experiment for measuring the acceleration due to gravity (g) using a simple predulum, they use different lengths of the pendulum and record time for different number of oscillations. The observations are shown in the table. Least count for length =0.1cm, least count for time = 1s
StudentsLength of thependulum (cm)No.ofoscillations(n)Time periodof pendulum (s)I1100.02020J1400.01040J1100.01020I1400.02040
If P1,P2,P3 and P4 are the % error in g for students I1,J1,J3 and I2 respectively then -
View SolutionA student performs an experiment to determine how the range of a ball depends on the velocity with which it is projected. The "range" is the distance between the points where the ball lends and from where it was projected, assuming it lands at the same height from which it was projected. It each trial, the student uses the same baseball, and launches it at the same angle. Table shows the experimental results.
∣∣ ∣ ∣ ∣ ∣ ∣∣TrailLaunch speed(m/s)Range(m)110822031.833070.7440122.5∣∣ ∣ ∣ ∣ ∣ ∣∣
Based on this data, the student then hypothesizes that the range, R, depends on the initial speed v0 according to the following equation : R=Cvn0, where C is a constant and n is another constant.
The student performs another trial in which the ball is launched at speed 5.0m/s. Its range is approximately:
View Solution
