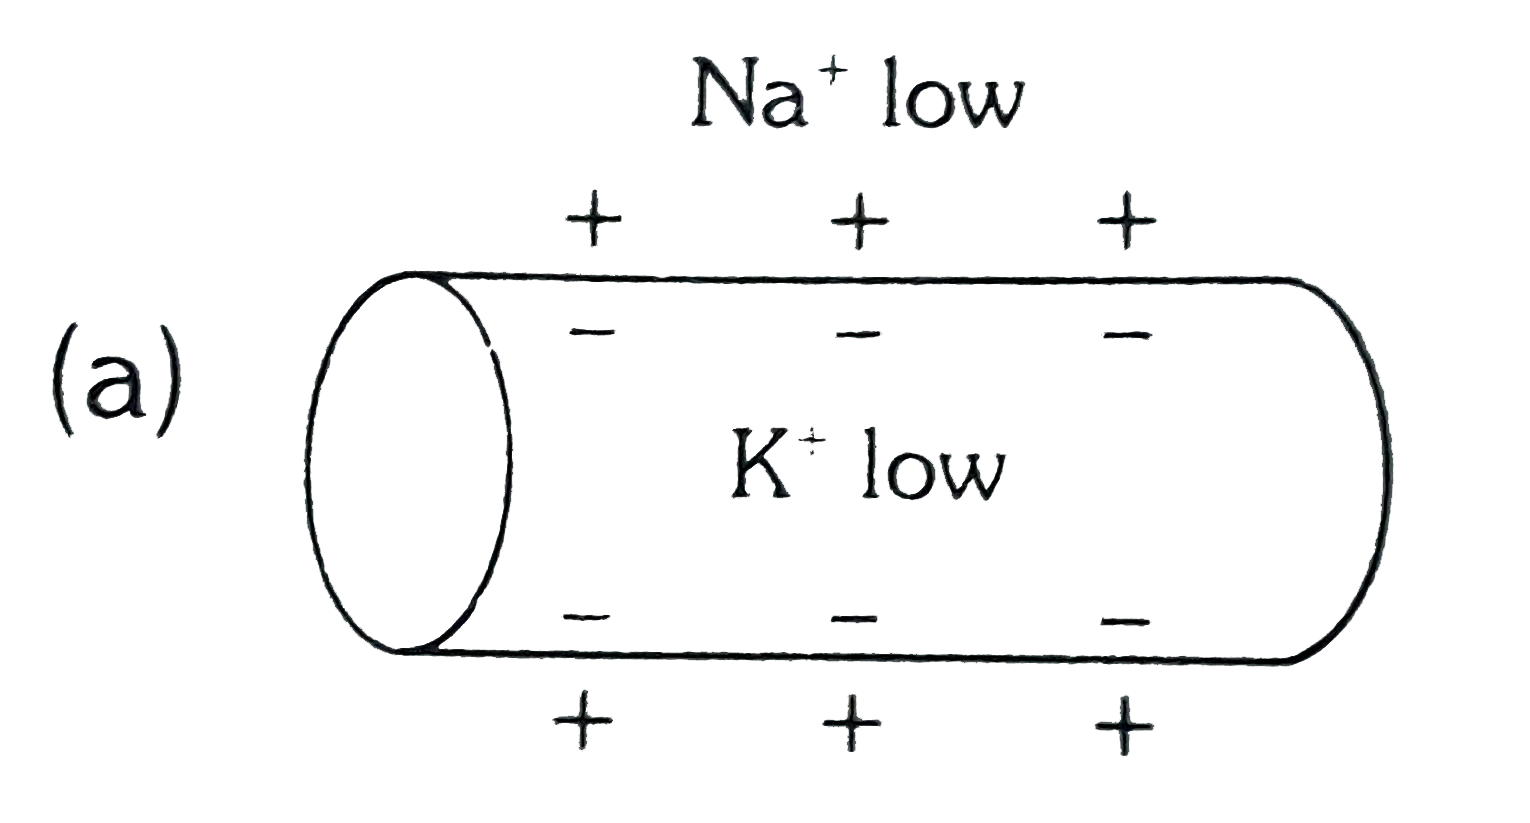
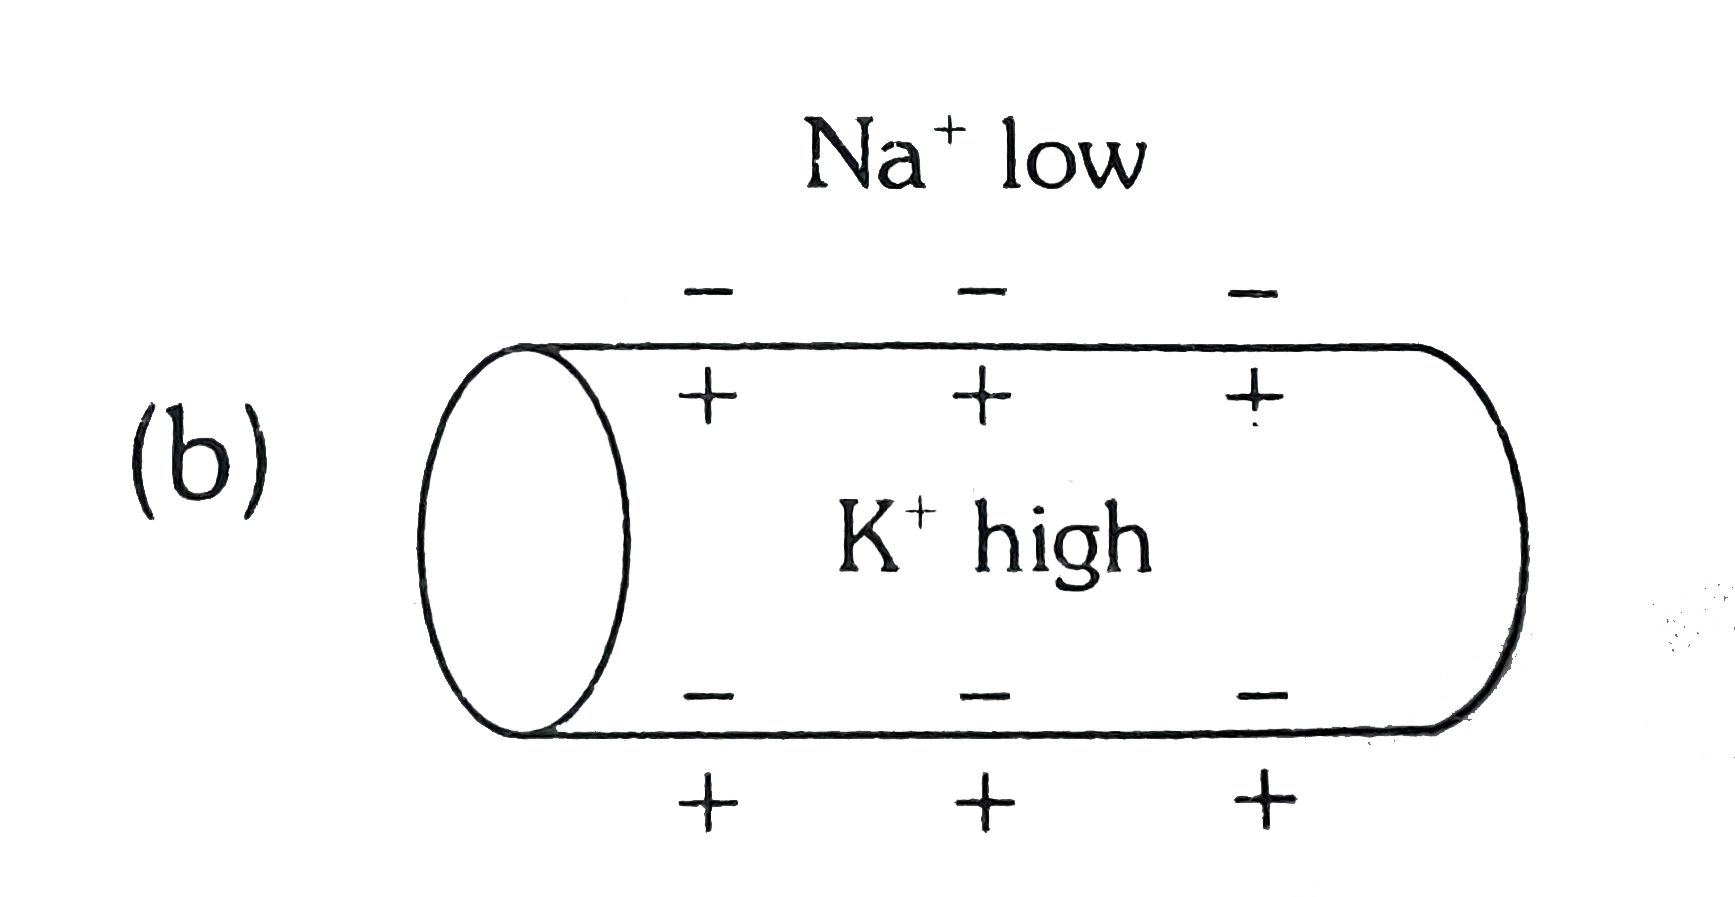
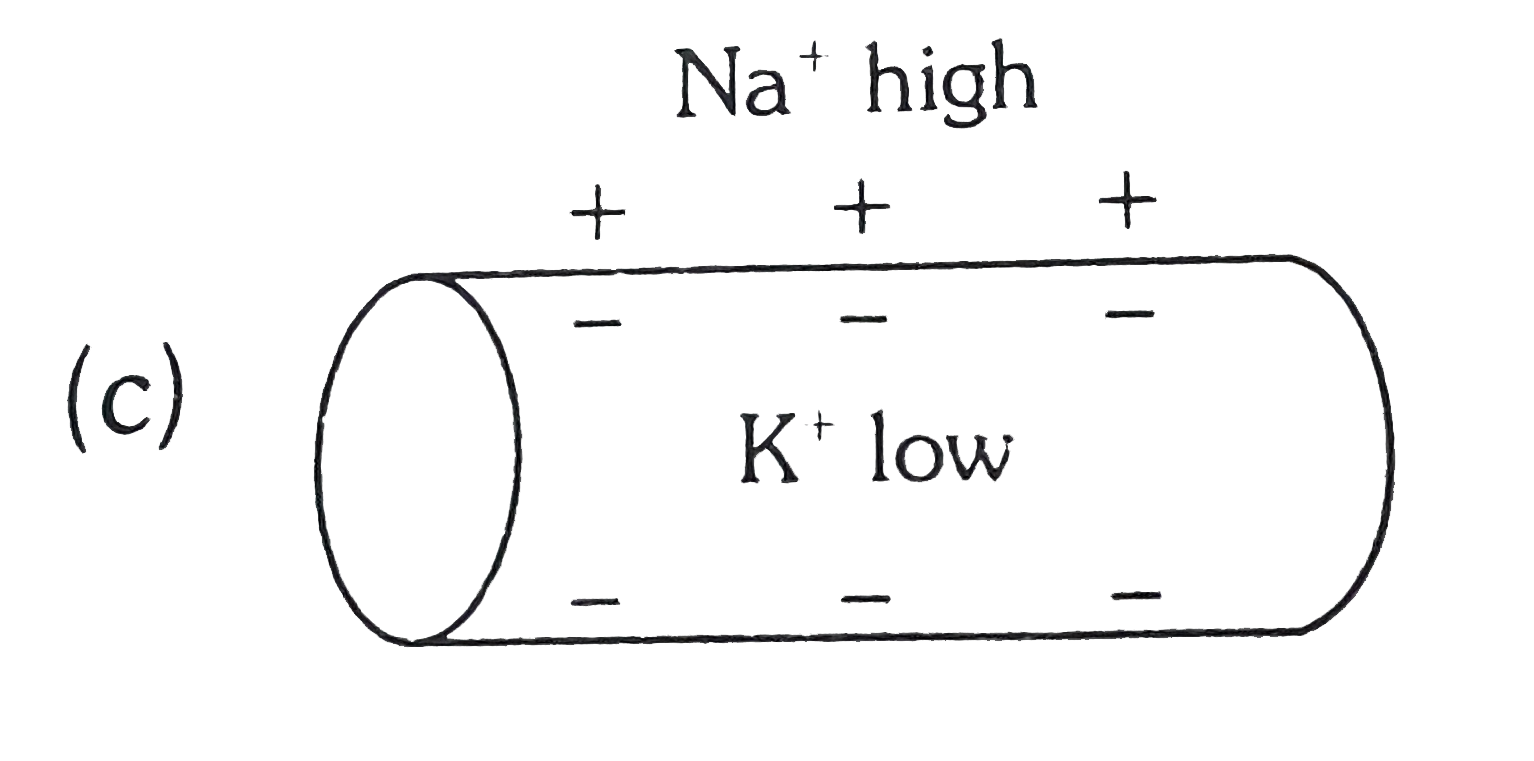
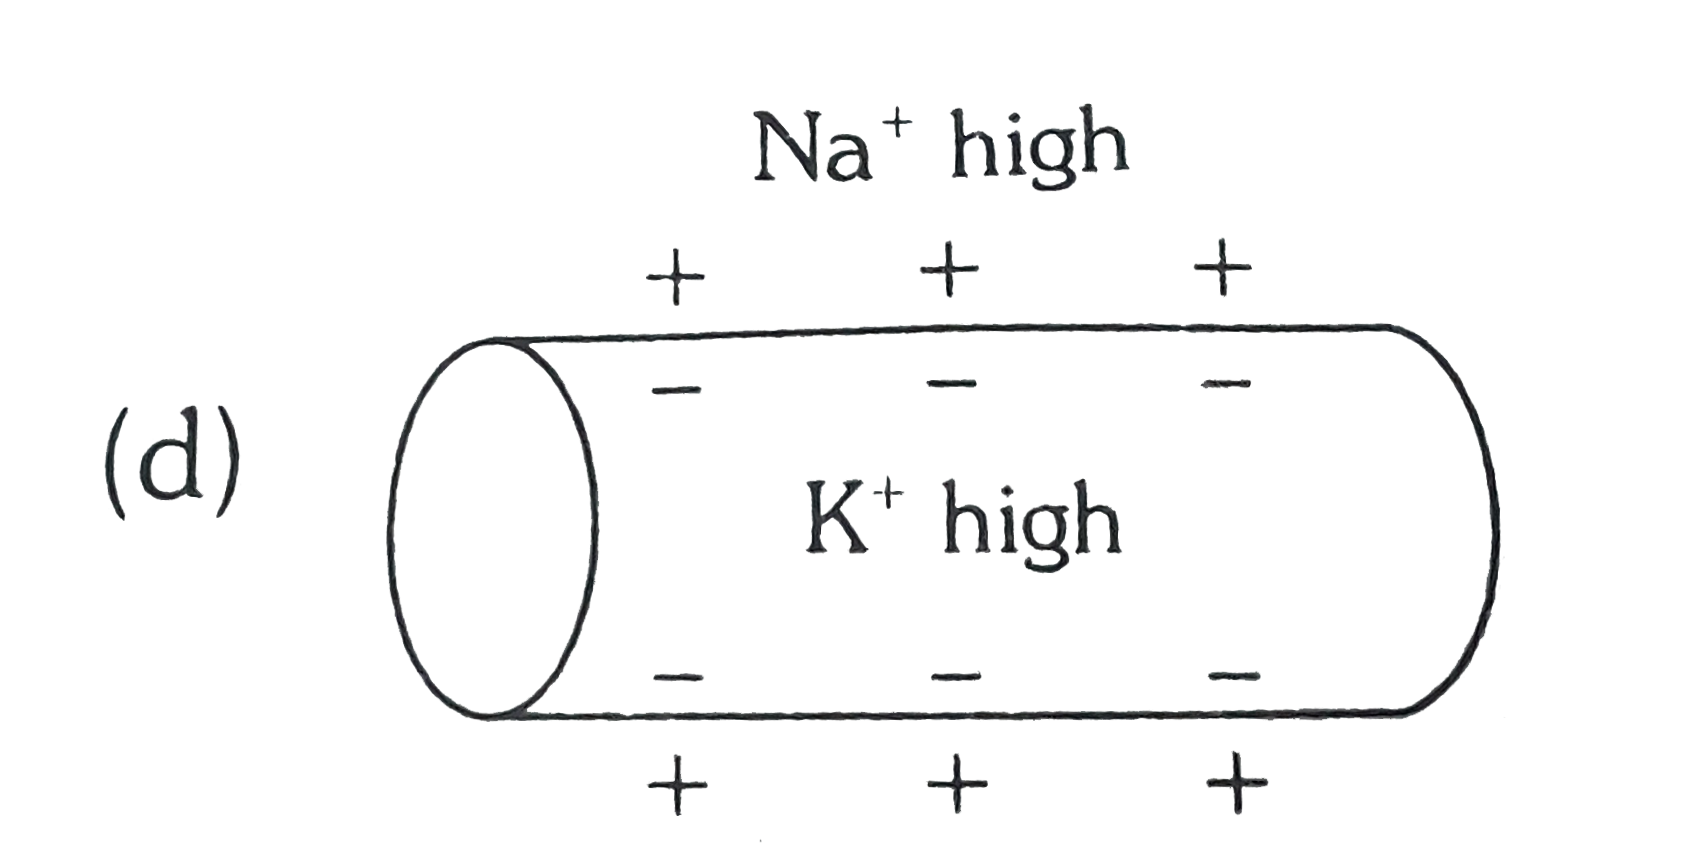
Which diagram shows the distribution of Na+and K+ ions in a section of non- myelinated axon which is at resting potential
A
B
C
D
Video Solution
Text Solution
The correct Answer is:d
|
Answer
Step by step video, text & image solution for Which diagram shows the distribution of Na^(+)and K^(+) ions in a section of non- myelinated axon which is at resting potential by Biology experts to help you in doubts & scoring excellent marks in Class 11 exams.
Updated on:21/07/2023Similar Questions
Knowledge Check
Which of the following options illustrates the distribution of Na+andK+ ions in a section of non-myelinated axon which is at resting potentail ?
A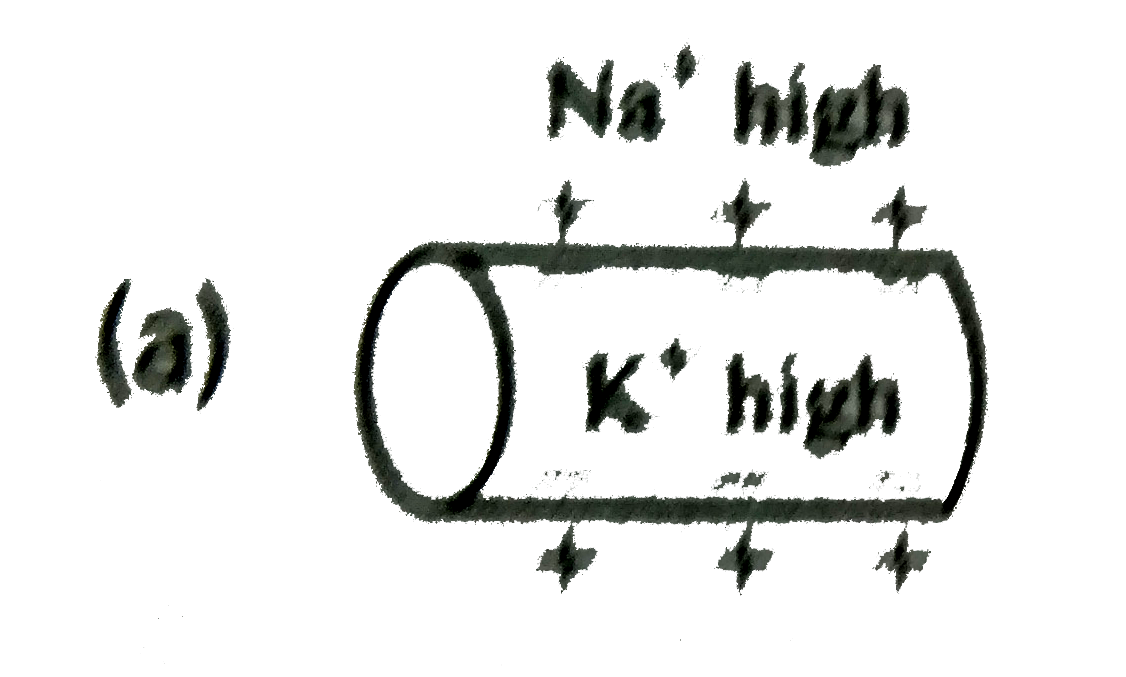 B
B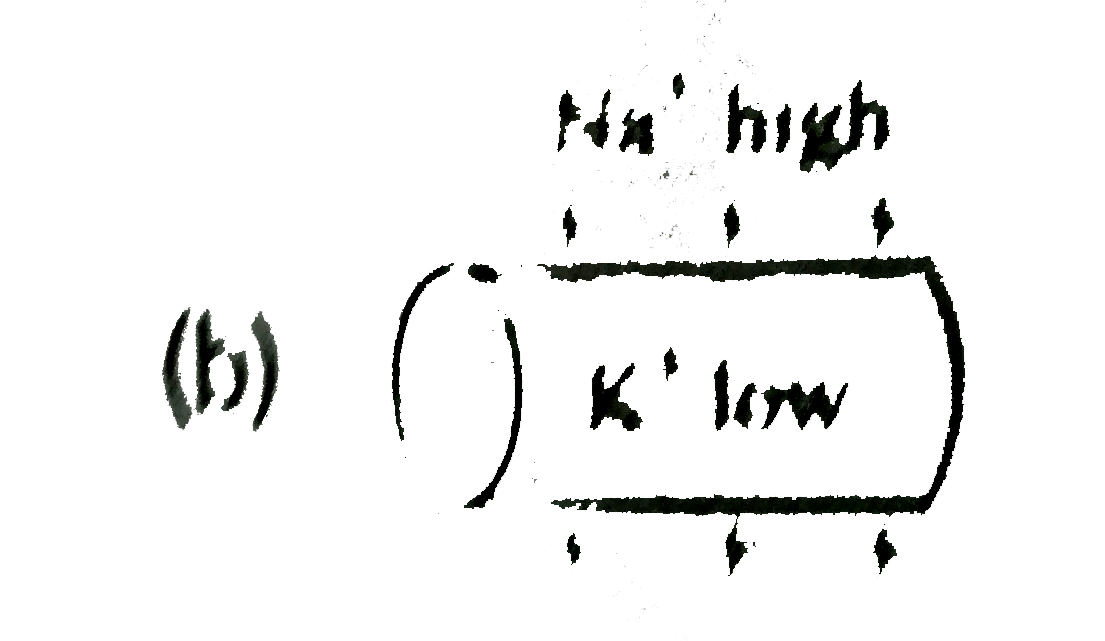 C
C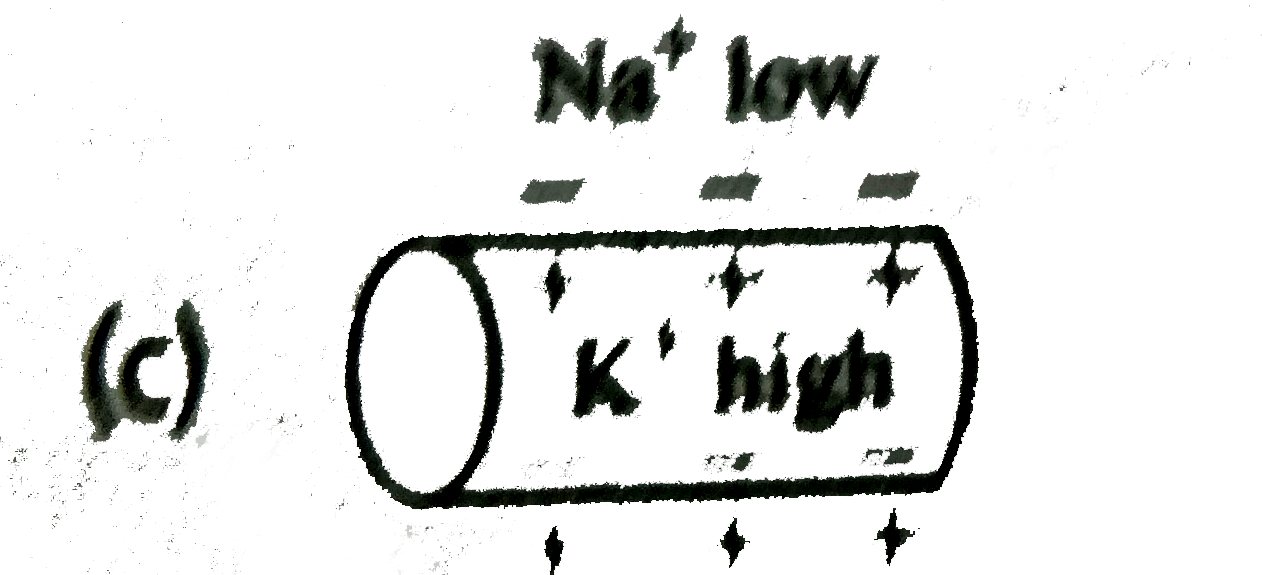 D
D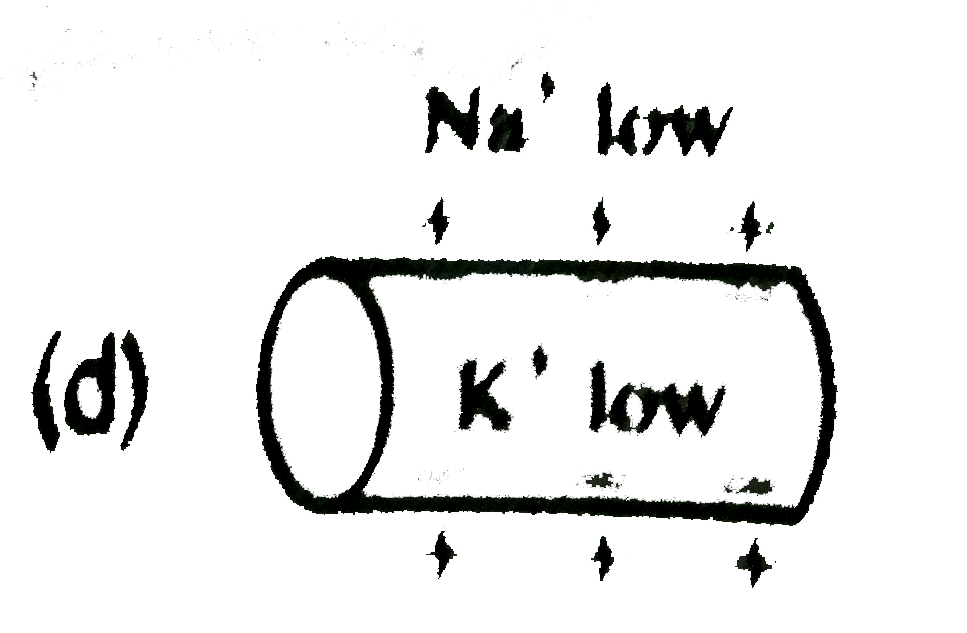
Which diagram shows the correct blood circulation
 ADiagram 1BDiagram 2CDiagram 3DDiagram 4
Which of the following show restricted distribution?
AElephantsBPouched mammalsCAlligatorsDLung fishes
Draw a diagram to show the structure of a neuron with myelinated axon and label any six parts in it .
View SolutionWhich pair will show common ion effect ?
View SolutionWhich pair will show common ion effect ?
View SolutionWhich of the following has non-myelinated nerve fibre
View SolutionWhich of the graph shows that the particle is at rest .
View Solution

