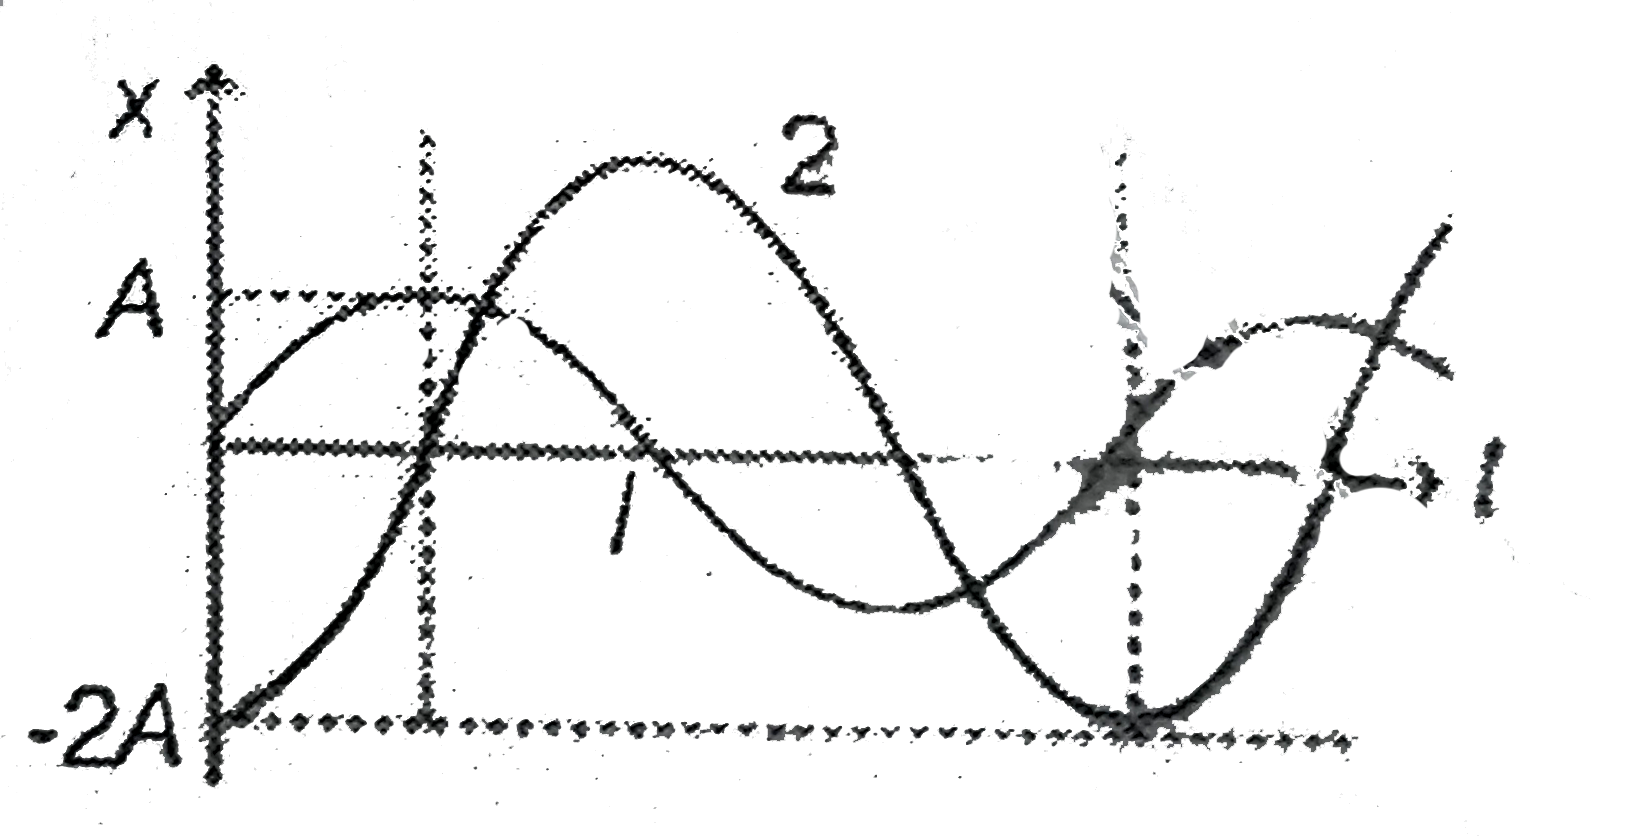
The osciallations represented by curve 1 in the graph are expressed by equation x=Asinεt. The equation for the oscillations represented by curve 2 is expressed as
A
x=2Asin(ωt−π/2)
B
x=2Asing(ωt+π/2)
C
x=−2Asin(ωt−π/2)
D
none of these
Video Solution
Text Solution
The correct Answer is:A
|
Answer
Step by step video, text & image solution for The osciallations represented by curve 1 in the graph are expressed by equation x=A sinepsilont. The equation for the oscillations represented by curve 2 is expressed as by Physics experts to help you in doubts & scoring excellent marks in Class 11 exams.
Updated on:21/07/2023Similar Questions
Knowledge Check
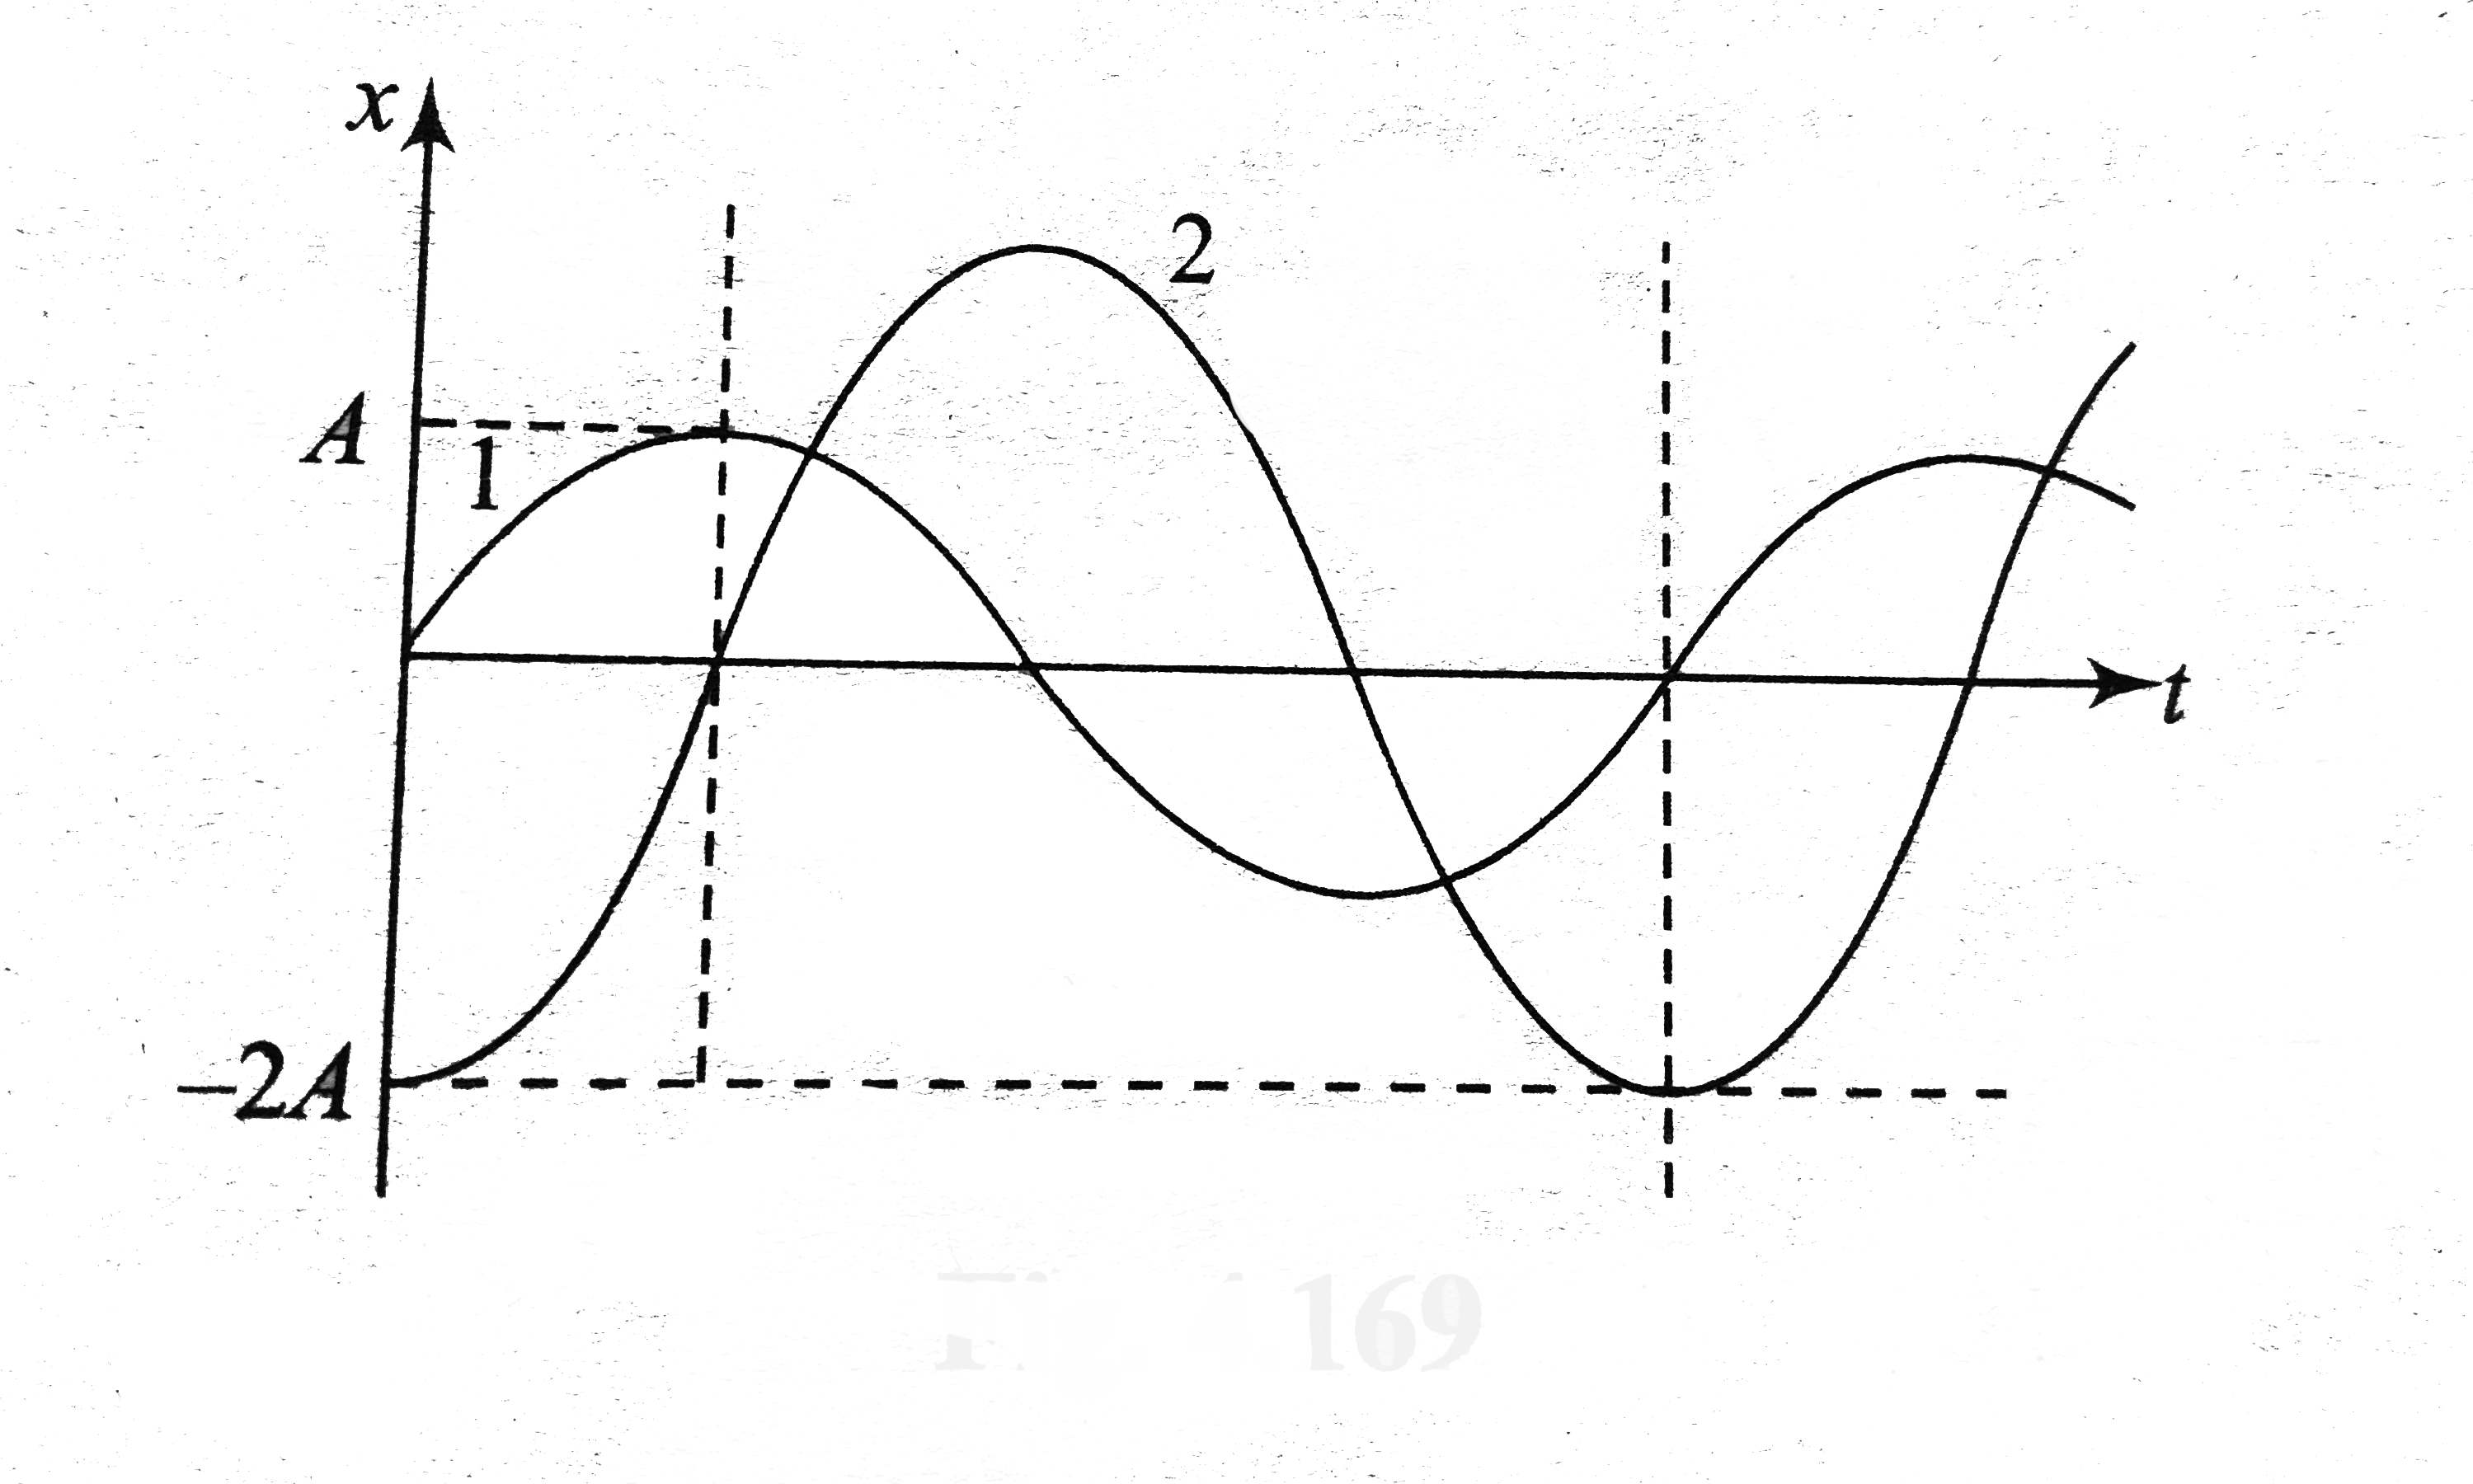
The oscillations represented by curve 1 in the graph are expressed by equationx=Asinωt. The equation for the oscillation represented by curve 2 is expressed asAx=2Asin(ωt−π2)Bx=2Asin(ωt+π2)Cx=−2Asin(ωt−π2)Dx=Asin(ωt−π2)The differential equation of the family of curves represented by c(y+c)2=x3 is
Ayd2ydx2−y2(dydx)2=27xB12y(dydx)2=8x(dydx)3−27xC8y(dydx)3=12x(dydx)2−27xD(dydx)3−(dydx)2+(dydx)−y=27xThe curve represented by the equations x=sin2θ,y=2cosθ is
AellipseBparabolaChyperbolaDnone
The following curves represents the equations of

View SolutionIn the given curve total area under the graph represents:
View Solution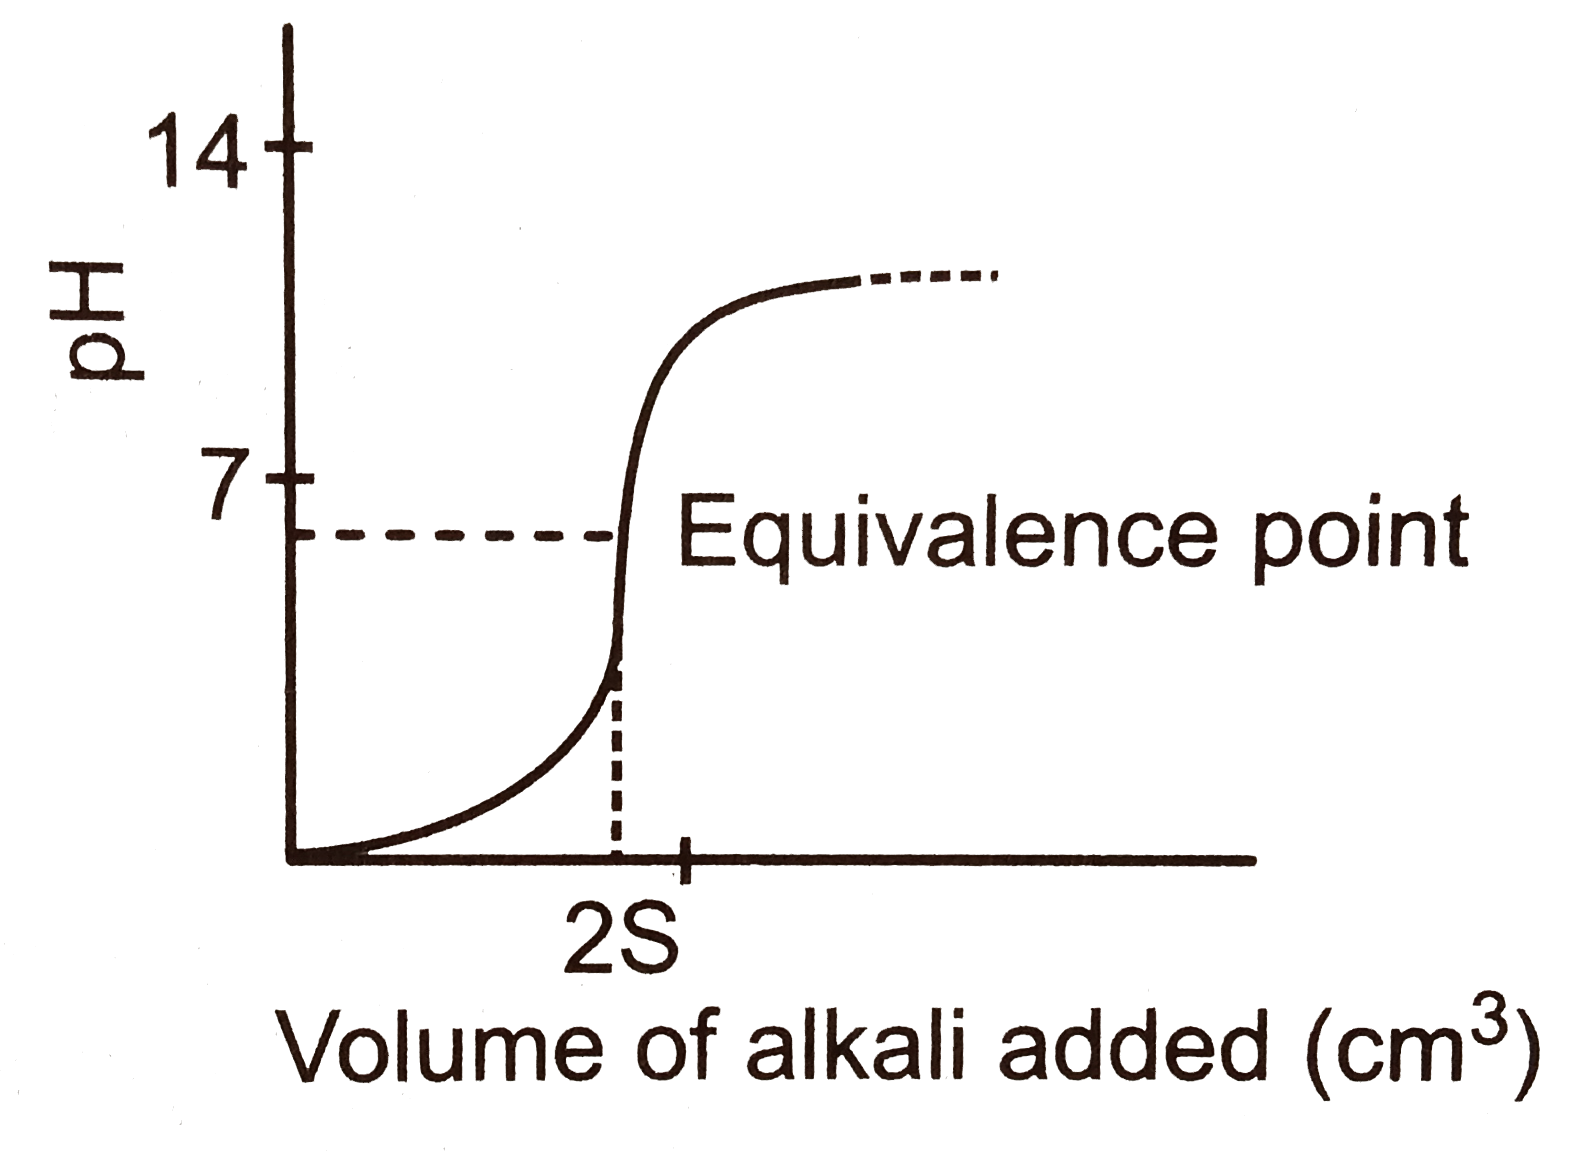
The graph represents the titration curve for :
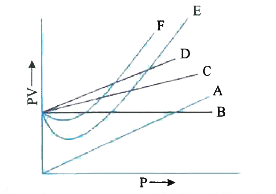
View SolutionWhich curve in the following graph represents the curve of ideal gas ?
View SolutionA graph of linear equation always represents a :
View Solution

