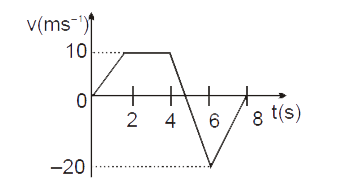
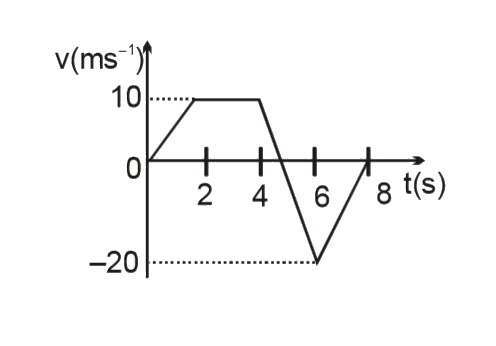
The figure shows a velocity-time graph of a particle moving along a straight line
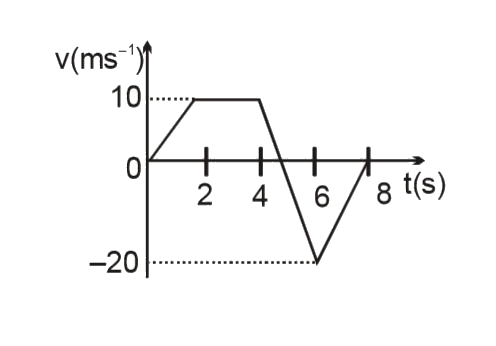
Q. The correct displacement-time graph of the particle
is shown as
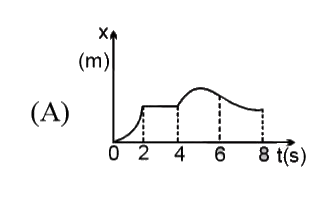
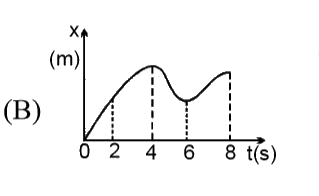
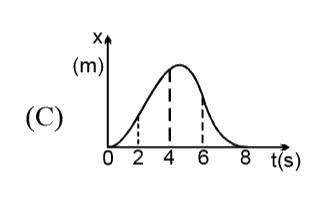
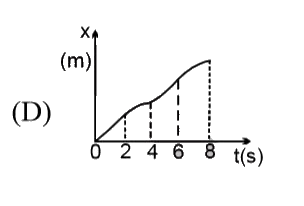
The correct Answer is:C
Step by step video, text & image solution for The figure shows a velocity-time graph of a particle moving along a straight line Q. The correct displacement-time graph of the particle is shown as by Physics experts to help you in doubts & scoring excellent marks in Class 12 exams.
Updated on:21/07/2023Similar Questions
Knowledge Check
The figure shows velocity-time graph of a particle moving along a straight line. Identify the correct statement.
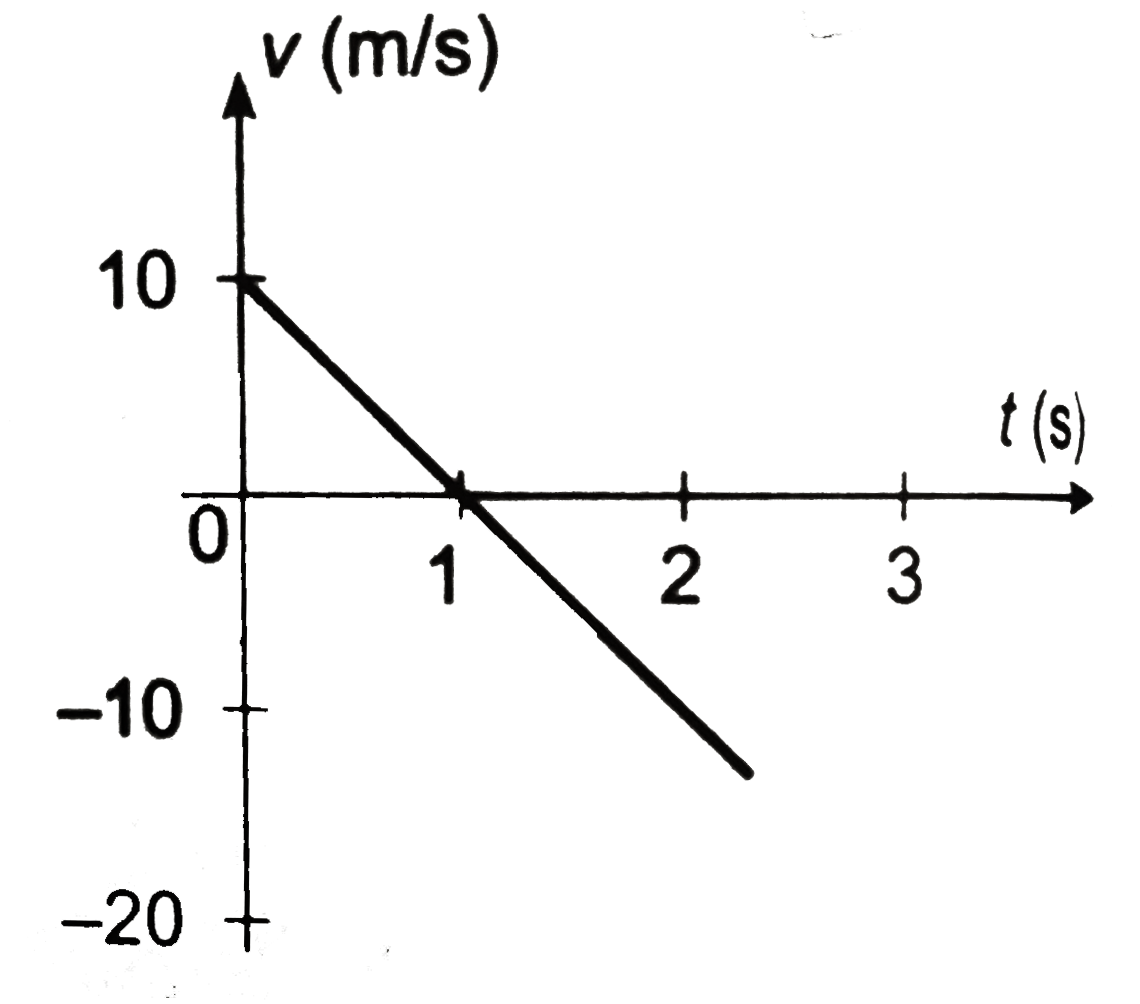 AThe particle starts from the originBThe particle crosses it initial position at t=2sCThe average speed of the particle in the time interval, 0≤t≤2s is zeroDAll of the above
The figure shows a velocity-time graph of a particle moving along a straight line
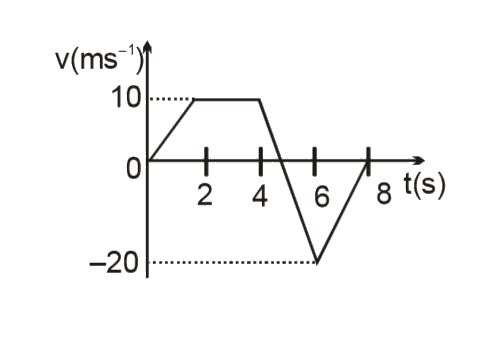
Q. The maximum of displacement of the particle isA33.3 mB23.3 mC18.3DzeroThe figure shows a velocity-time graph of a particle moving along a straight line
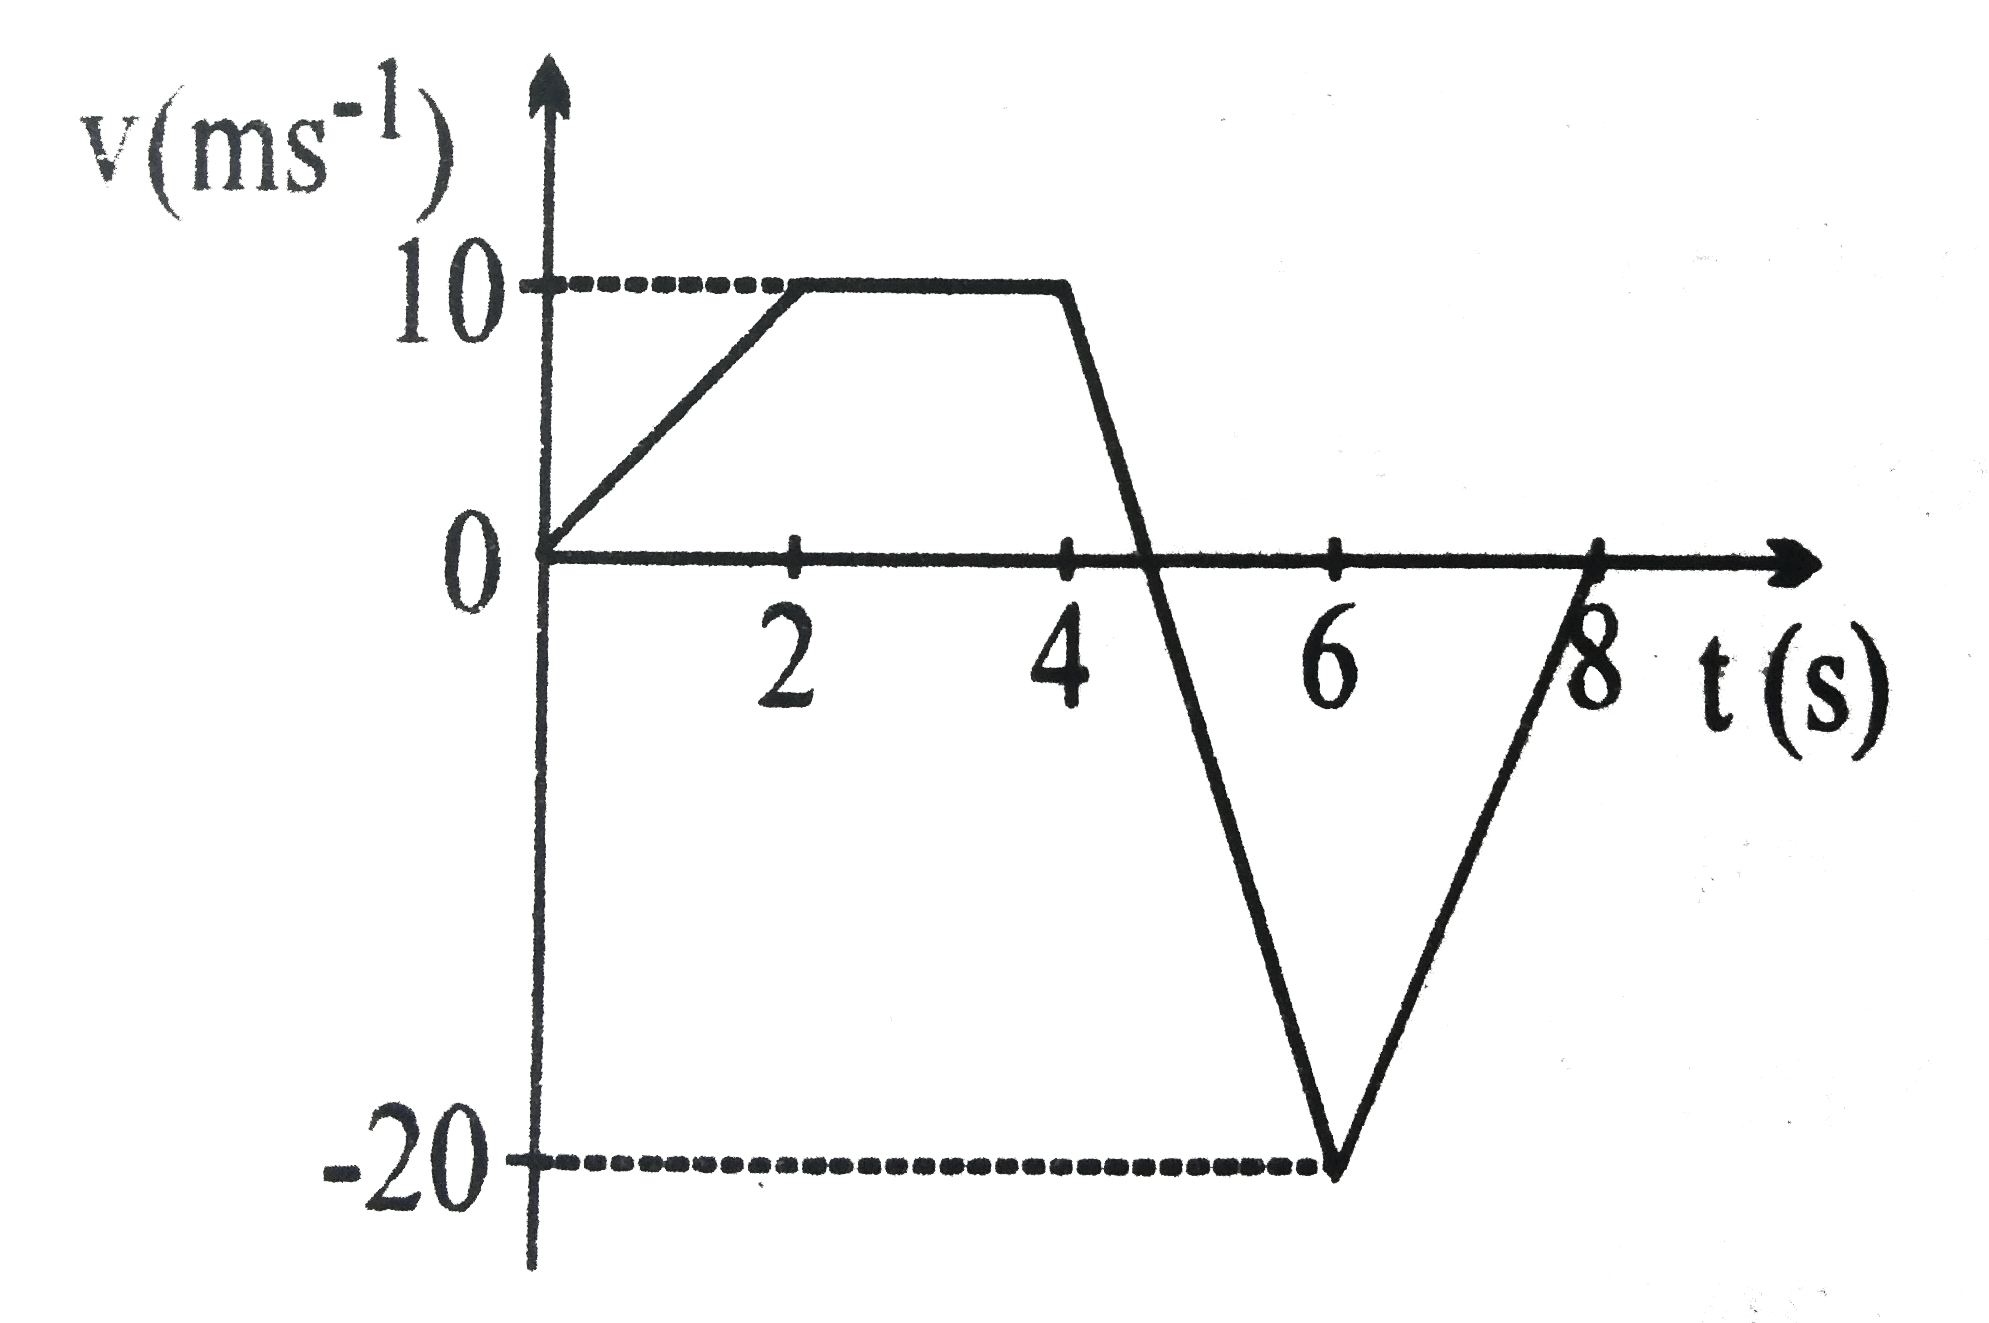
The maximum displacement of the particle isA33.3mB23.3mC18.3mDzero
The figure shows a velocity-time graph of a particle moving along a straight line
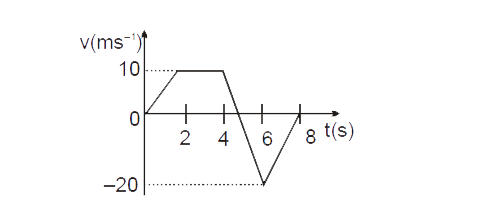
Choose the incorrect statement. The particle comes to rest at
View SolutionThe figure shows a velocity-time graph of a particle moving along a straight line
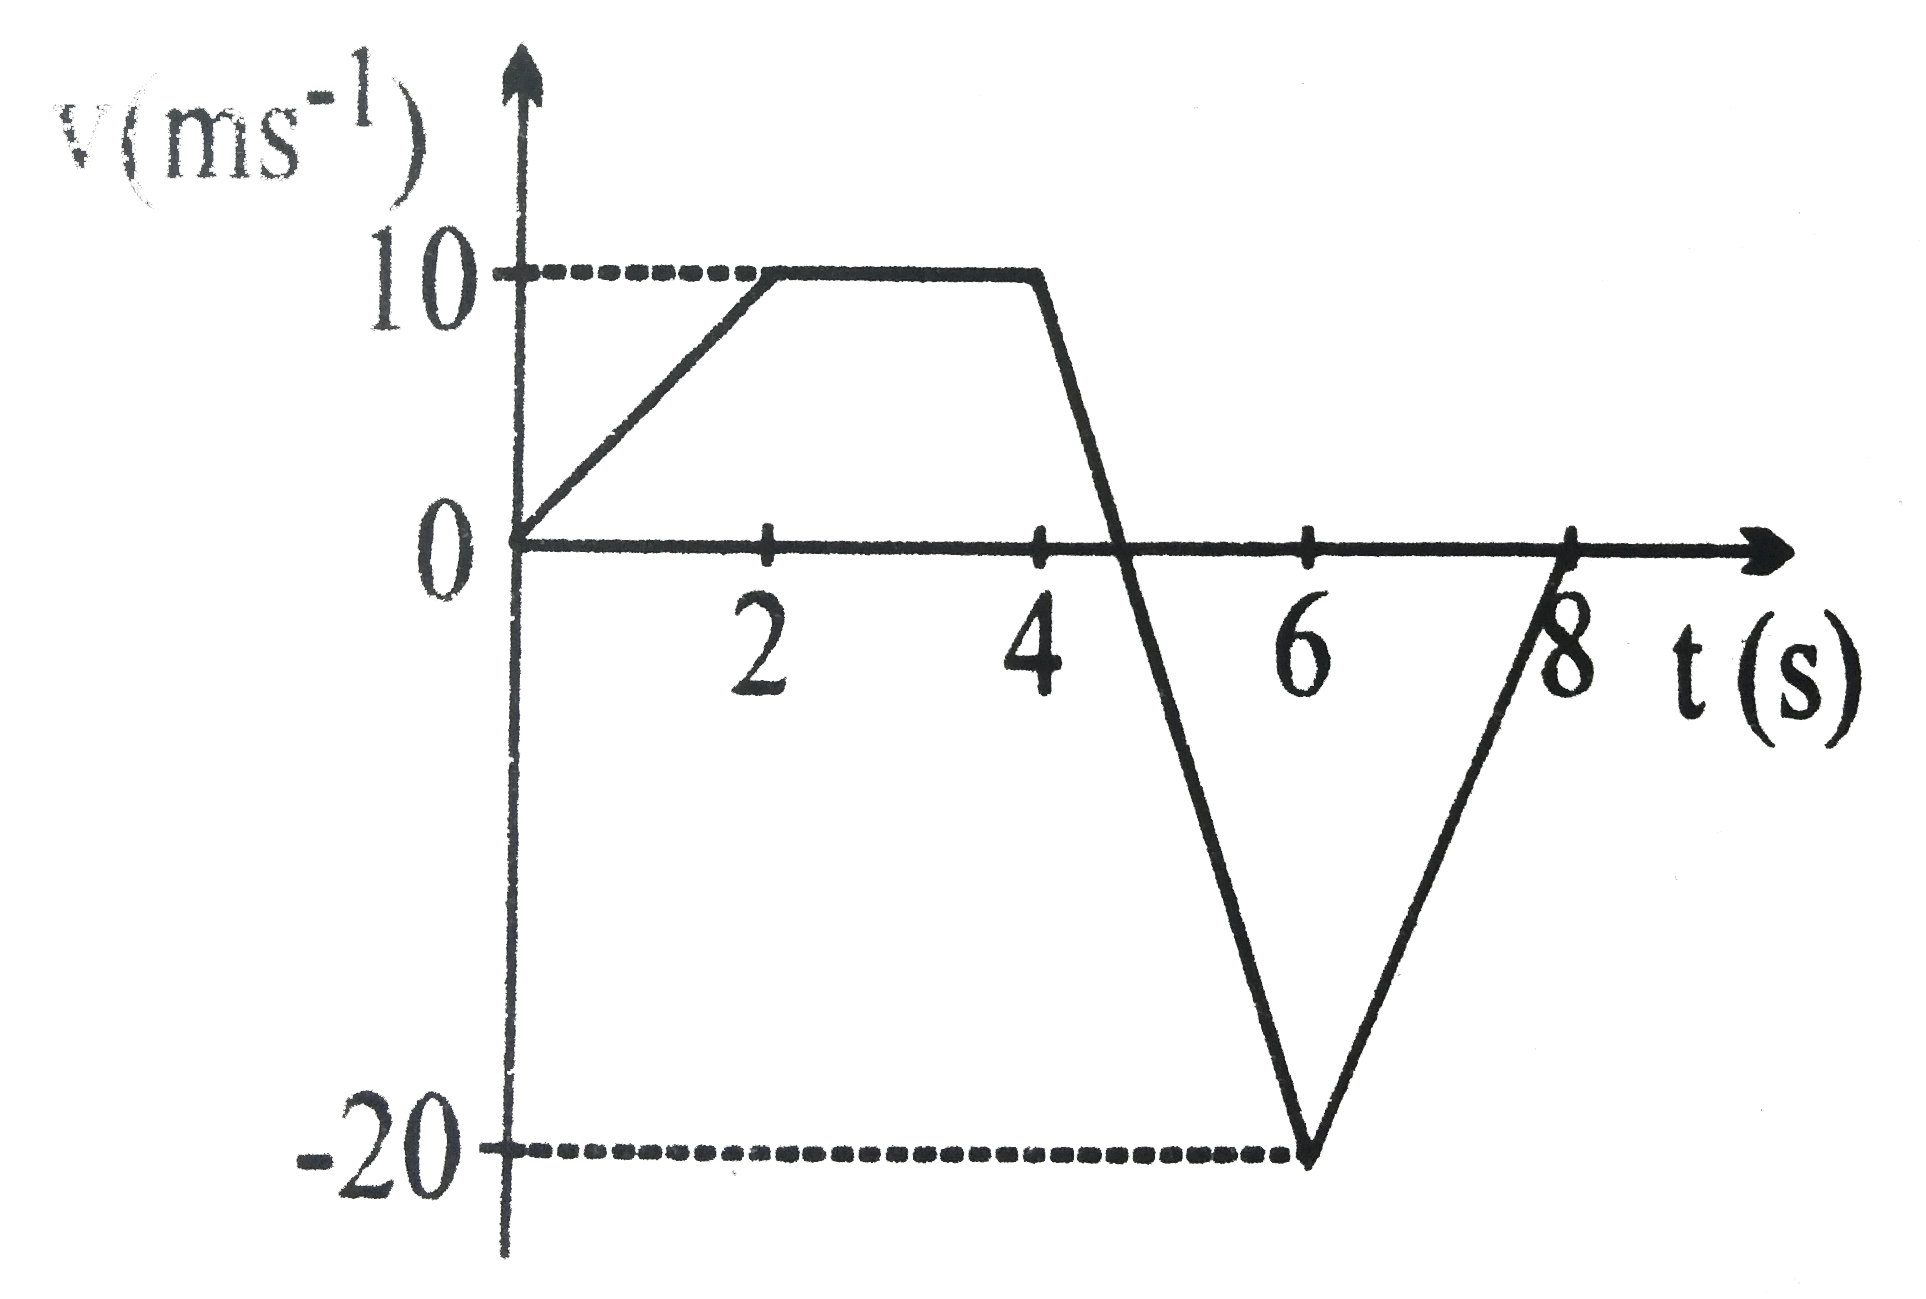
Choose the incorrect statement. The particle comes to rest at
View SolutionThe figure shows a velocity-time graph of a particle moving along a straight line
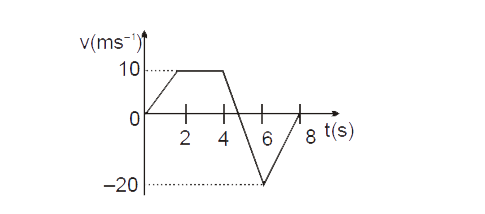
The total distance travelled by the particle is
View SolutionThe velocity-time graph of a particle moving along a straight line is given as below. The displacement time curve for the particle is given by :

View SolutionThe figure shows a velocity-time graph of a particle moving along a straight line
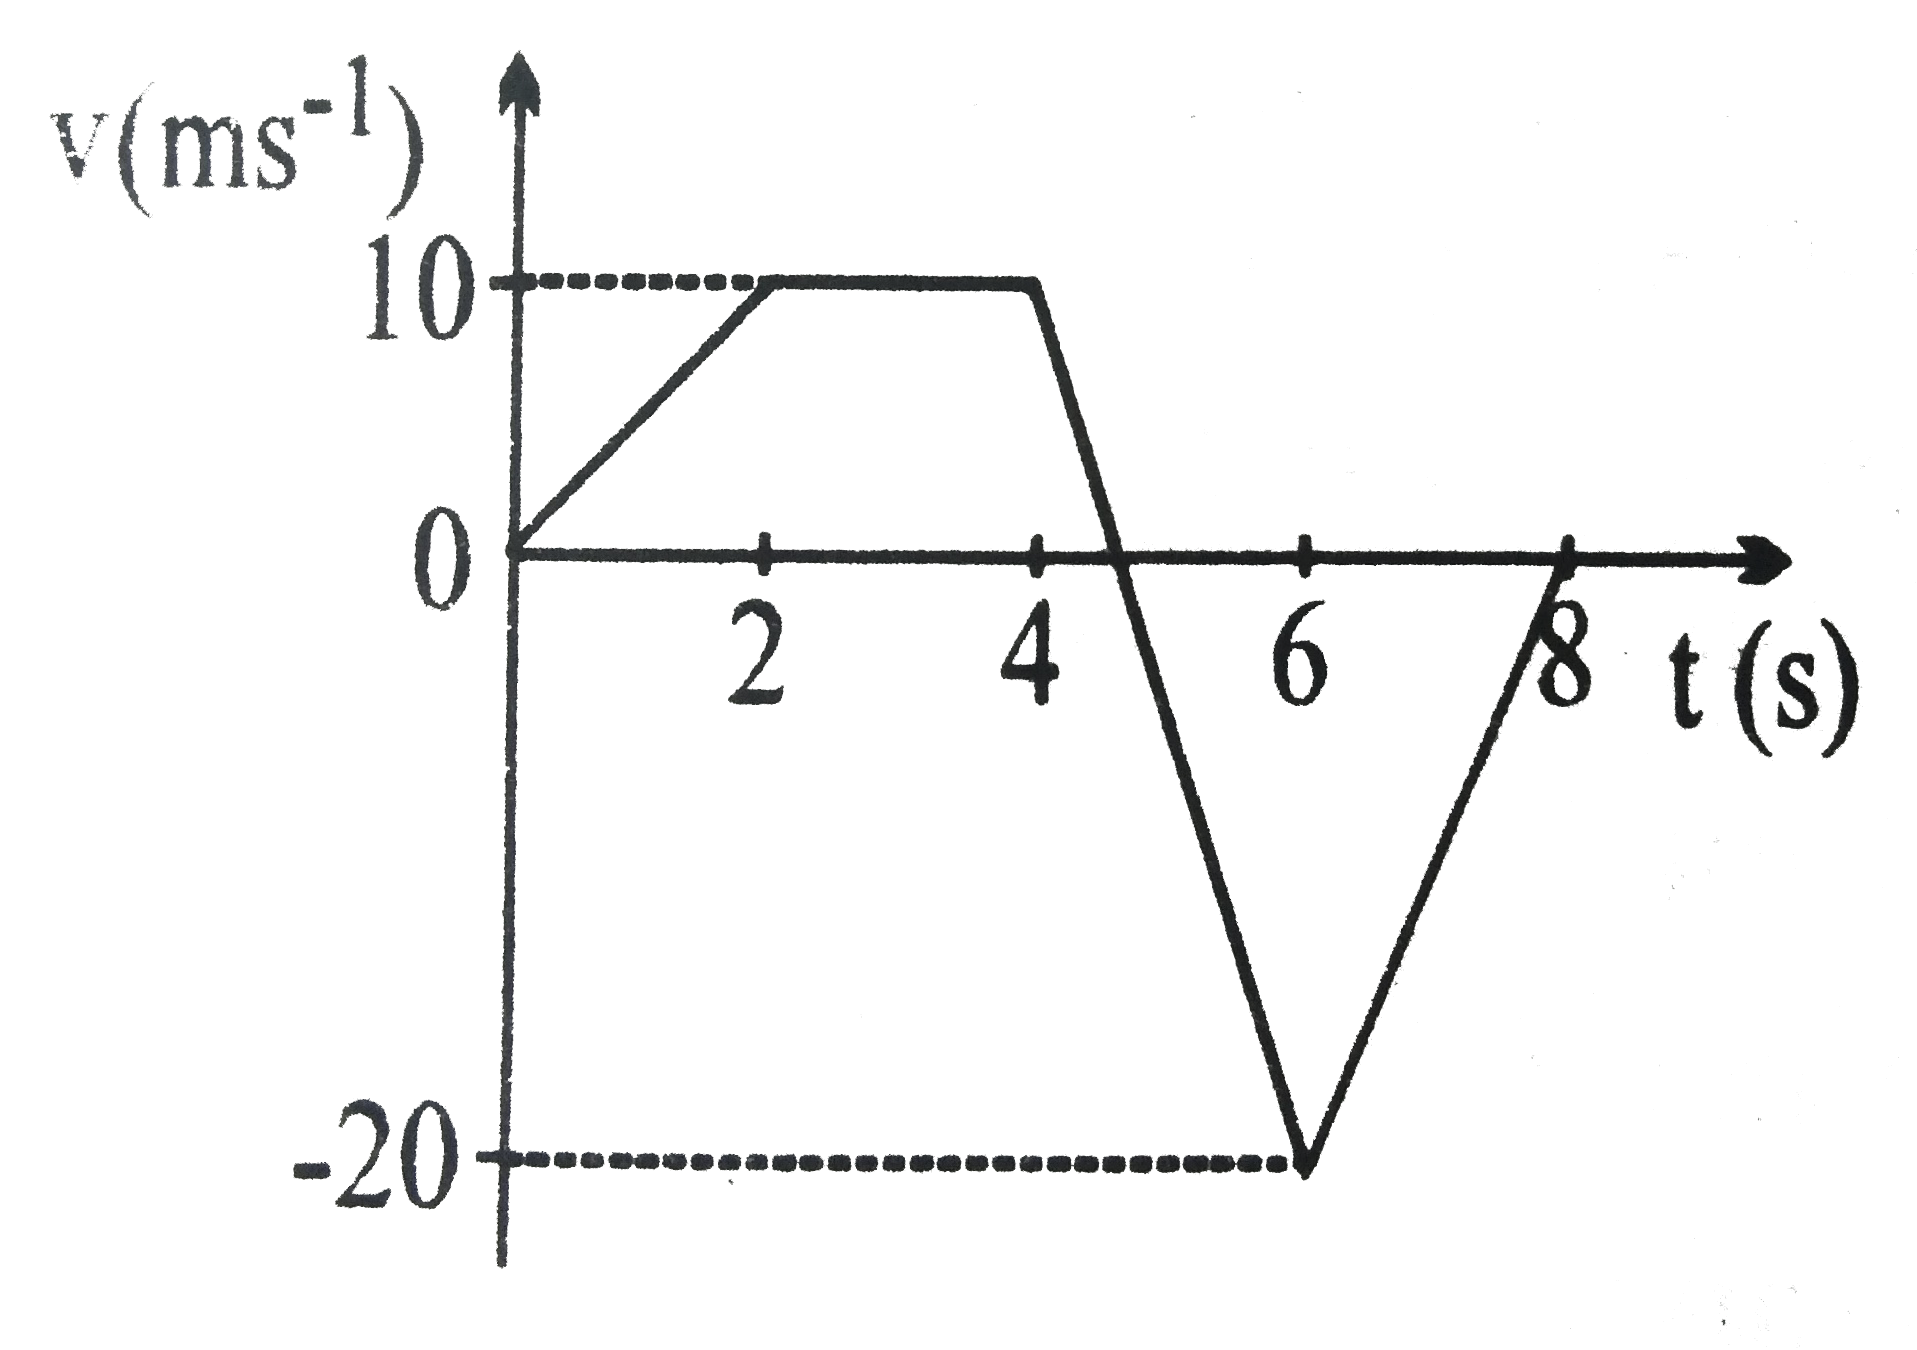
The total distance4 travelled by the particel is
View Solution

