What is PV diagram ? Solution in Tamil
Video Solution
Text Solution
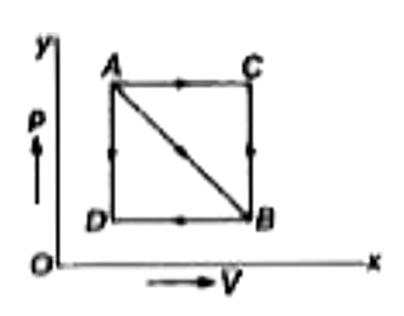
PV diagram is a graph between pressure P and volume V of the system . The P-V diagram is used to calculate the amount of work done by the gas during expansion or on the gas during compression.
|
Similar Questions
Draw the PV diagram for Adiabatic process
View Solutionचक्रिय प्रक्रम ABCA आरेख P-T में दर्शाया गया है। यदि इसे P-V आरेख पर प्रदर्शित किया जाये तो यह होगा

View Solutionकिसी समतापीय प्रक्रम के लिये P-V संसूचक आरेख में ढाल क्या होगी :
View Solutionएक आदर्श गैस को अवस्था A रो B में दिये गये तीन प्रक्रमों द्वारा लाया जाता है (p-V चित्र में), तब निम्न में क्या सत्य है?

View SolutionWhat do you mean by a cyclic process ? How it is represented in a pV diagram ?
View SolutionWhat is ‘isobaric change’ ? Draw the PV diagram.
View SolutionDraw the diagram when PV is potted against P?

View SolutionWhat is the use of the indicator diagram or PV diagram?
View Solution
