The graph between volume and temperature in Charles'law is Solution in Tamil
an ellipse
a circle
a striangle line
a parabola
The correct Answer is:C
a straight line
Similar Questions
The graph between volume and temperature in Charles'law is
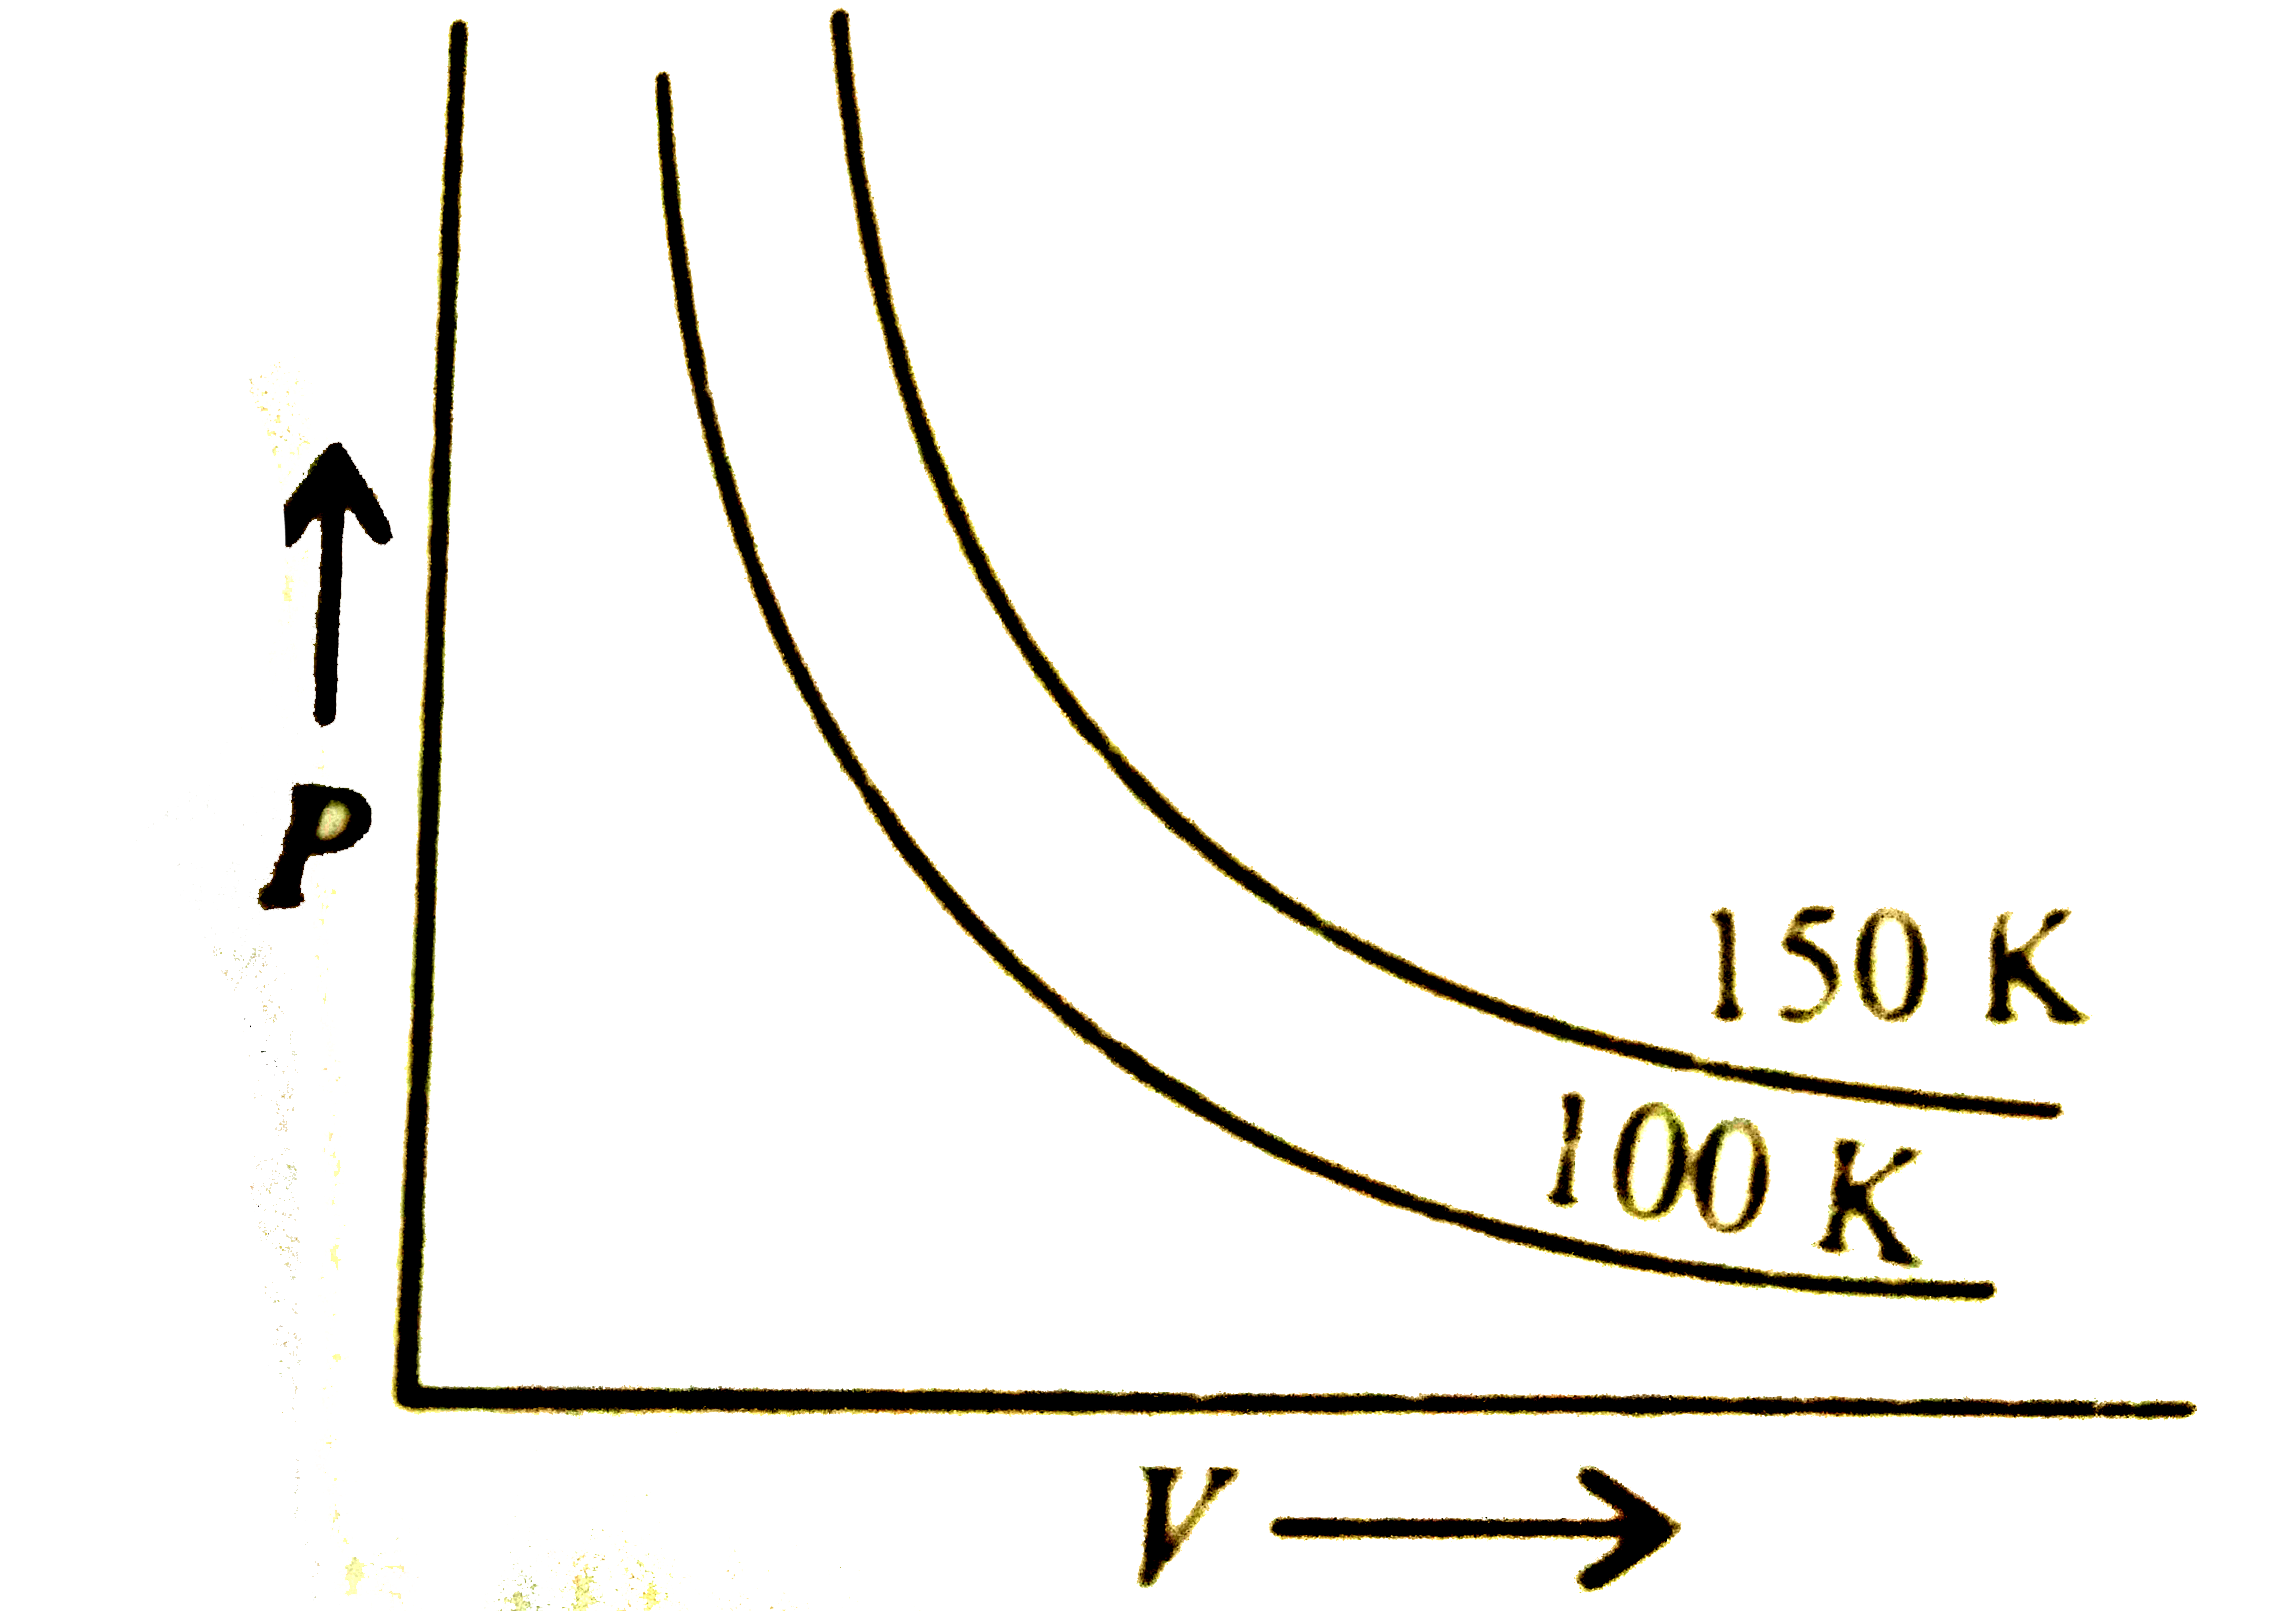
View SolutionA graph is drawn between pressure and volume at different temperatures. Based on the graph, what will be the change in volume if- (i) Pressure is increased at the same temperature. (ii) The temperature is reduced at the same pressure.
View SolutionConversion of Pressure Volume Temperature Graphs
View SolutionState the nature of the graph drawn between volume and temperature at constant pressure. When the graph is extrapolated, at what temperature it meet the temperature axis ?
View SolutionState the nature of the graph drawn between pressure and temperature at constant volume. When the graph is extrapolated, at what temperature it meet the temperature axis ?
View SolutionA graph is plotted between pressure and volume at different temperatures . On the basis of the graph what changes will you observe in the volume if
(i) the pressure is increased at constant temperature .
(ii) the temperature is decreased at constant pressure .

View SolutionWhat is the shape of graph between volume and temperature, if pressure is kept constant?
View SolutionConversion of Pressure Volume Temperature Graphs
View Solution
