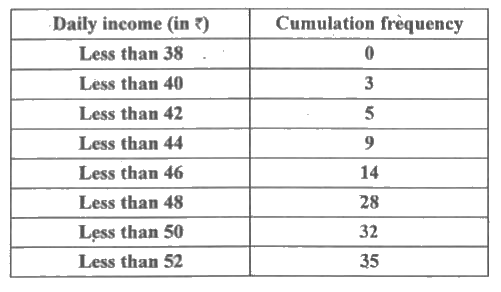
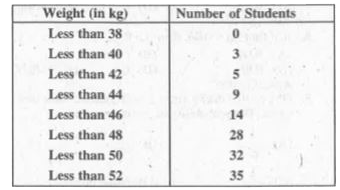
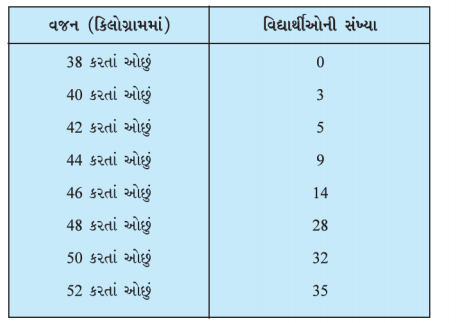
During the medical check-up of 35 students of a class, their weights were recorded as follows:

Draw a less than type ogive for the given data. Hence obtain the median weight from the graph and varify the result by using the formula. Solution in Kannada
The correct Answer is:46.5
Step by step video & image solution for During the medical check-up of 35 students of a class, their weights were recorded as follows: Draw a less than type ogive for the given data. Hence obtain the median weight from the graph and varify the result by using the formula. by Maths experts to help you in doubts & scoring excellent marks in Class 10 exams.
Updated on:21/07/2023Similar Questions
The inequation that best describes the following graph is _________
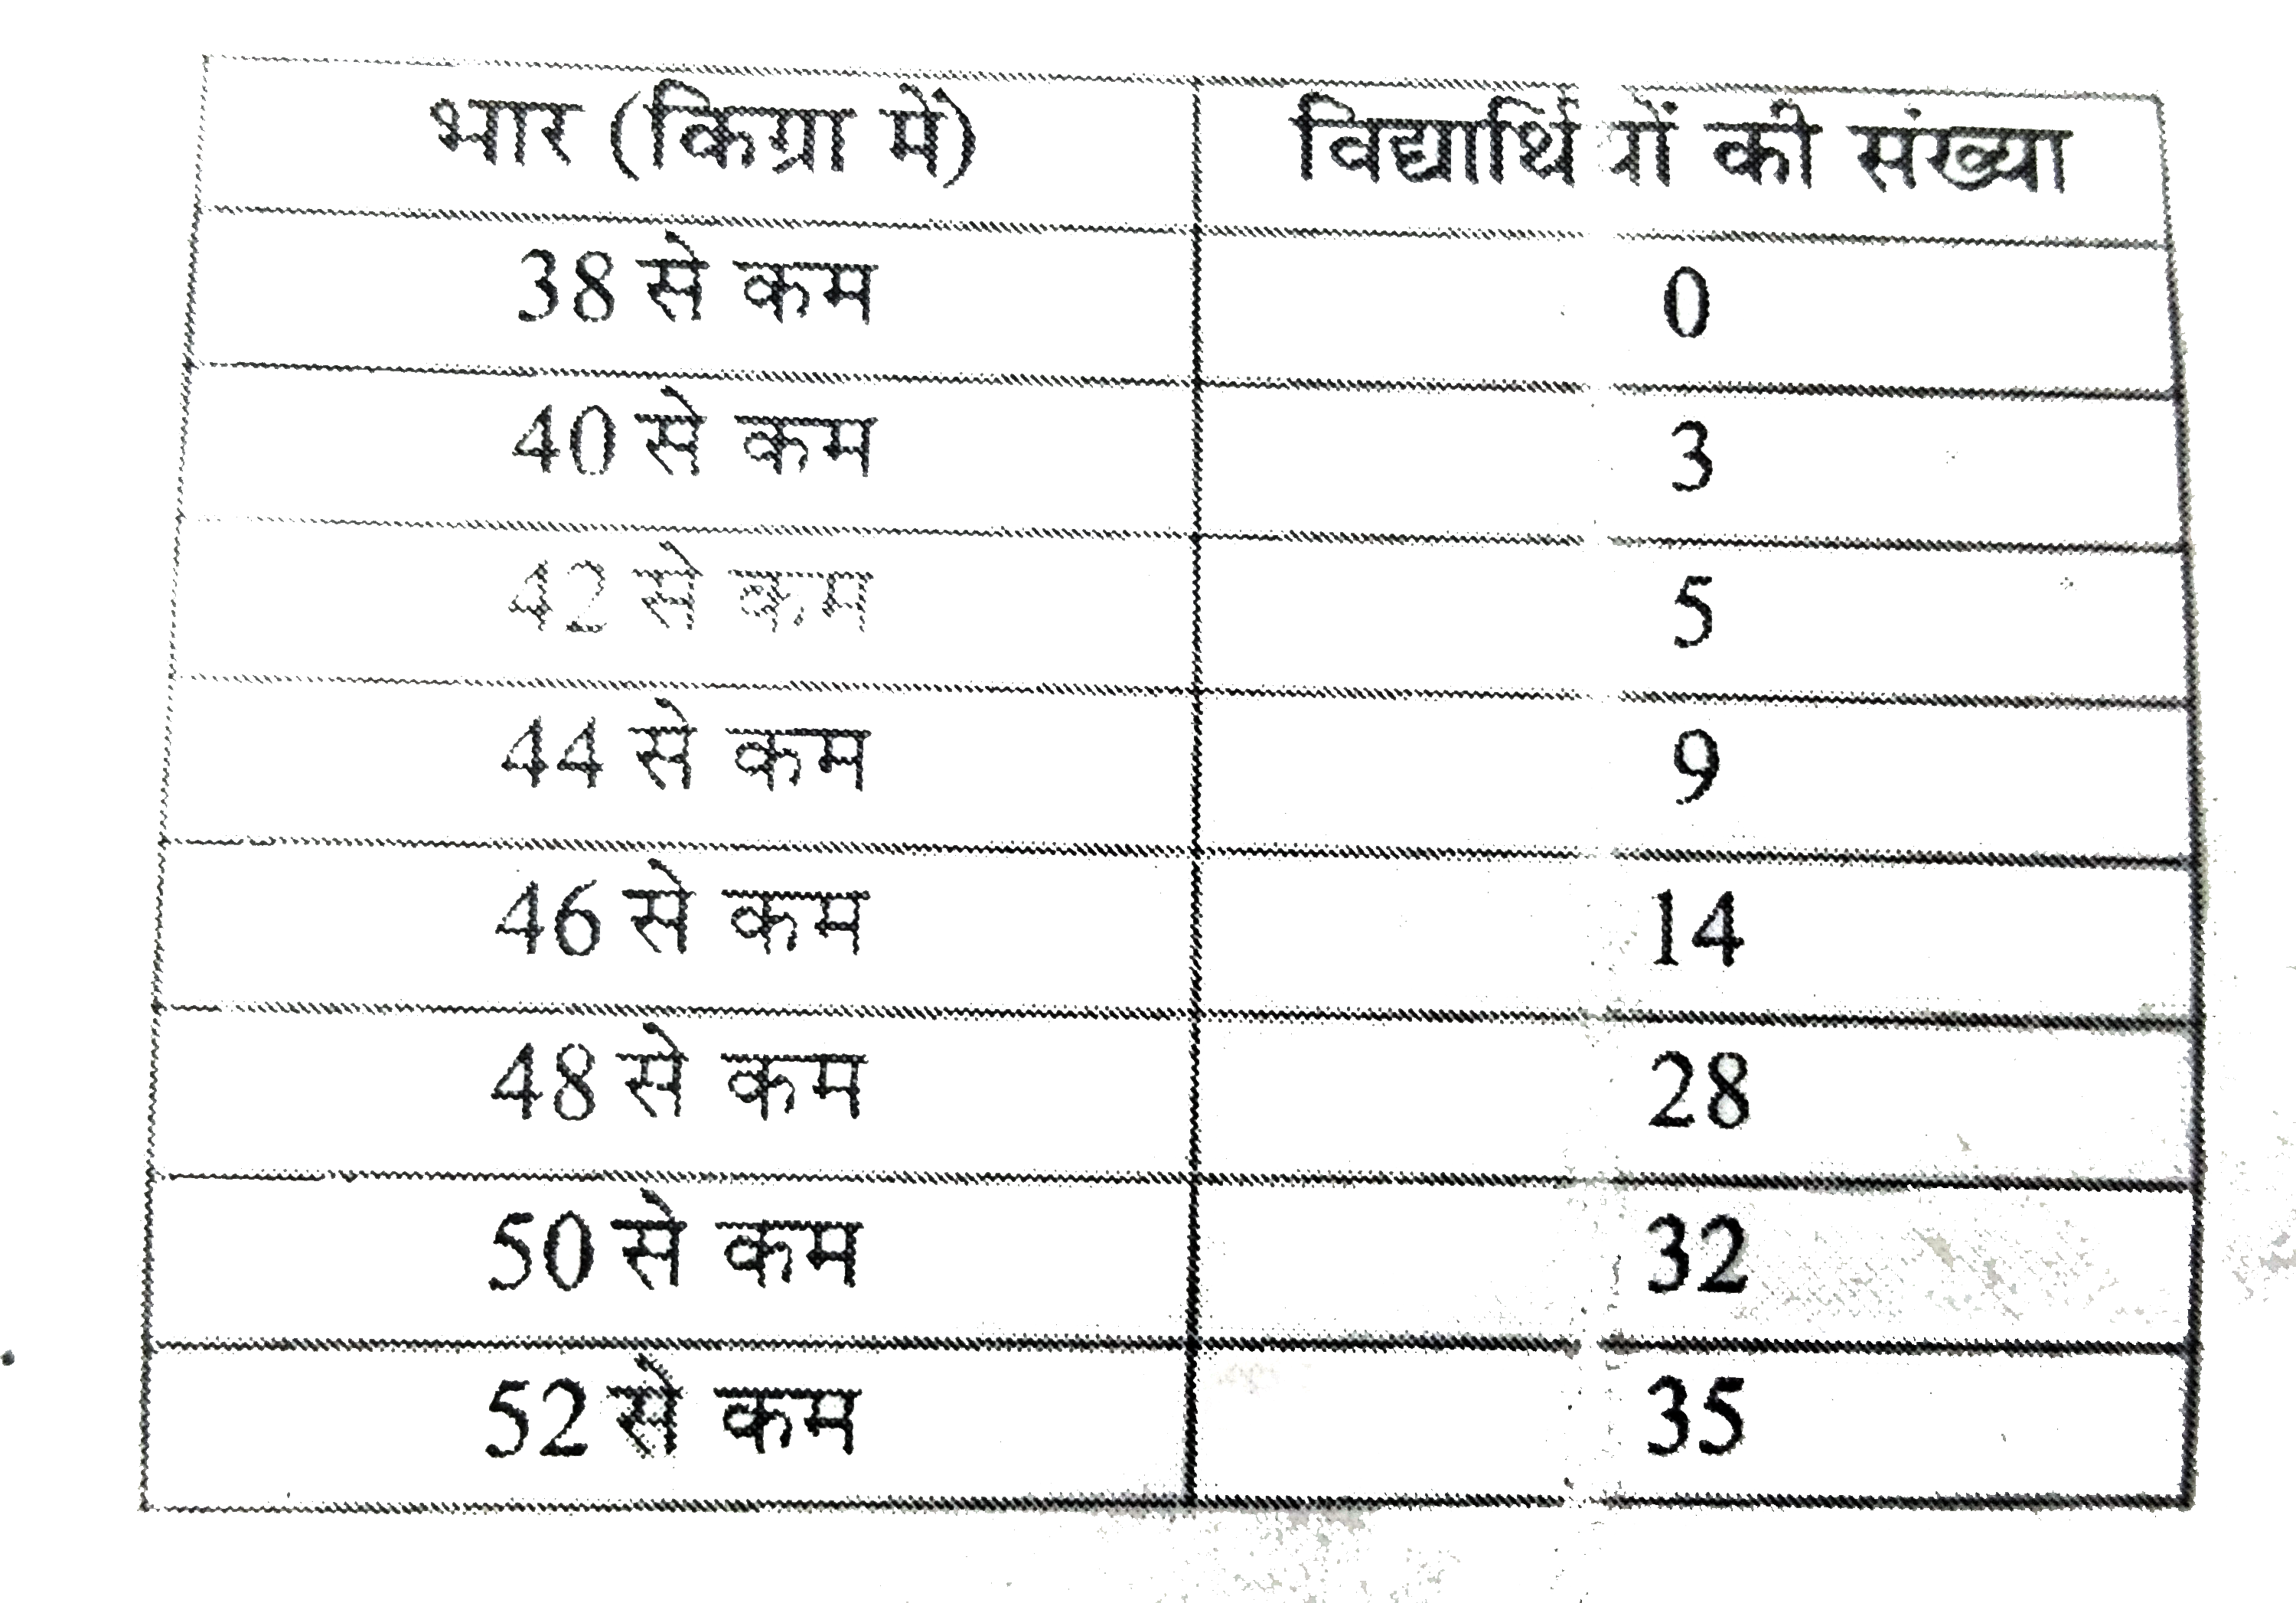
View Solutionकिसी कक्षा के 35 विद्यार्थियों की मेडिकल जाँच के समय उनके भार निम्नलिखित रूप में रिकॉर्ड किए गए :

उपरोक्त आँकड़ों के लिए 'कम प्रकार का तोरण ' खींचिए। इसके बाद माध्यक भार ज्ञात कीजिए।
View SolutionDuring the medical check -up of 35 students of a class , their weights were recorded as follows :
Weight (in kg)Number of studentsLess than 380Less than 403Less than 425Less than 449Less than 4614Less than 4828Less than 5032Less than 5235
Draw a less than type ogiven for the given data . Hence obtain the median weight from the graph and verify the result by using the formula .
View SolutionDuring the medical check up of 35 students of a class, their weights were recorded as follows :
Draw a less then type ogive for the given data. Hence obtain the median weight from the graph and verify the result by using the formula.

View SolutionFind the mode of the given data 4,5,5,4,7,2,3,4,2,4,5
View SolutionDuring the medical check-up of 35 students of a class, their weights were recorded as follows :

Draw a less than type ogive for the given data. Hence, obtain the median weight from the graph and verify the result by using the formula.
View SolutionDuring the medical check-up of 35 students of a class, their weights were recorded as follows: Draw a less than type ogive for the given data. Hence obtain the median weight from the graph and verify the result by using the formula. weight (in kg)=38-40 40-42 42-44 44-46 46-48 48-50 50-52 No. of students=3 2 4 5 14 4 3
View Solution