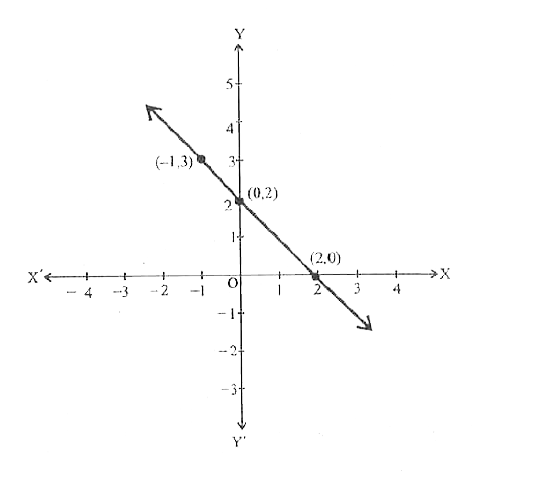
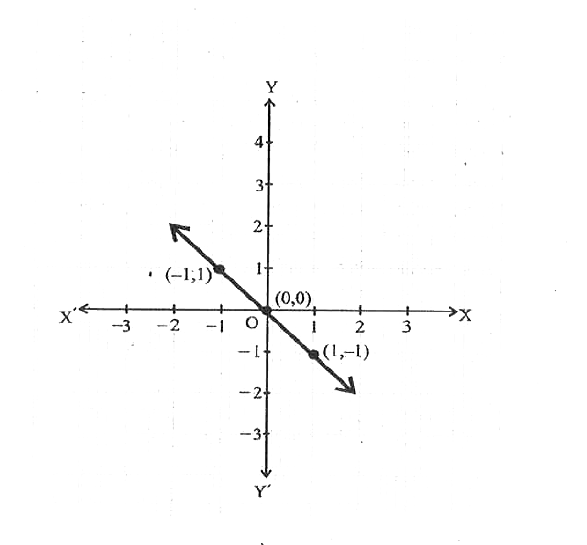
From the choices given below, choose the equation whose graphs are in fig (i) and fig (ii), in fig (ii)
 Solution in Kannada
y=x+2
y=x−2
y=−x+2
x+2y=6
The correct Answer is:C
Step by step video, text & image solution for From the choices given below, choose the equation whose graphs are in fig (i) and fig (ii), in fig (ii) by Maths experts to help you in doubts & scoring excellent marks in Class 9 exams.
Updated on:21/07/2023Similar Questions
The inequation that best describes the following graph is _________
View SolutionIn fig. O is the center of the circle. Find the value of x.
ltimg src="https://d10lpgp6xz60nq.cloudfront.net/physics_images/PS_MATH_IX_C12_S01_031_Q01.png" width="80%"gt
View SolutionIn Fig, find the value of x.
ltimg src="https://d10lpgp6xz60nq.cloudfront.net/physics_images/PS_MATH_IX_C12_S01_032_Q01.png" width="80%"gt
View SolutionMatch the followings (column I with column II)
ltimg src="https://d10lpgp6xz60nq.cloudfront.net/physics_images/NCERT_BIO_XI_C03_E01_011_Q01.png" width="80%"gt
View SolutionMatch column I with column II
ltimg src="https://d10lpgp6xz60nq.cloudfront.net/physics_images/NCERT_BIO_XI_C16_E01_002_Q01.png" width="80%"gt
View SolutionMatch column I with column II:
ltimg src="https://d10lpgp6xz60nq.cloudfront.net/physics_images/NCERT_BIO_XI_C18_E01_003_Q01.png" width="80%"gt
View SolutionMatch Column I with Column II: ltimg src="https://d10lpgp6xz60nq.cloudfront.net/physics_images/NCERT_BIO_XI_C20_E01_010_Q01.png" width="80%"gt
View SolutionFrom the choices given below, choose the equation whose graphs are in fig (i) and fig (ii), in fig (i)

View Solution