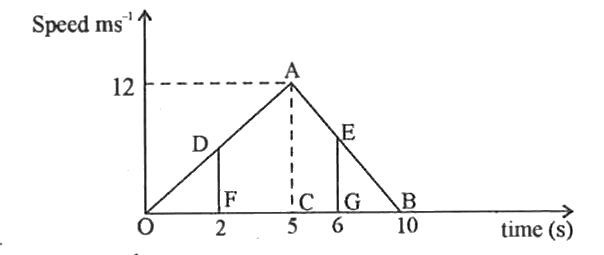
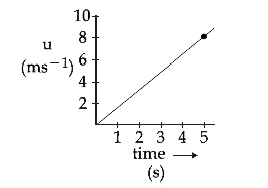
The speed time graph of a particle moving along a fixed direction is as shown in the figure. Obtain the distance travelled by the particle from,
(a) t = 0 to 10s
(b) t= 2s to 6s
(c) What is the average speed of the particle over the intervals in (a) and (b)?
 Solution in Kannada
(a) Distance covered
=12bh=12×10×12=60m
displacement=[12¯¯¯¯¯¯OCׯ¯¯¯¯¯AC]−[1/2¯¯¯BCׯ¯¯AC]
= 0
(b) Distance covered from t=2s to t=6s
=Area ACFD +Area AENC v=⊕at
=12(5−3)(4.8+12)+12(6−5)(12+9.6) ∴a=vt=125
=25.2+10.8 a=2.4ms−1
=36m vD=(2.4)(2)=4.8ms−1
(c) Average speed =total distancetime taken=12×10×1210 vB=12−2.4(1)=9.6ms−1
=6ms−1
Similar Questions
The speed-time graph of a particle moving along a fixed direction is shown in figure. Obtain the distance traversed by the particle between (a)t=0s to 10s(b)t=2s to 6s What is the average speed of the particle over the intervals in a and b?
View SolutionThe speed-time graph of a particle moving along a fixed direction is shown in Fig. Obtain the distance traversed by the particle between (a) t = 0 s to 10 s, (b) t = 2s to 6s.
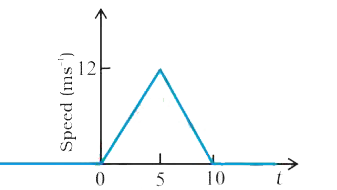
What is the average speed of the particle over the intervals in (a) and (b) ?
View SolutionThe speed-time graph of a particle moving along a fixed direction is shown in Fig. Obtain the distance traversed by the particle between (a) t = 0 s to 10 s, (b) t = 2s to 6s. What is the average speed of the particle over the intervals in (a) and (b) ?
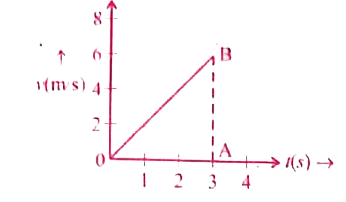
View SolutionFind the distance travelled by the particle during the time t = 0 to t = 3 second from the figure .
View SolutionThe speed-time graph of a particle moving along a fixed direction is shown in the Fig. The distance traversed by the particle between (a) t=0s→10s .
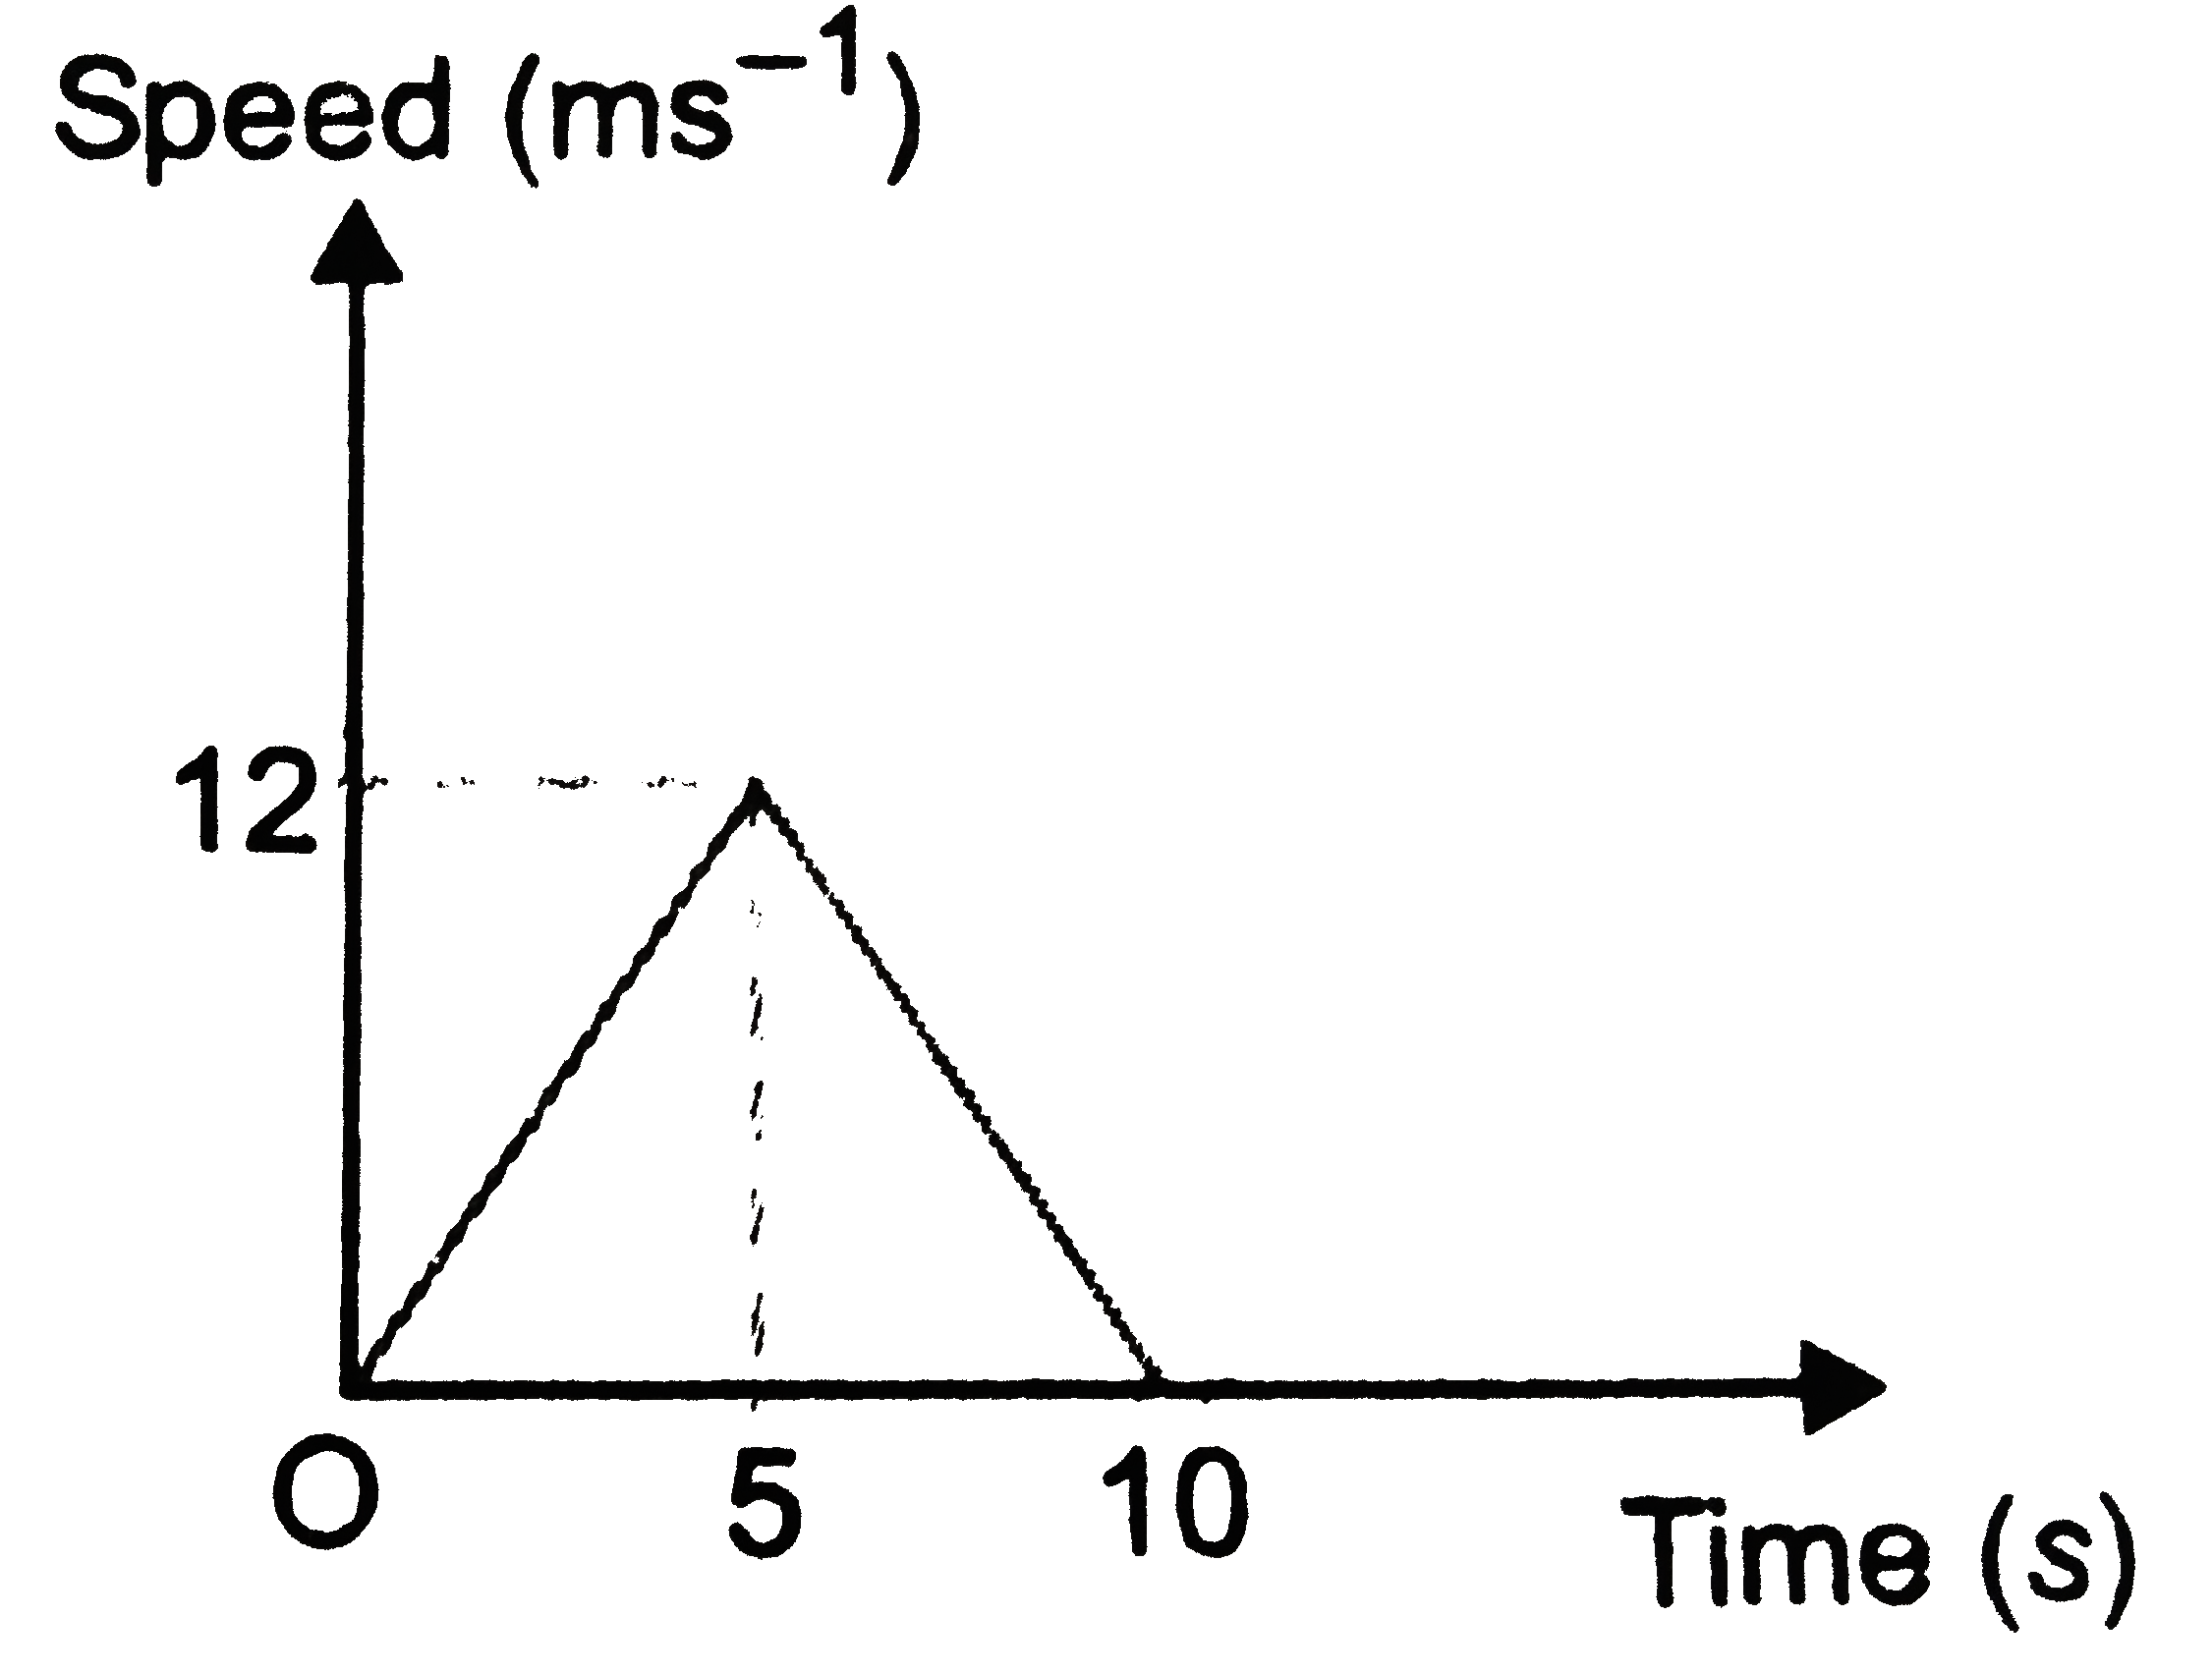 .
what is the average speed of the particle over the intervals?
View SolutionThe speed-time graph of a particle moving along a fixed direction is shown in figure. Obtain the distance traversed by the particle between (a) t =0 s to 10s. (b) t = 2 s to 6s. What is the average speed of the particle over the intervals in (a) and (b) ?
View SolutionThe speed verses time graph for a particle is shown in the figure. The distance travelled (in m) by the particle during the time interval t = 0 to t = 5 s will be __________
View SolutionThe speed-time graph of a particle moving along a fixed direction as shown in the figure. The distance traversed by the particle between t = 0 s to t = 10 s is
View Solution

