The figure showns the force versus time graph for a particle.
Find the change in momentum Δp of the particle
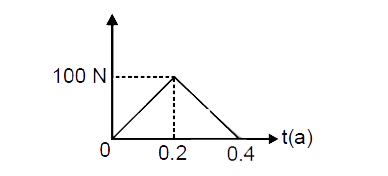
The correct Answer is:20Ns
Step by step video & image solution for The figure showns the force versus time graph for a particle. Find the change in momentum Deltap of the particle by Physics experts to help you in doubts & scoring excellent marks in Class 12 exams.
Updated on:21/07/2023Similar Questions
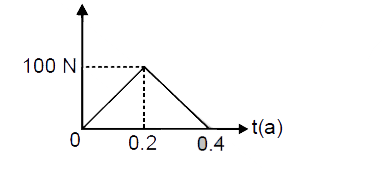
The figure showns the force versus time graph for a particle.
Find the average force acting on the particle
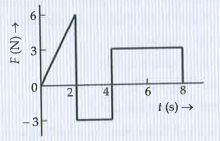
View SolutionThe force F acting on a particle of mass mis indicated by the force-time graph shown below. The change in momentum of the particle over the time interval from zero to 8 s is
View Solution
Knowledge Check
Figure shows the speed versus time graph for a particle. Find the distance travelled by the particle during the time t=0 to t=3s.
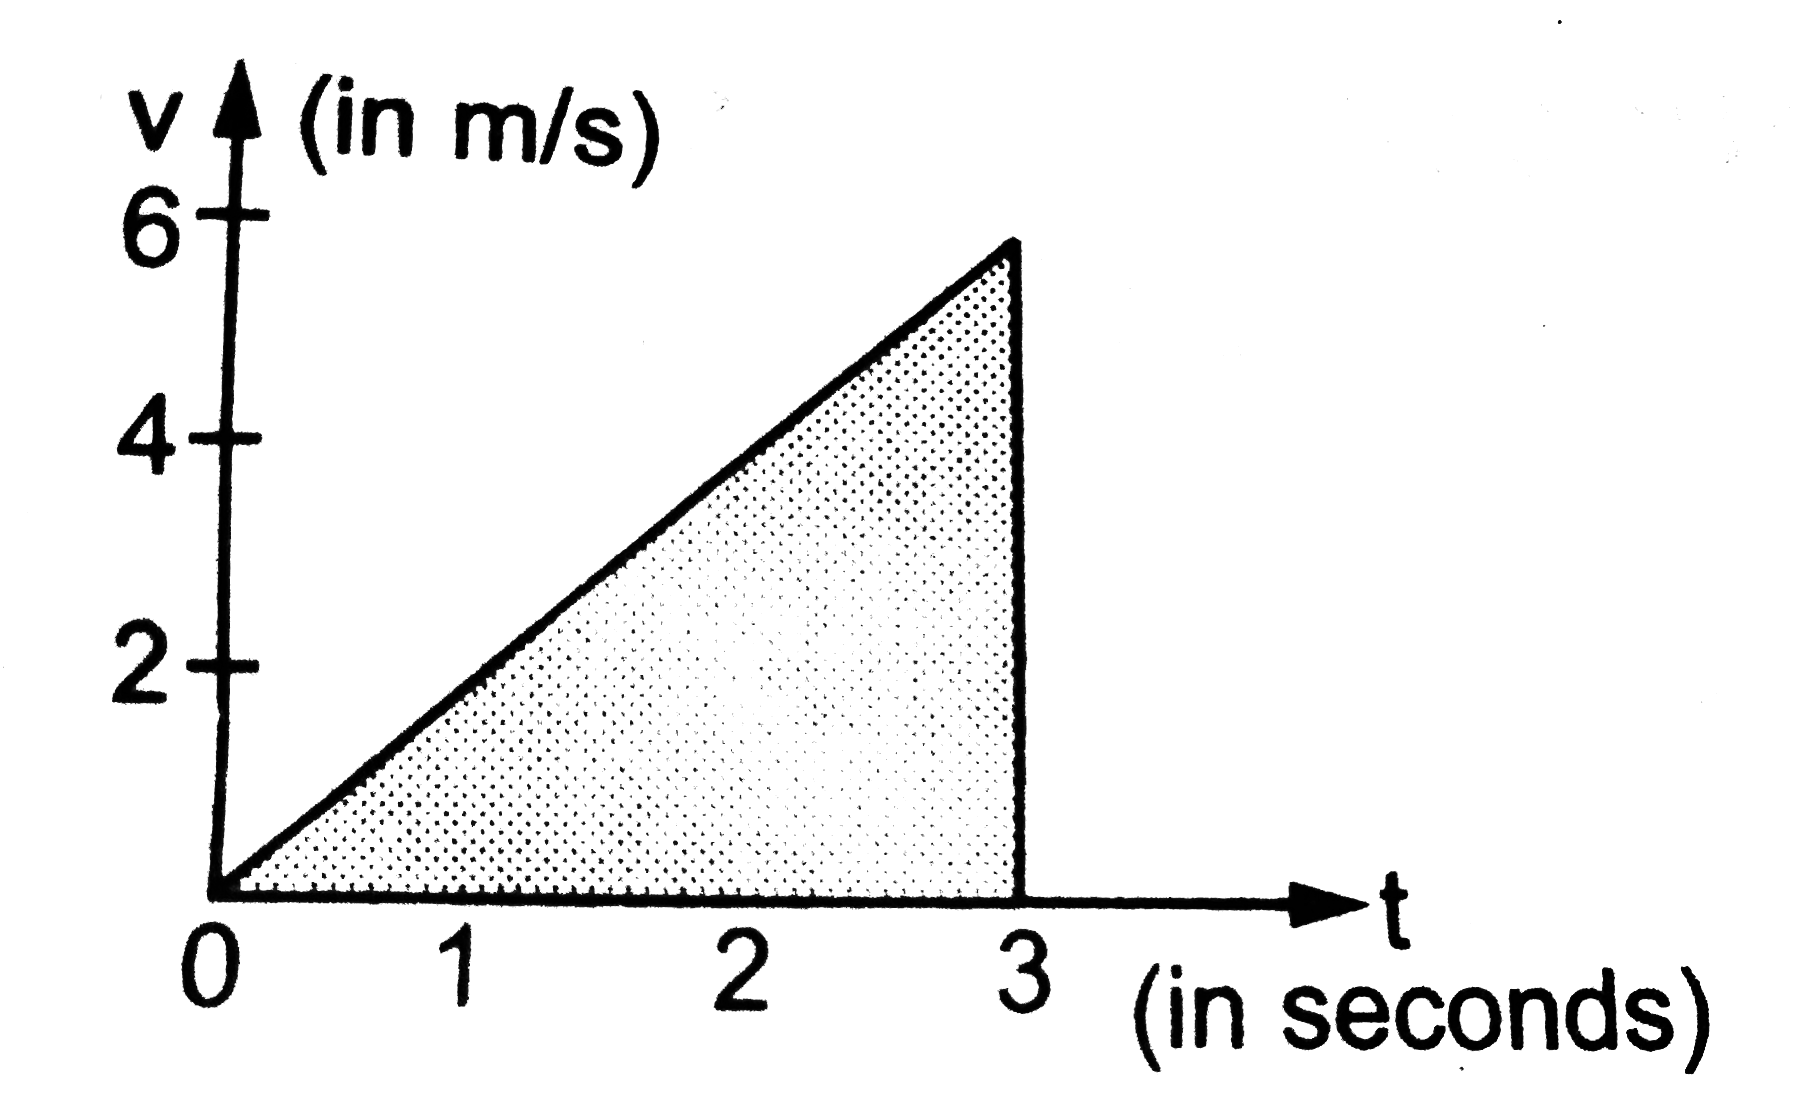 A9mB5mC2mD1m
velocity time graph of a particle is shown in figure. Find displacement of the particle.
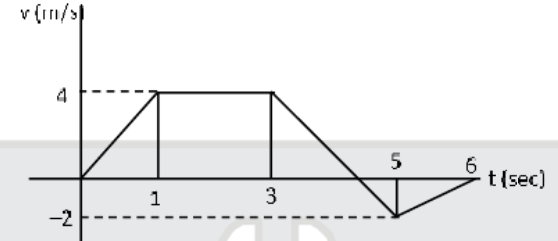 A7B11C5D15
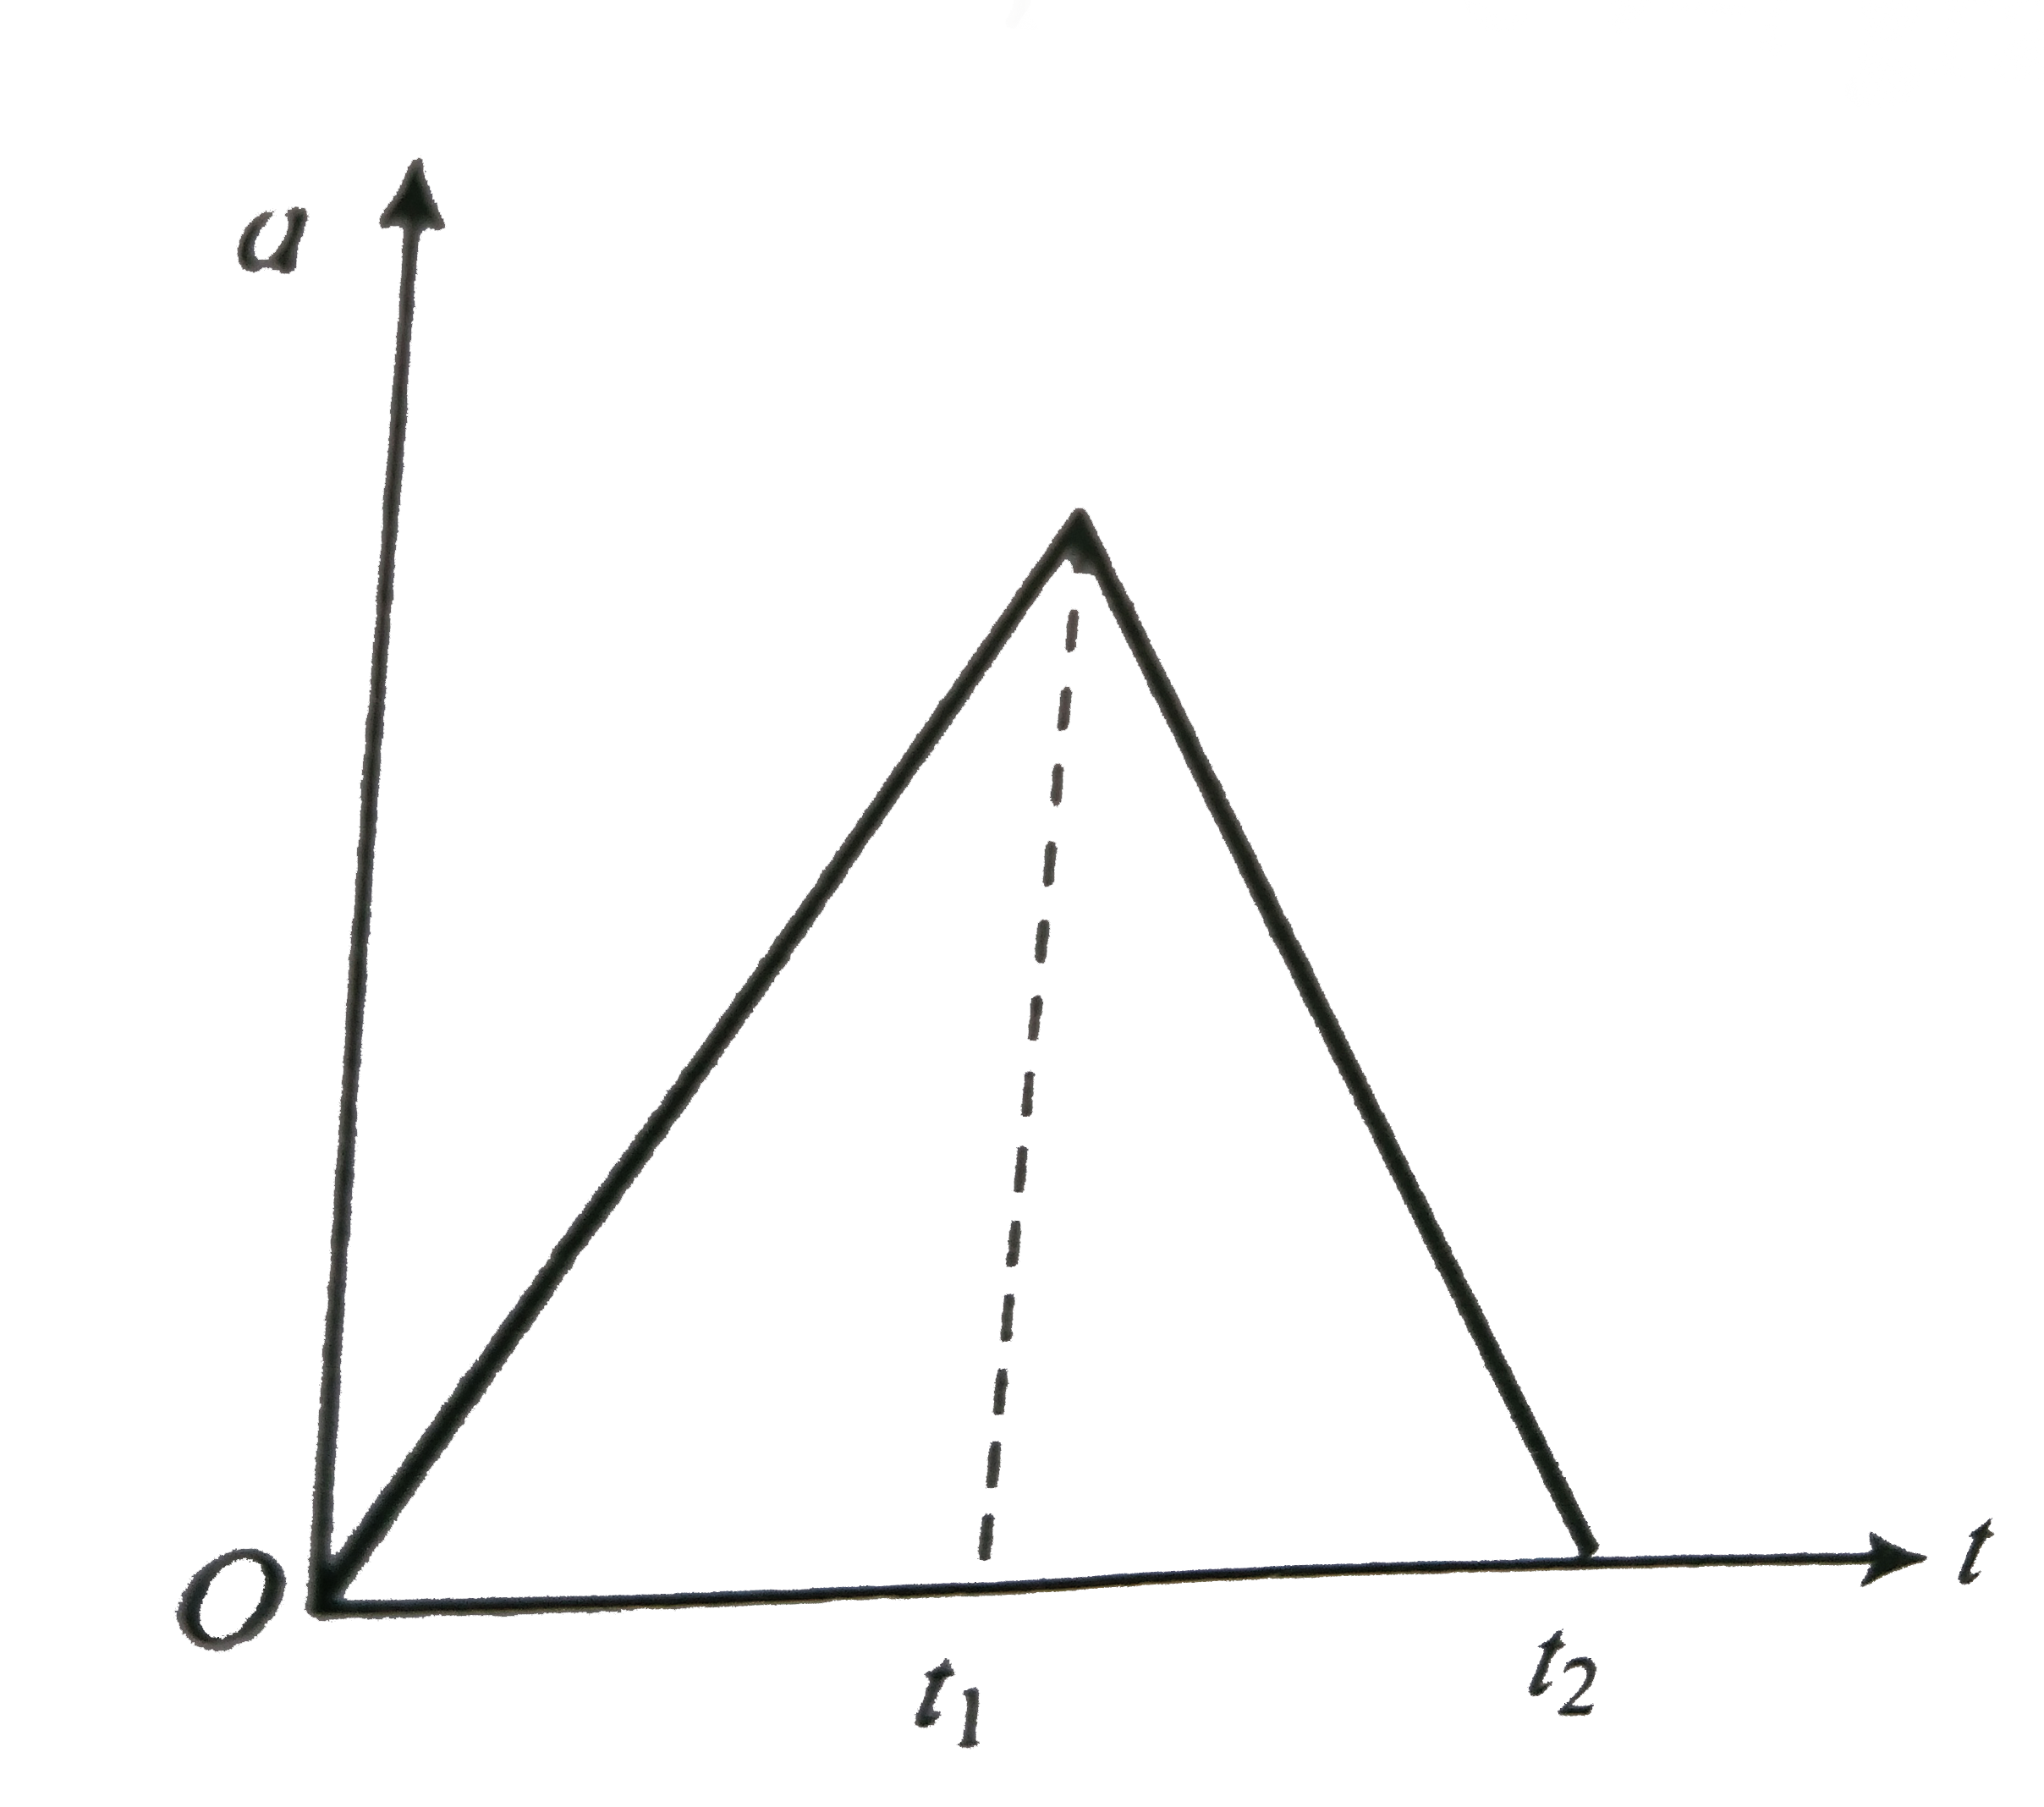
The acceleration versus time graph of a particle is shown in the figure. The respective v−t graph of the particle is .
 .A
.A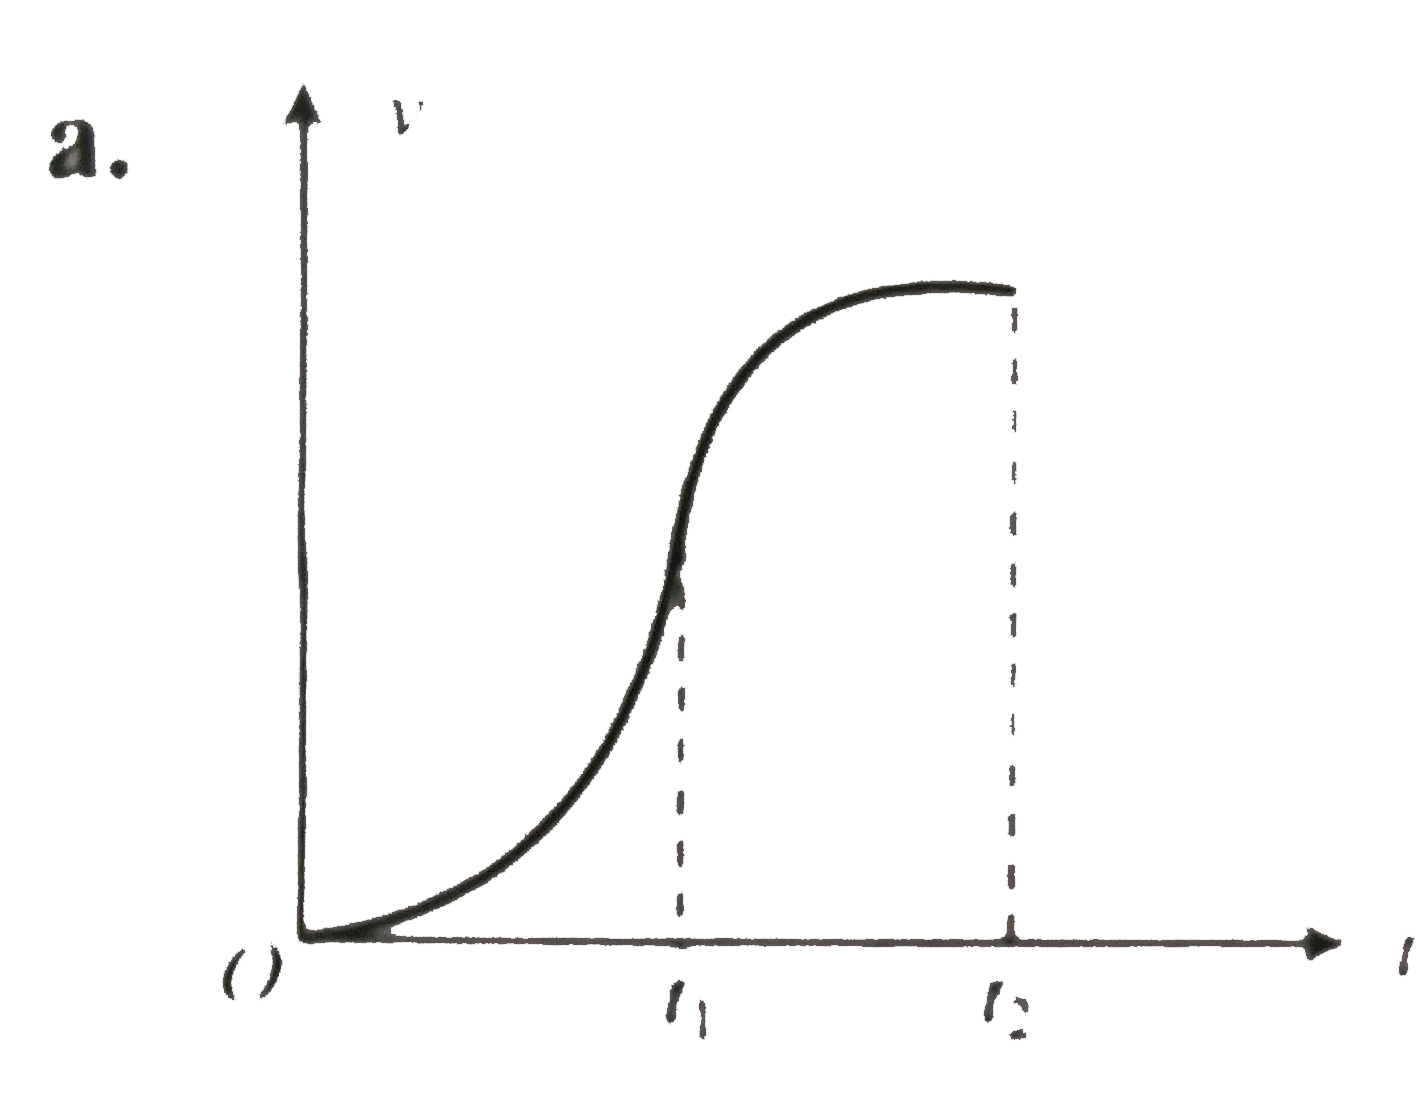 .B
.B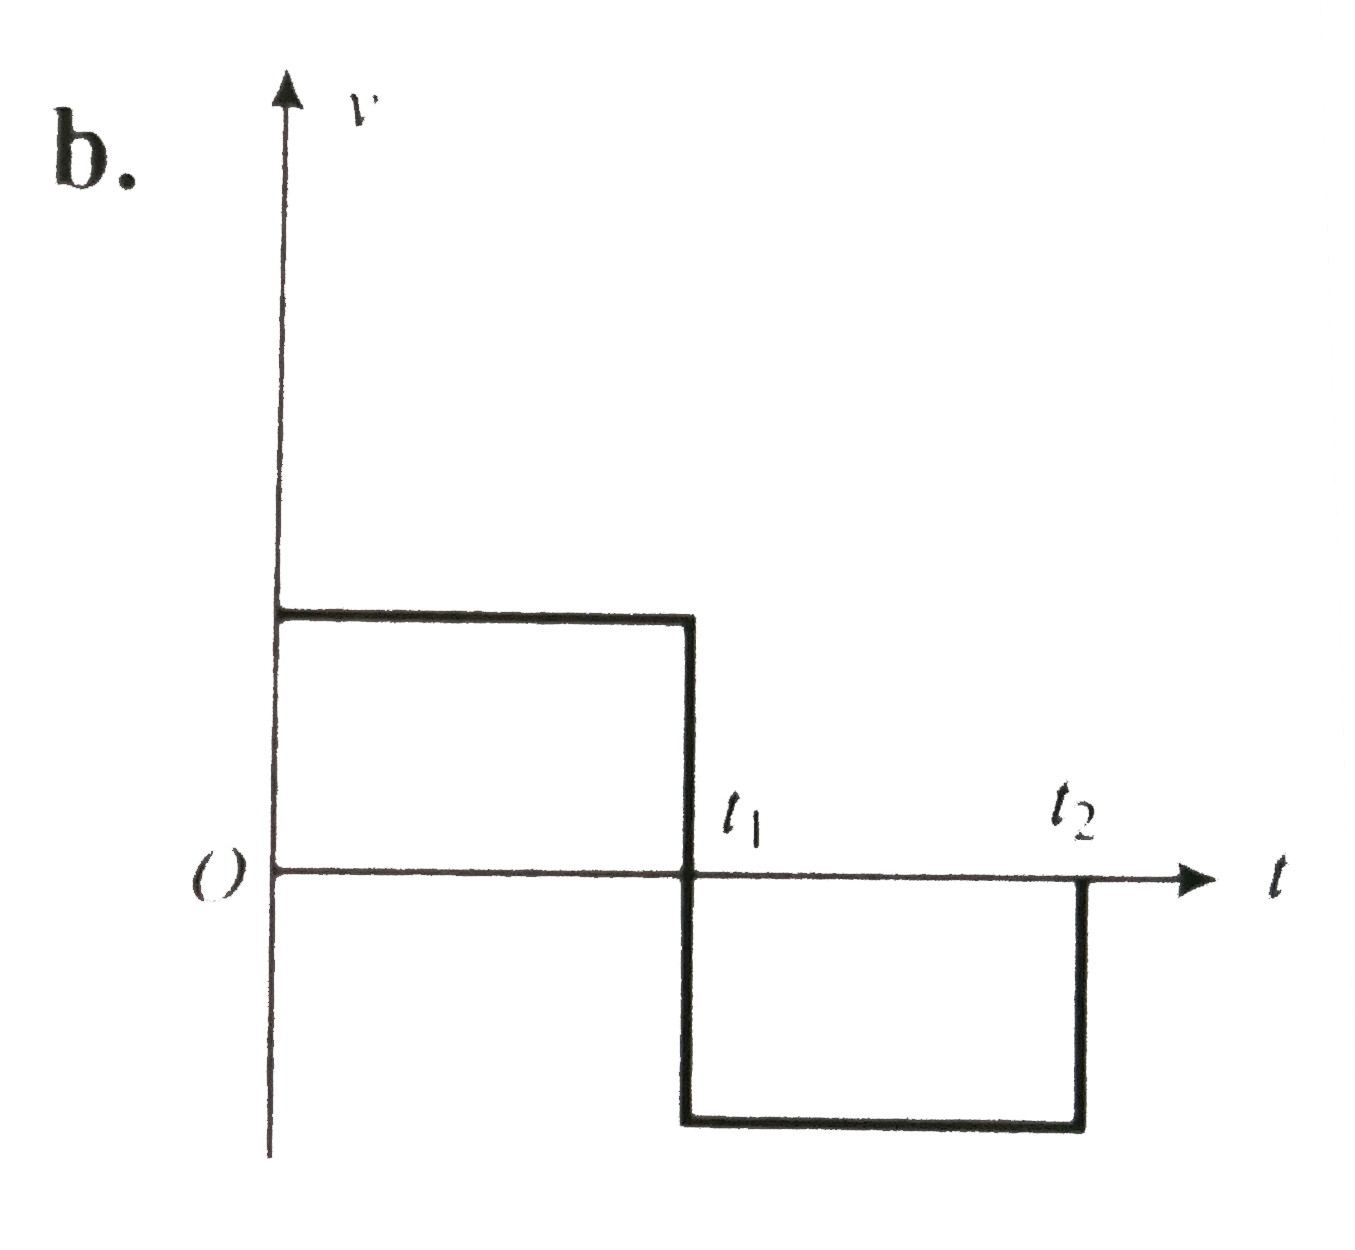 .C
.C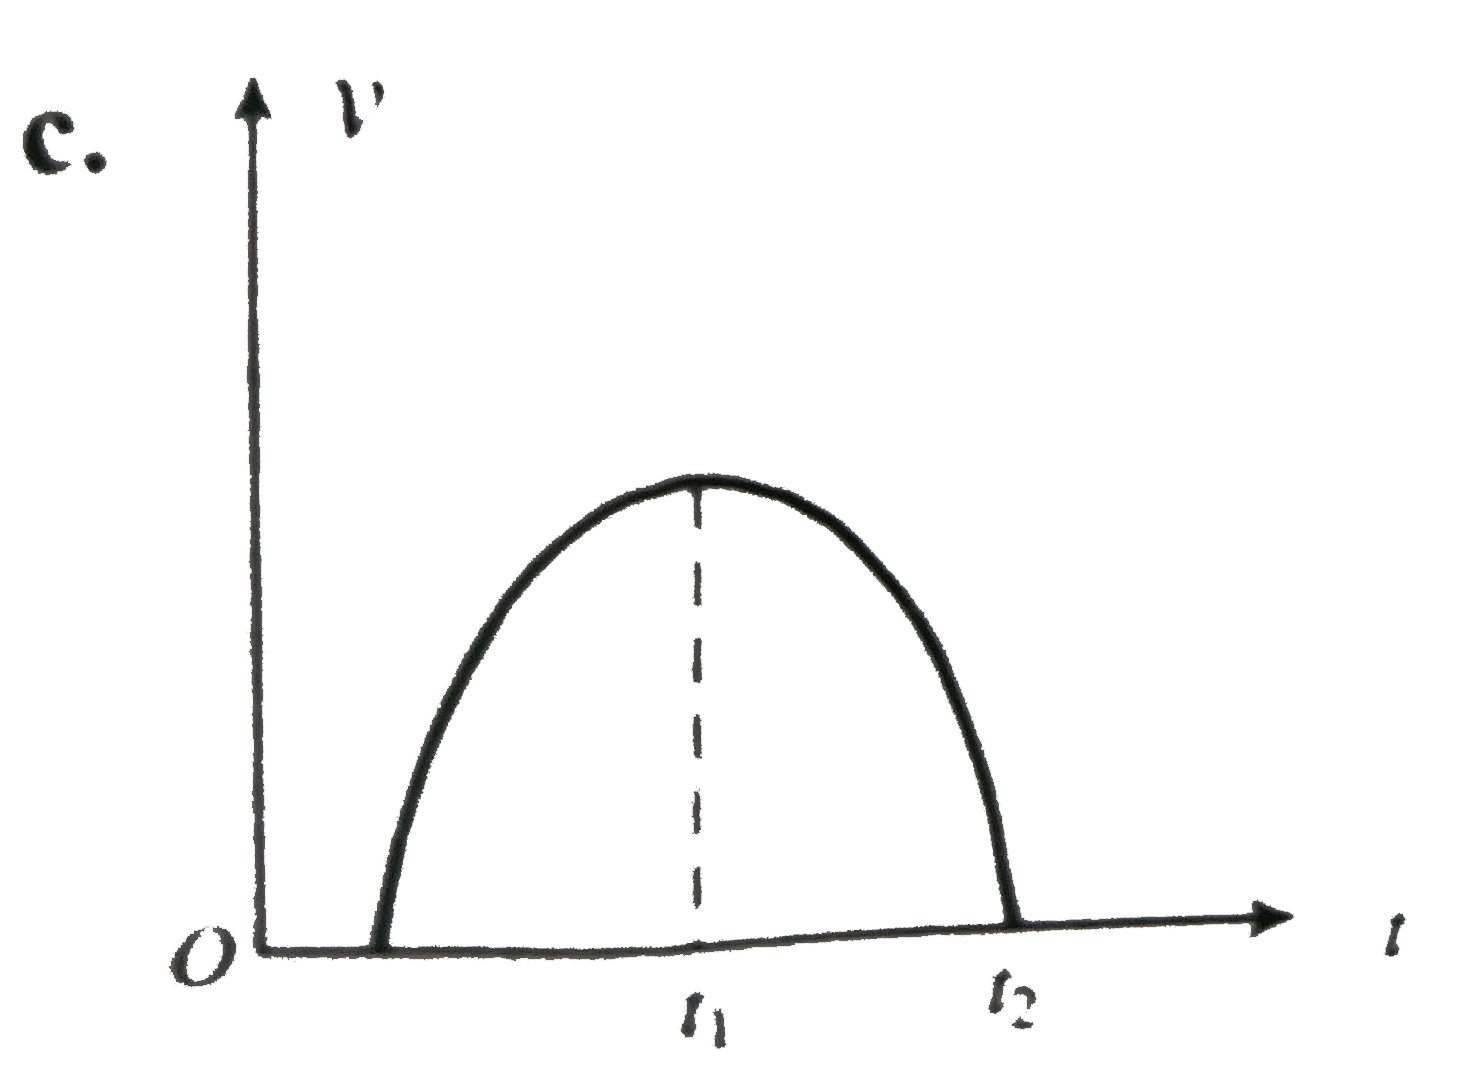 .D
.D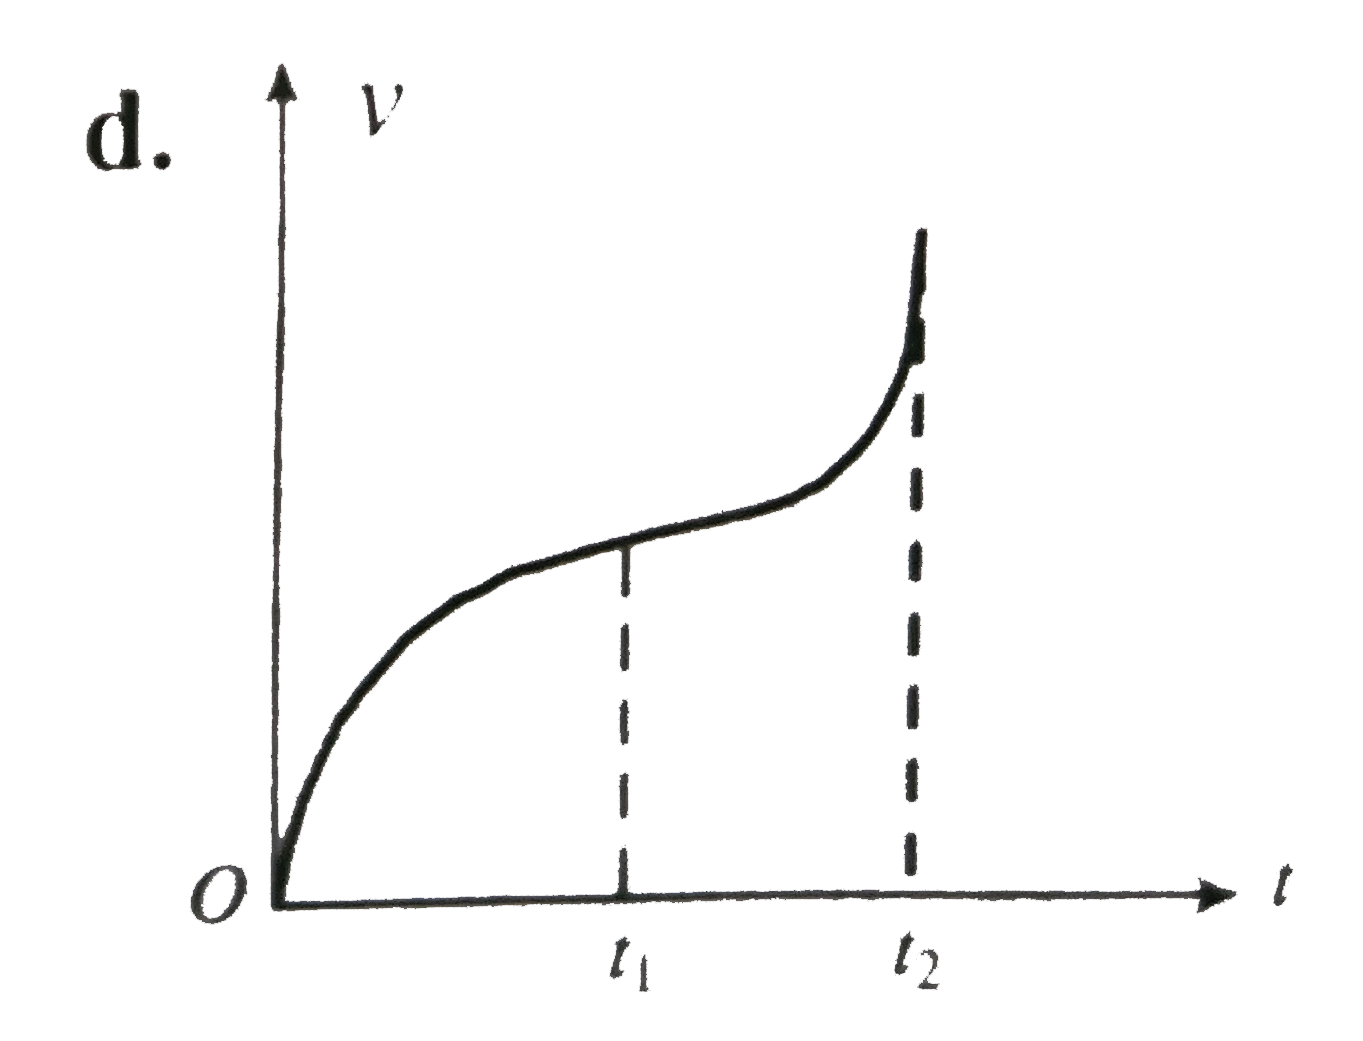 .
.
The velocity − time graph of a particle is as shown in figure

View SolutionThe acceleration versus time graph of a particle moving in a straight line is show in figure. The velocity-time graph of the particle would be
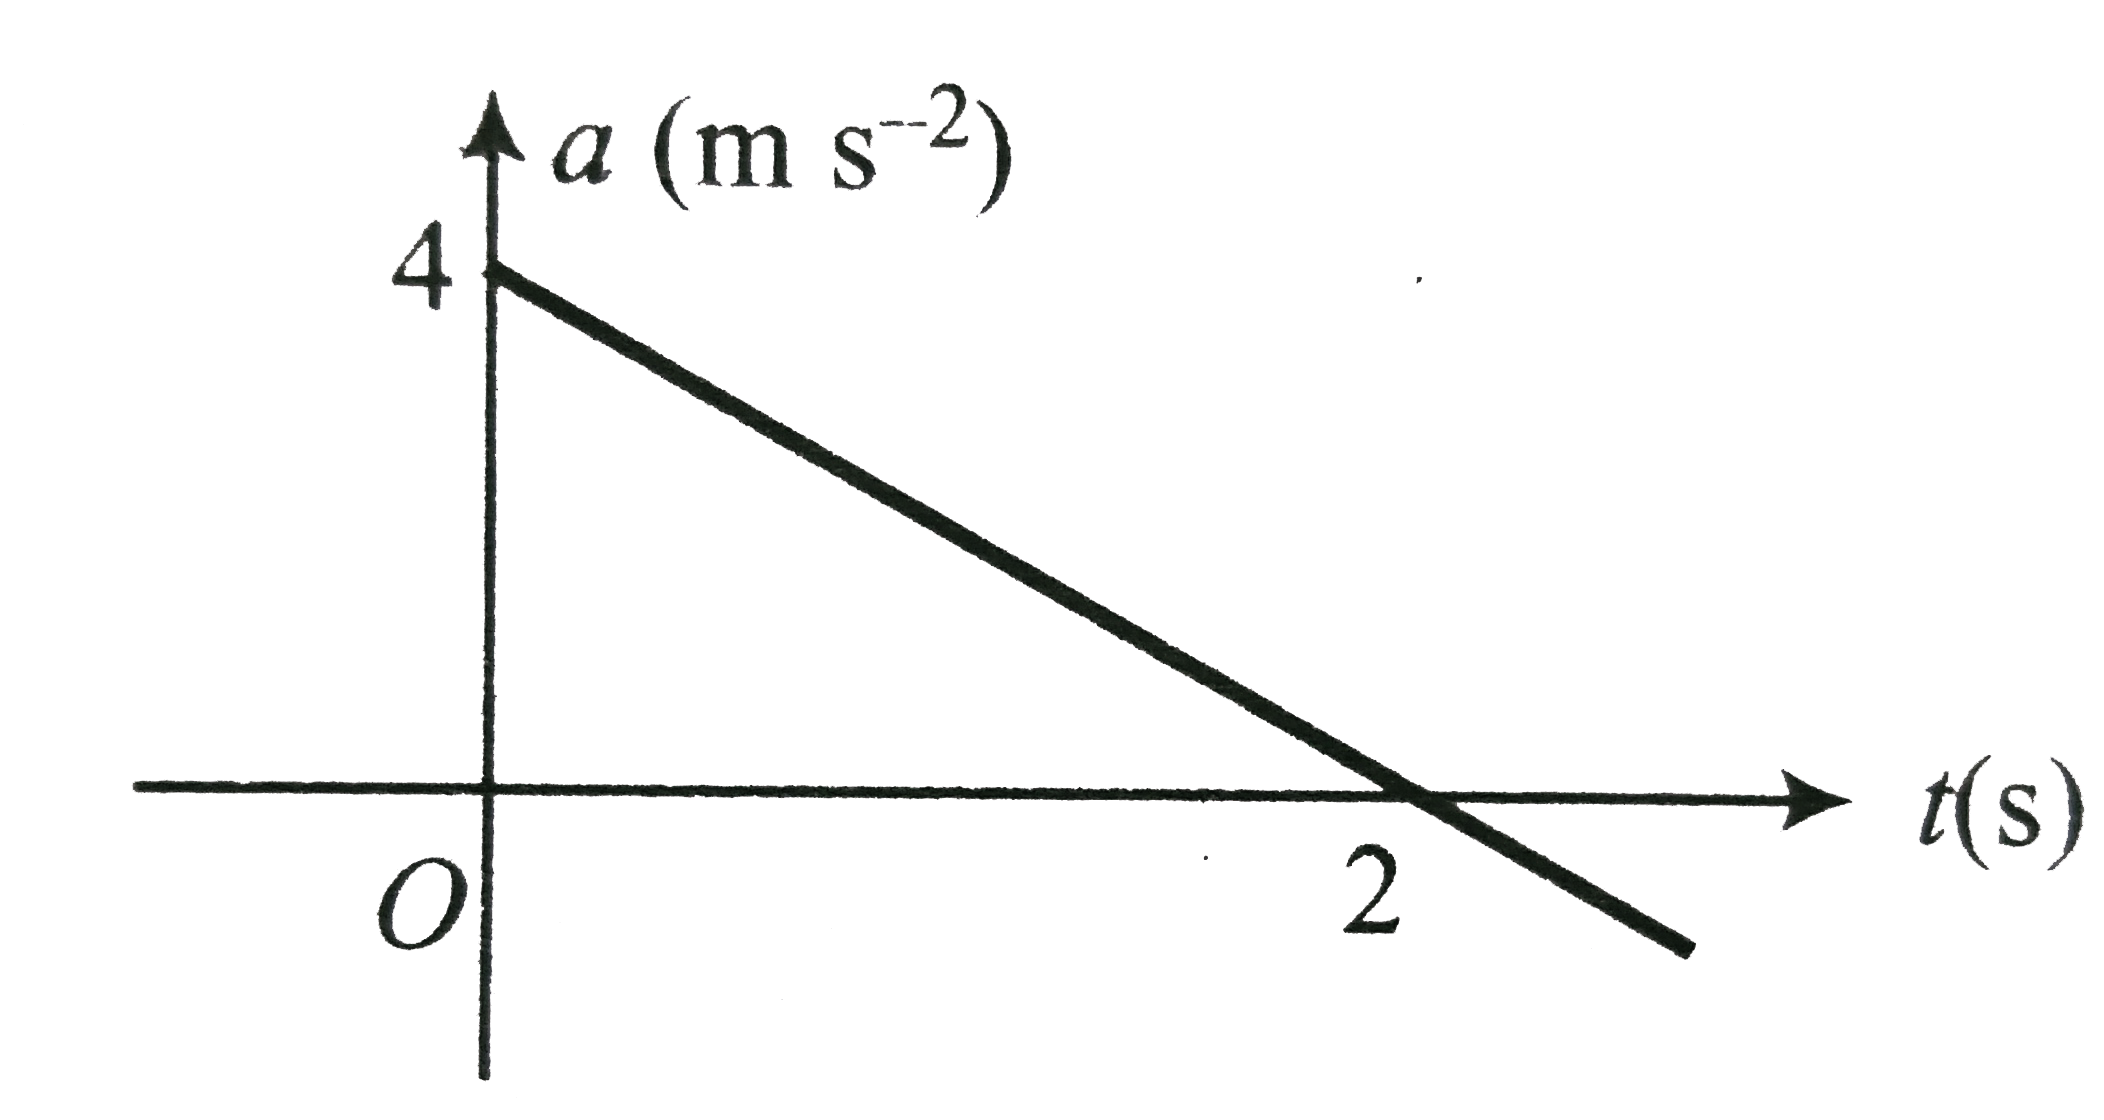 .
.
View SolutionFigure shows the graph of velocity versus time for a particle going along x axis. Initially at t = 0, particle is at x = 3m. Find position of particle at t = 2s. (in m)
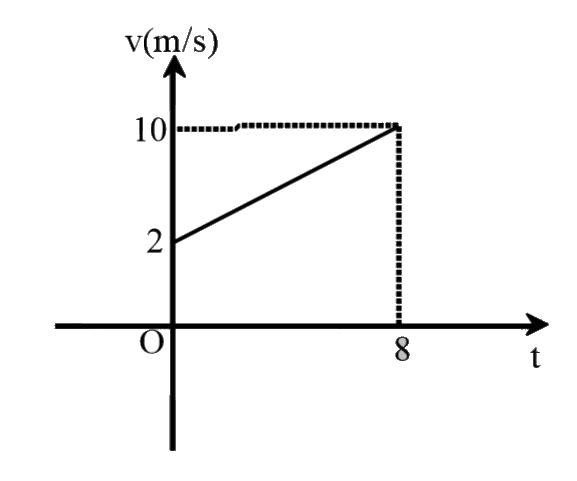
View SolutionThe force F acting on a particle of mass mis indicated by the force-time graph shown below. The change in momentum of the particle over the time interval from zero to 8 s is

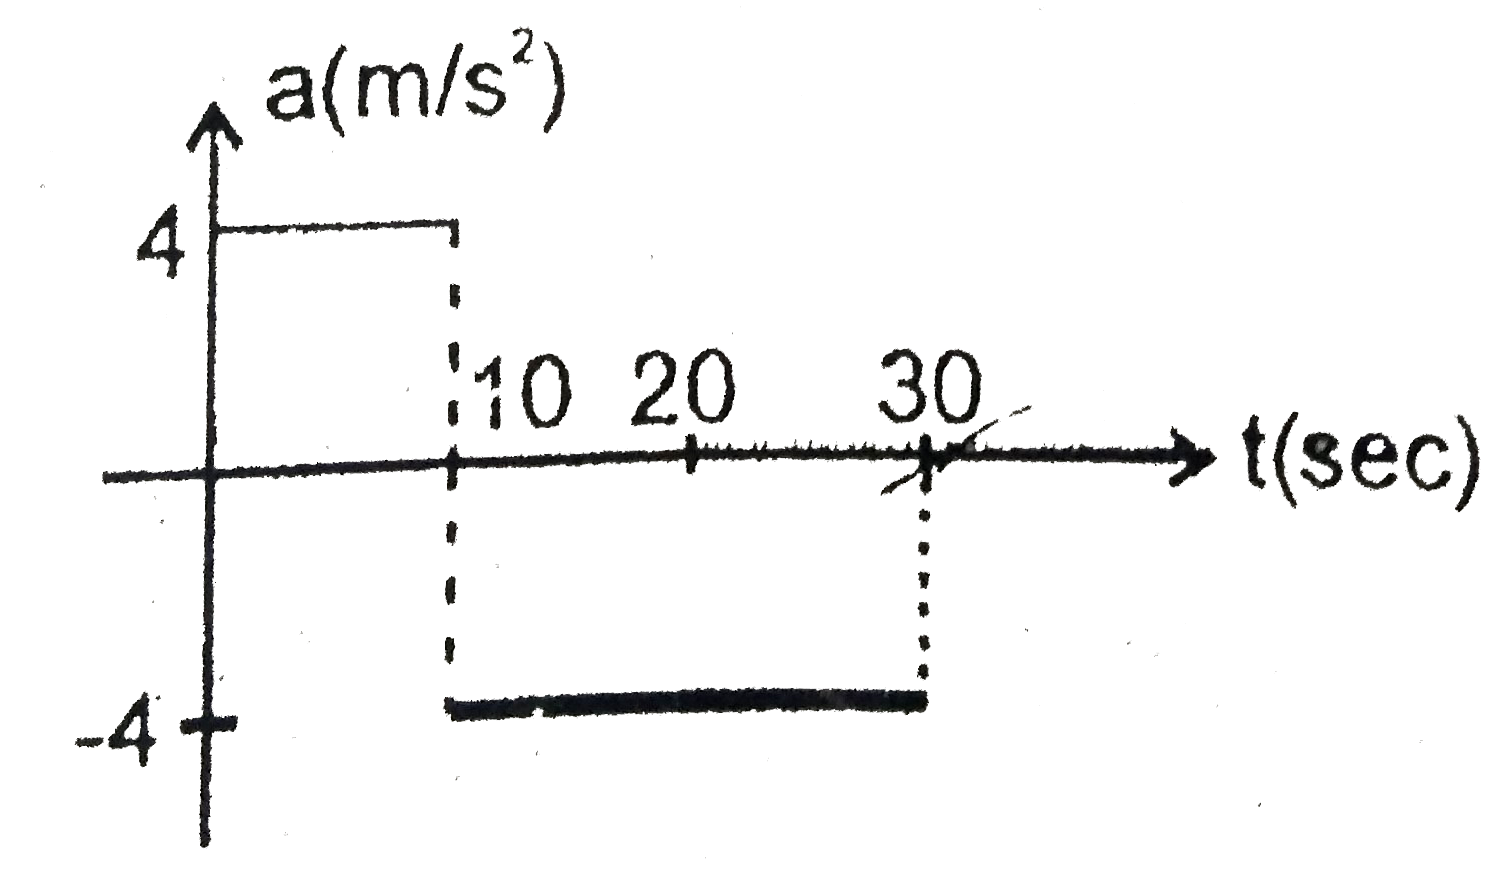
View SolutionThe acceleration versus time graph for a particle moving along a straight line is shown in the figure. If the particle starts from rest at t = 0, then its speed at t = 30 sec will be :
View Solution
