Thomas was hired for a new job in 1977, with a starting salary of $40,000 . Beginning in 1978, Thomas received an annual rise, increasing his salary by $2,300 each year.
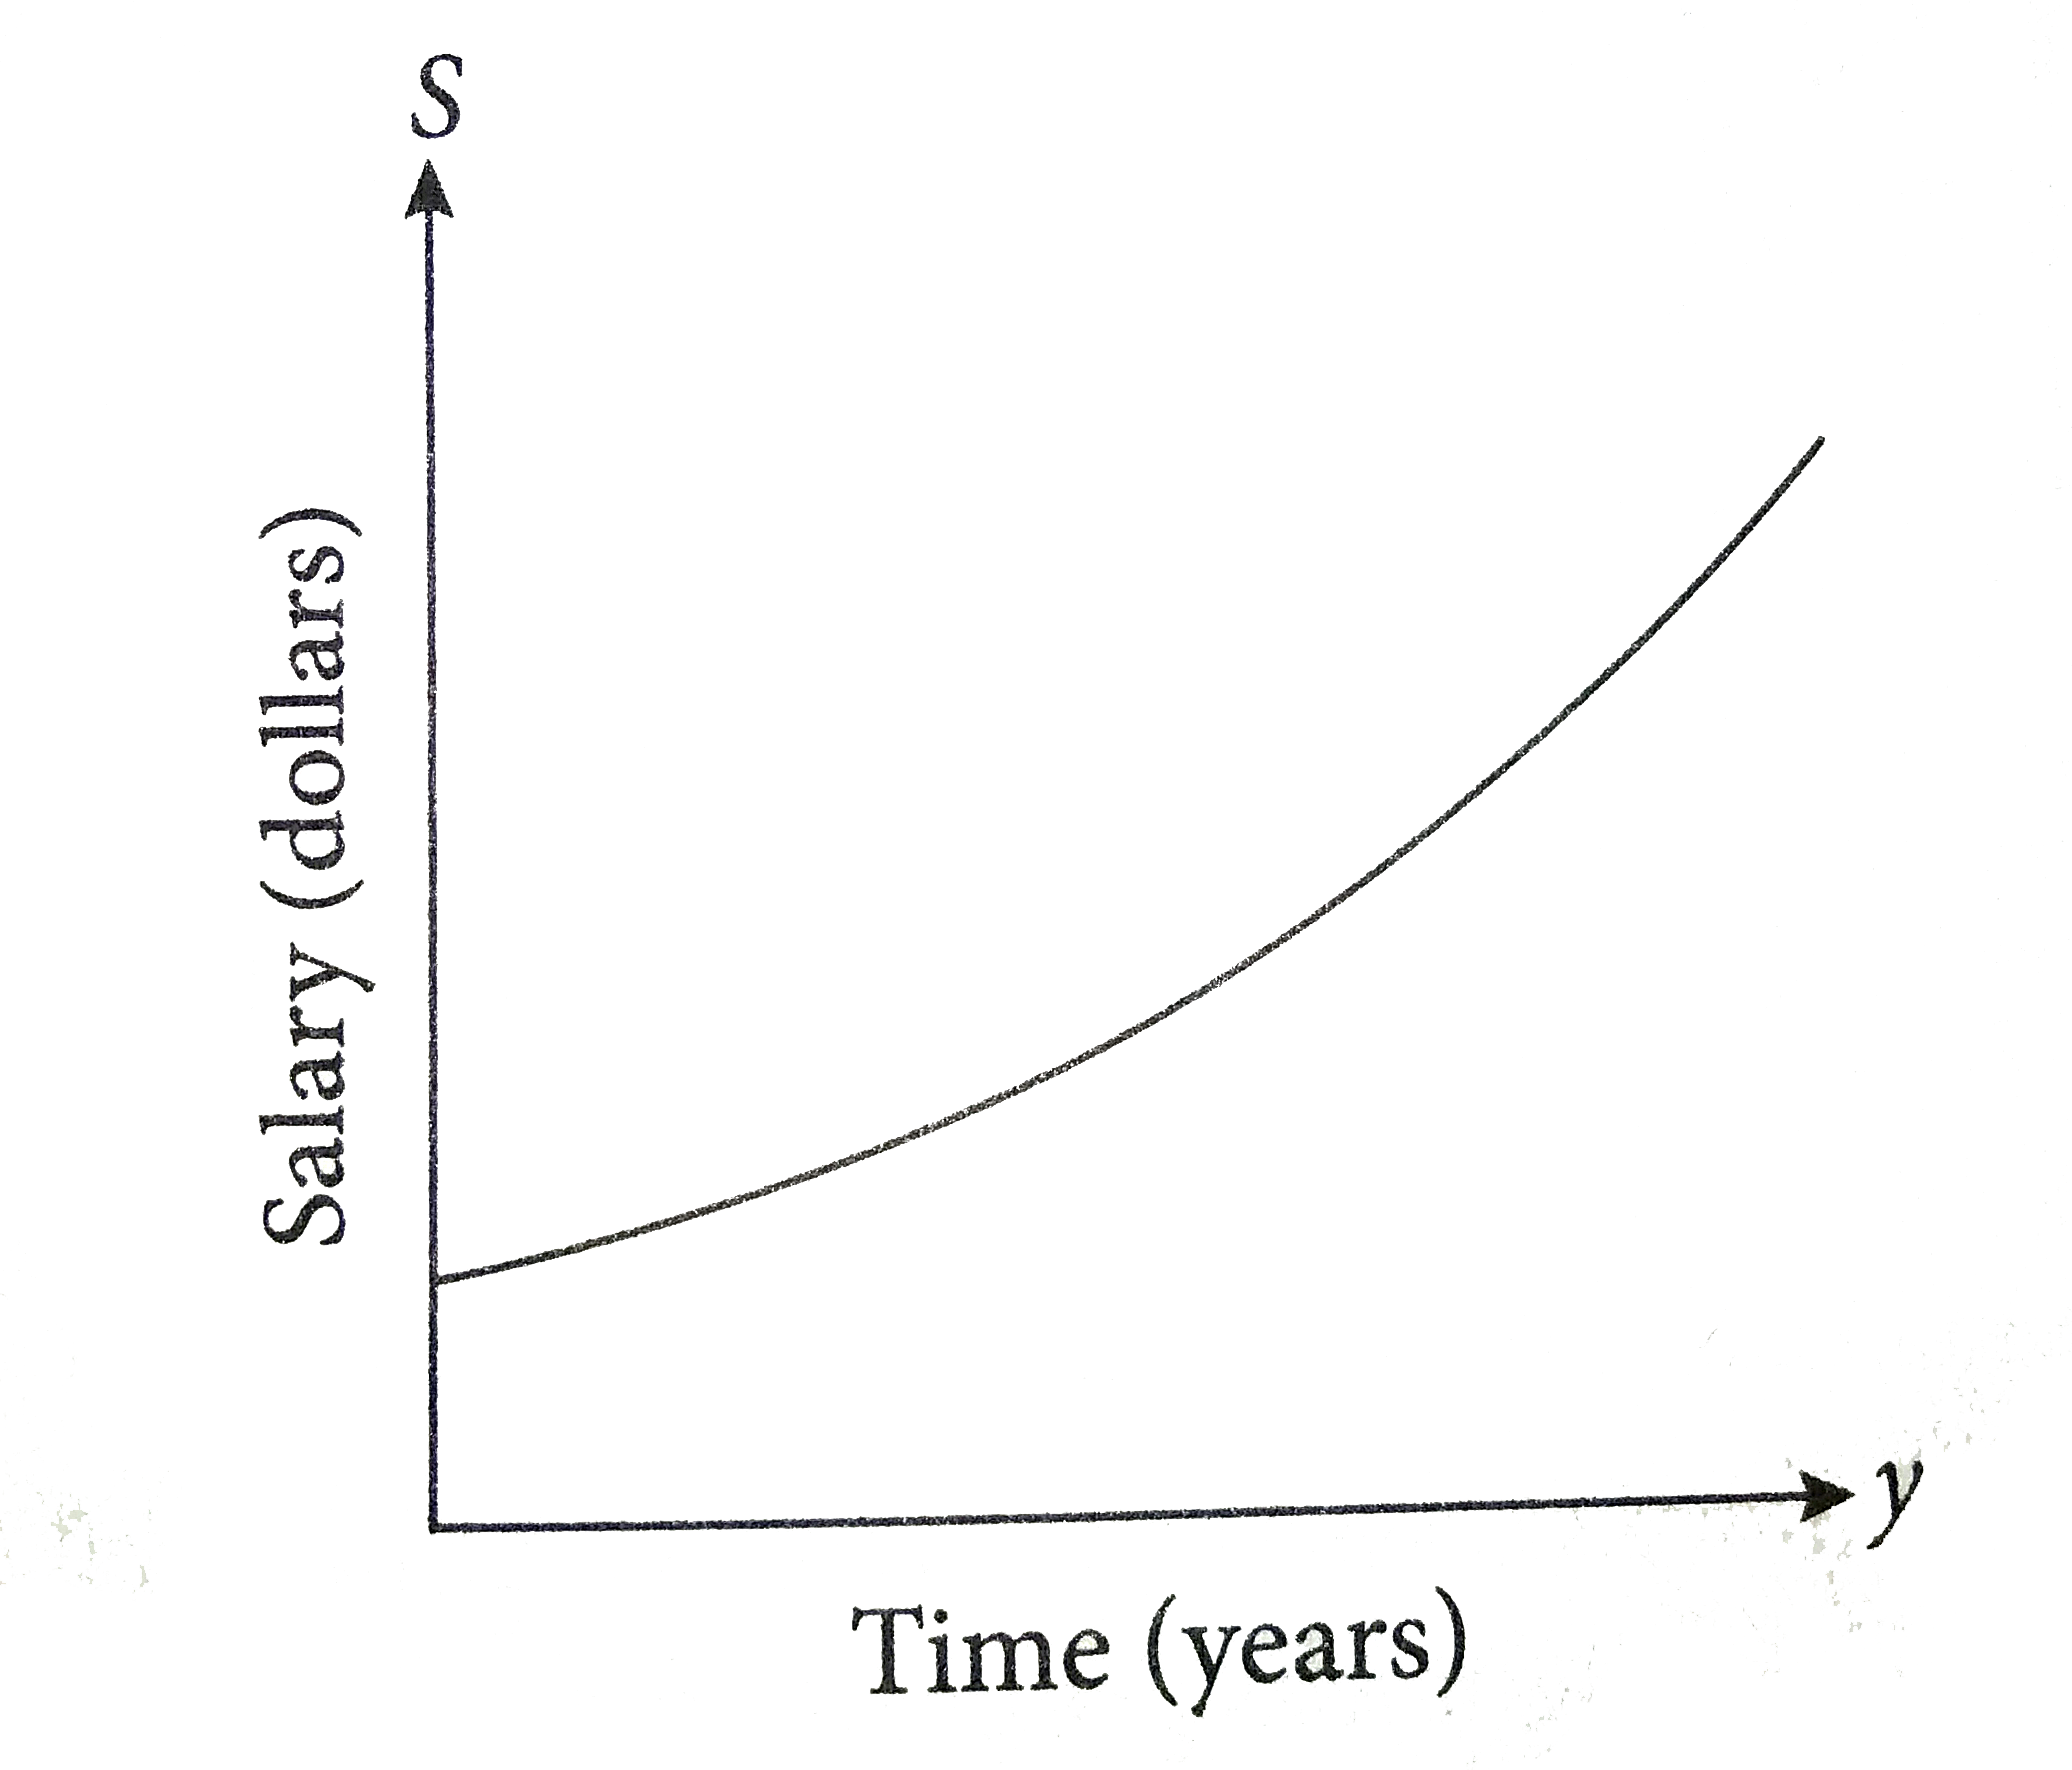
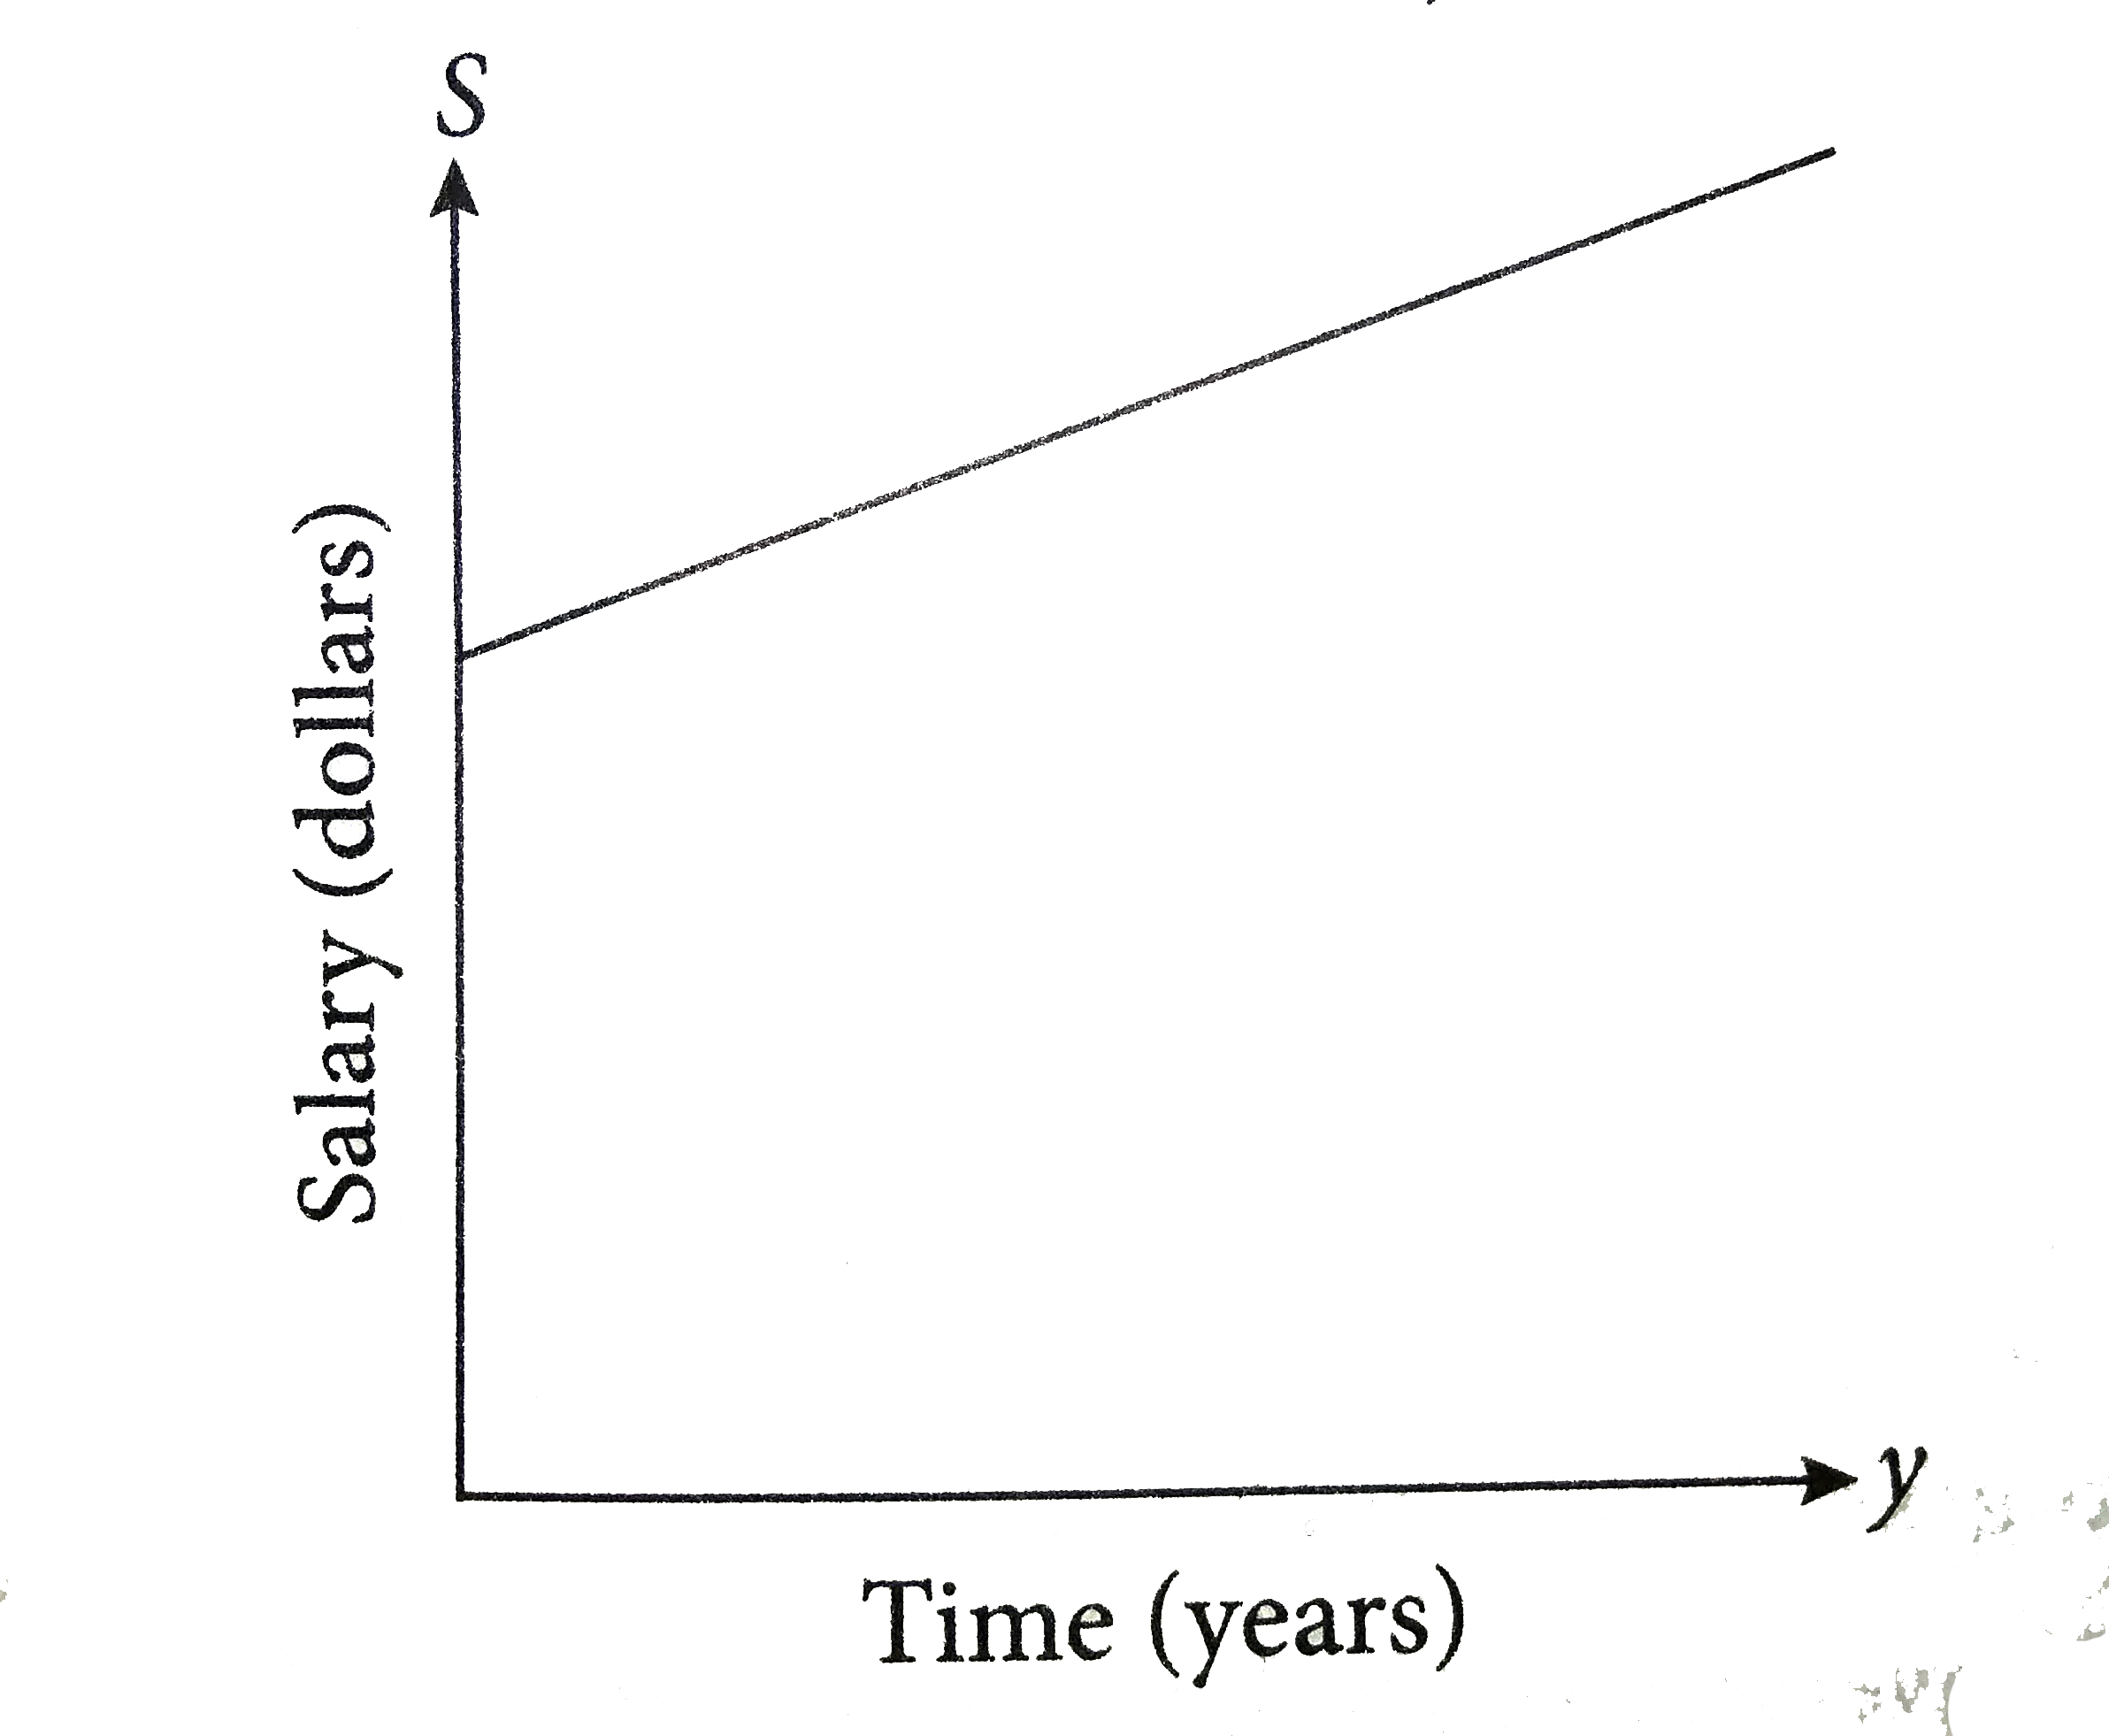
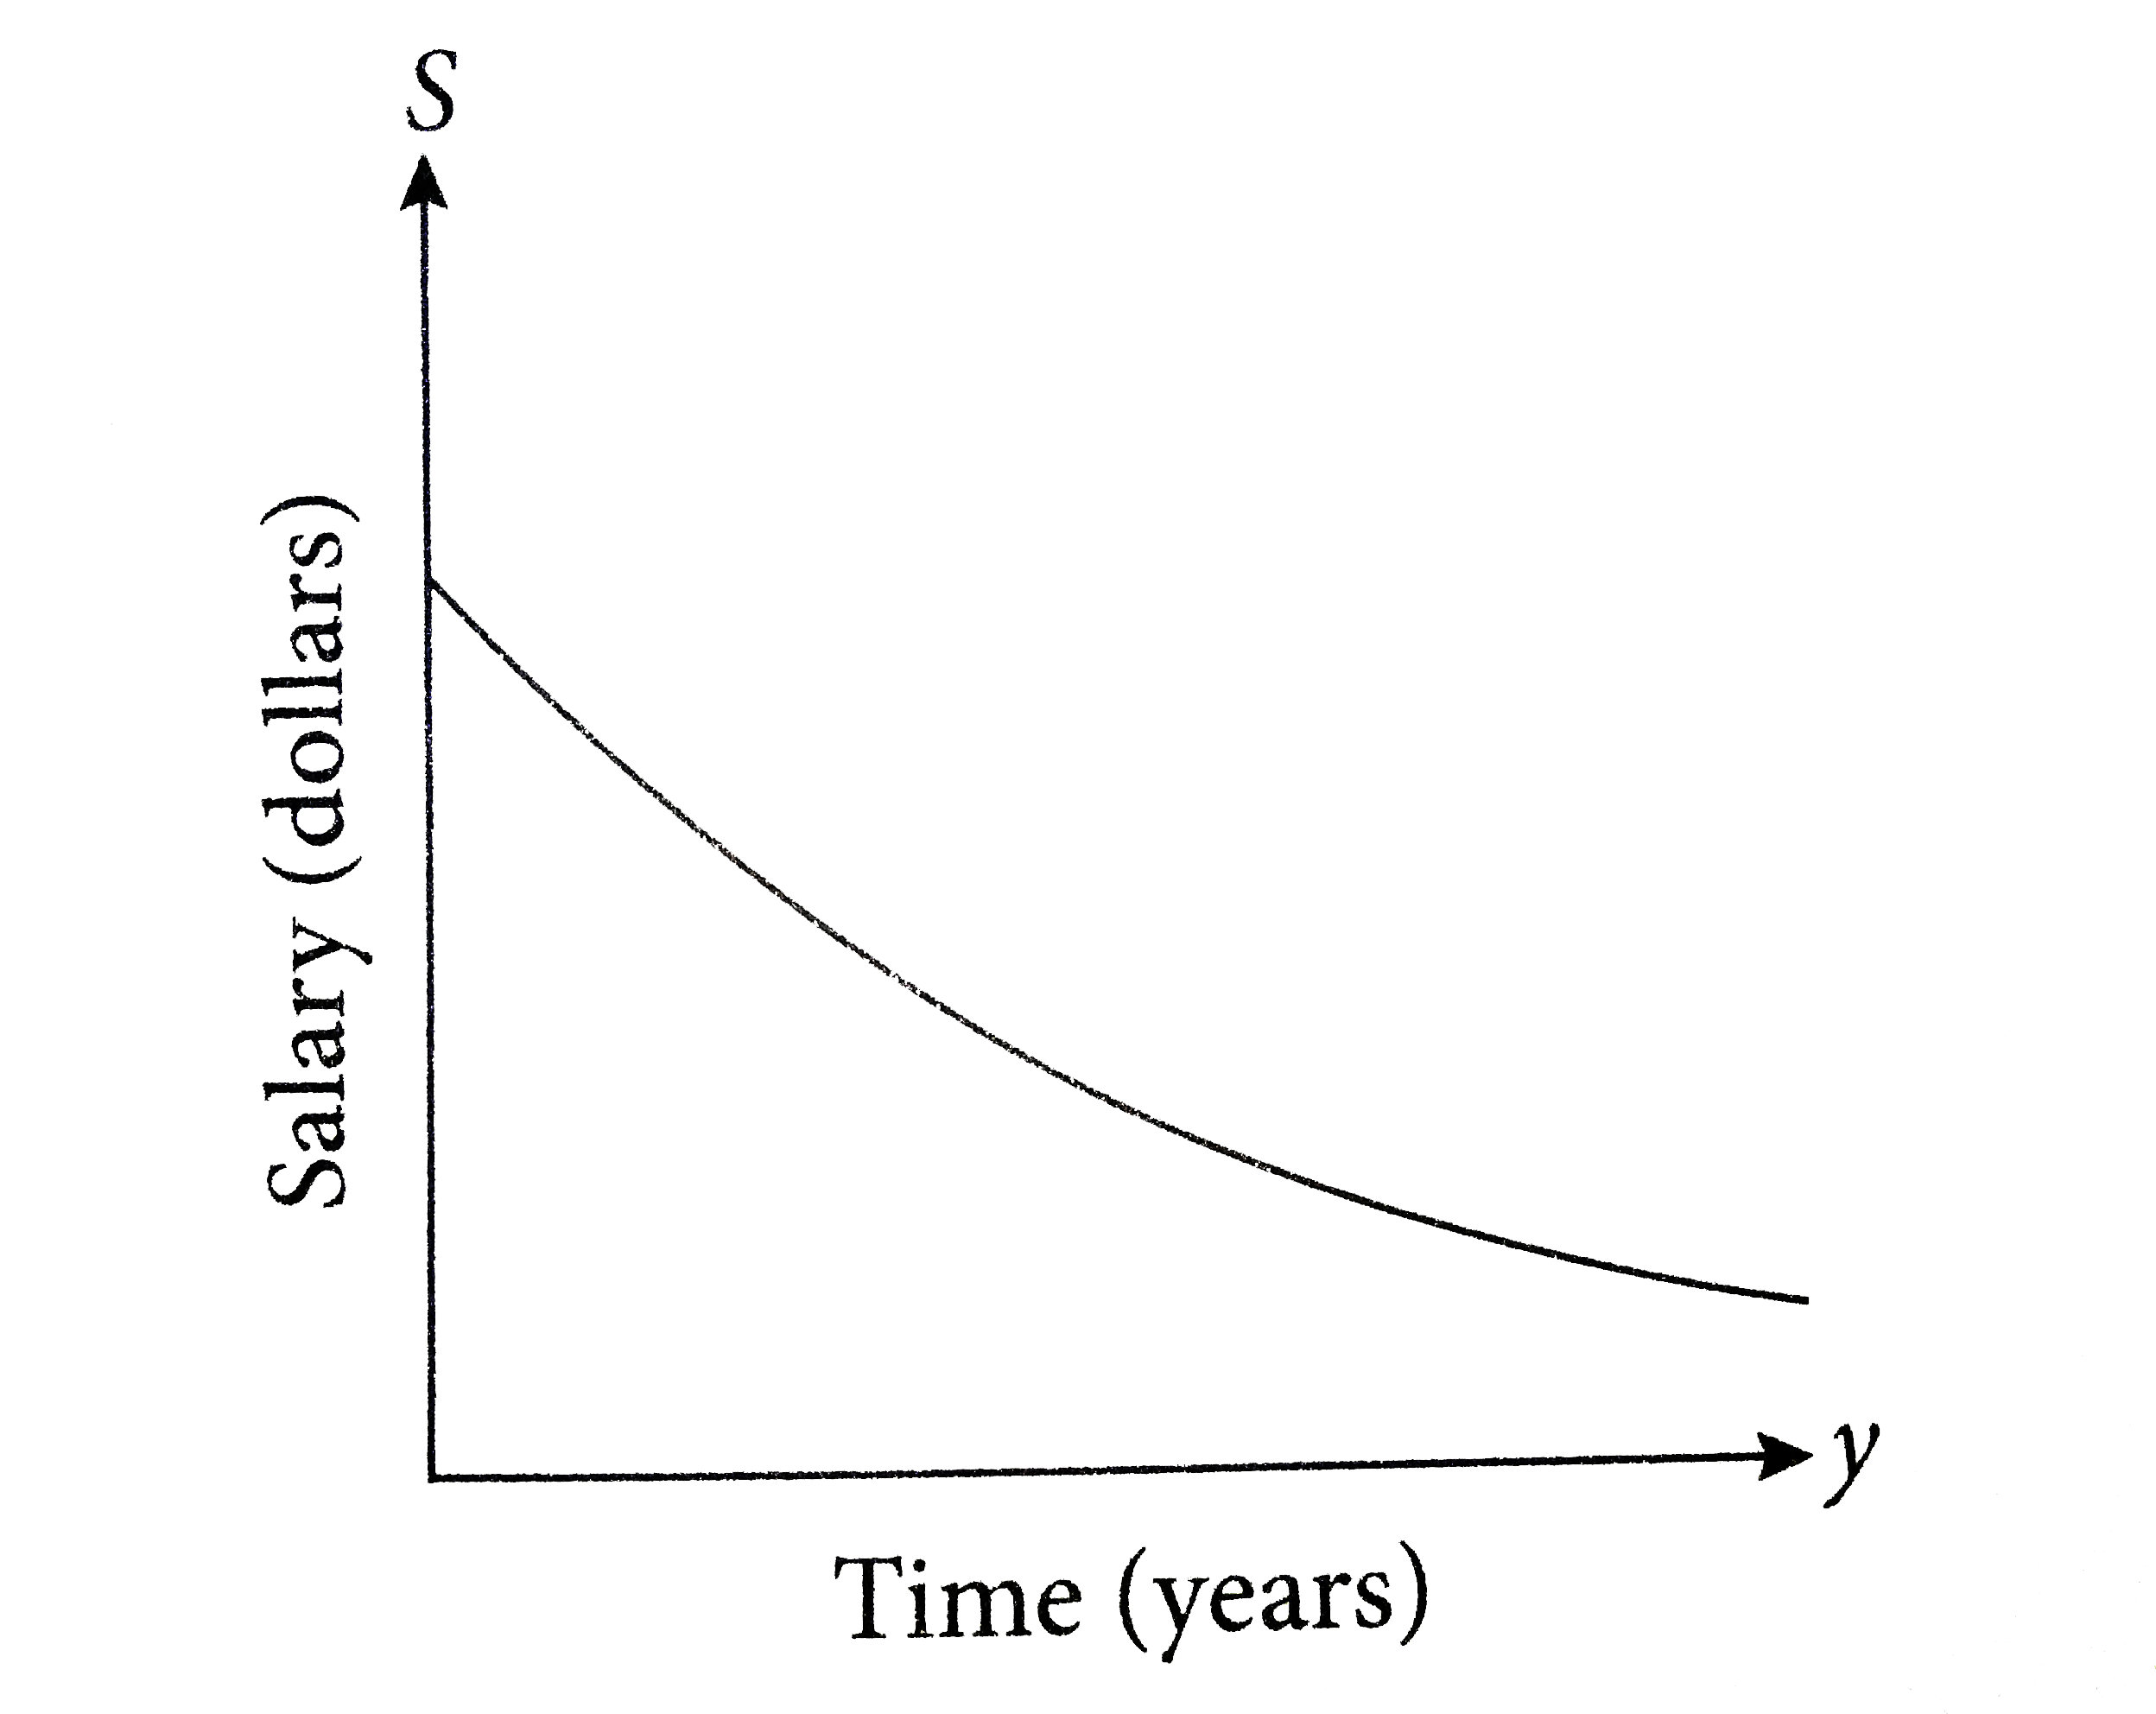
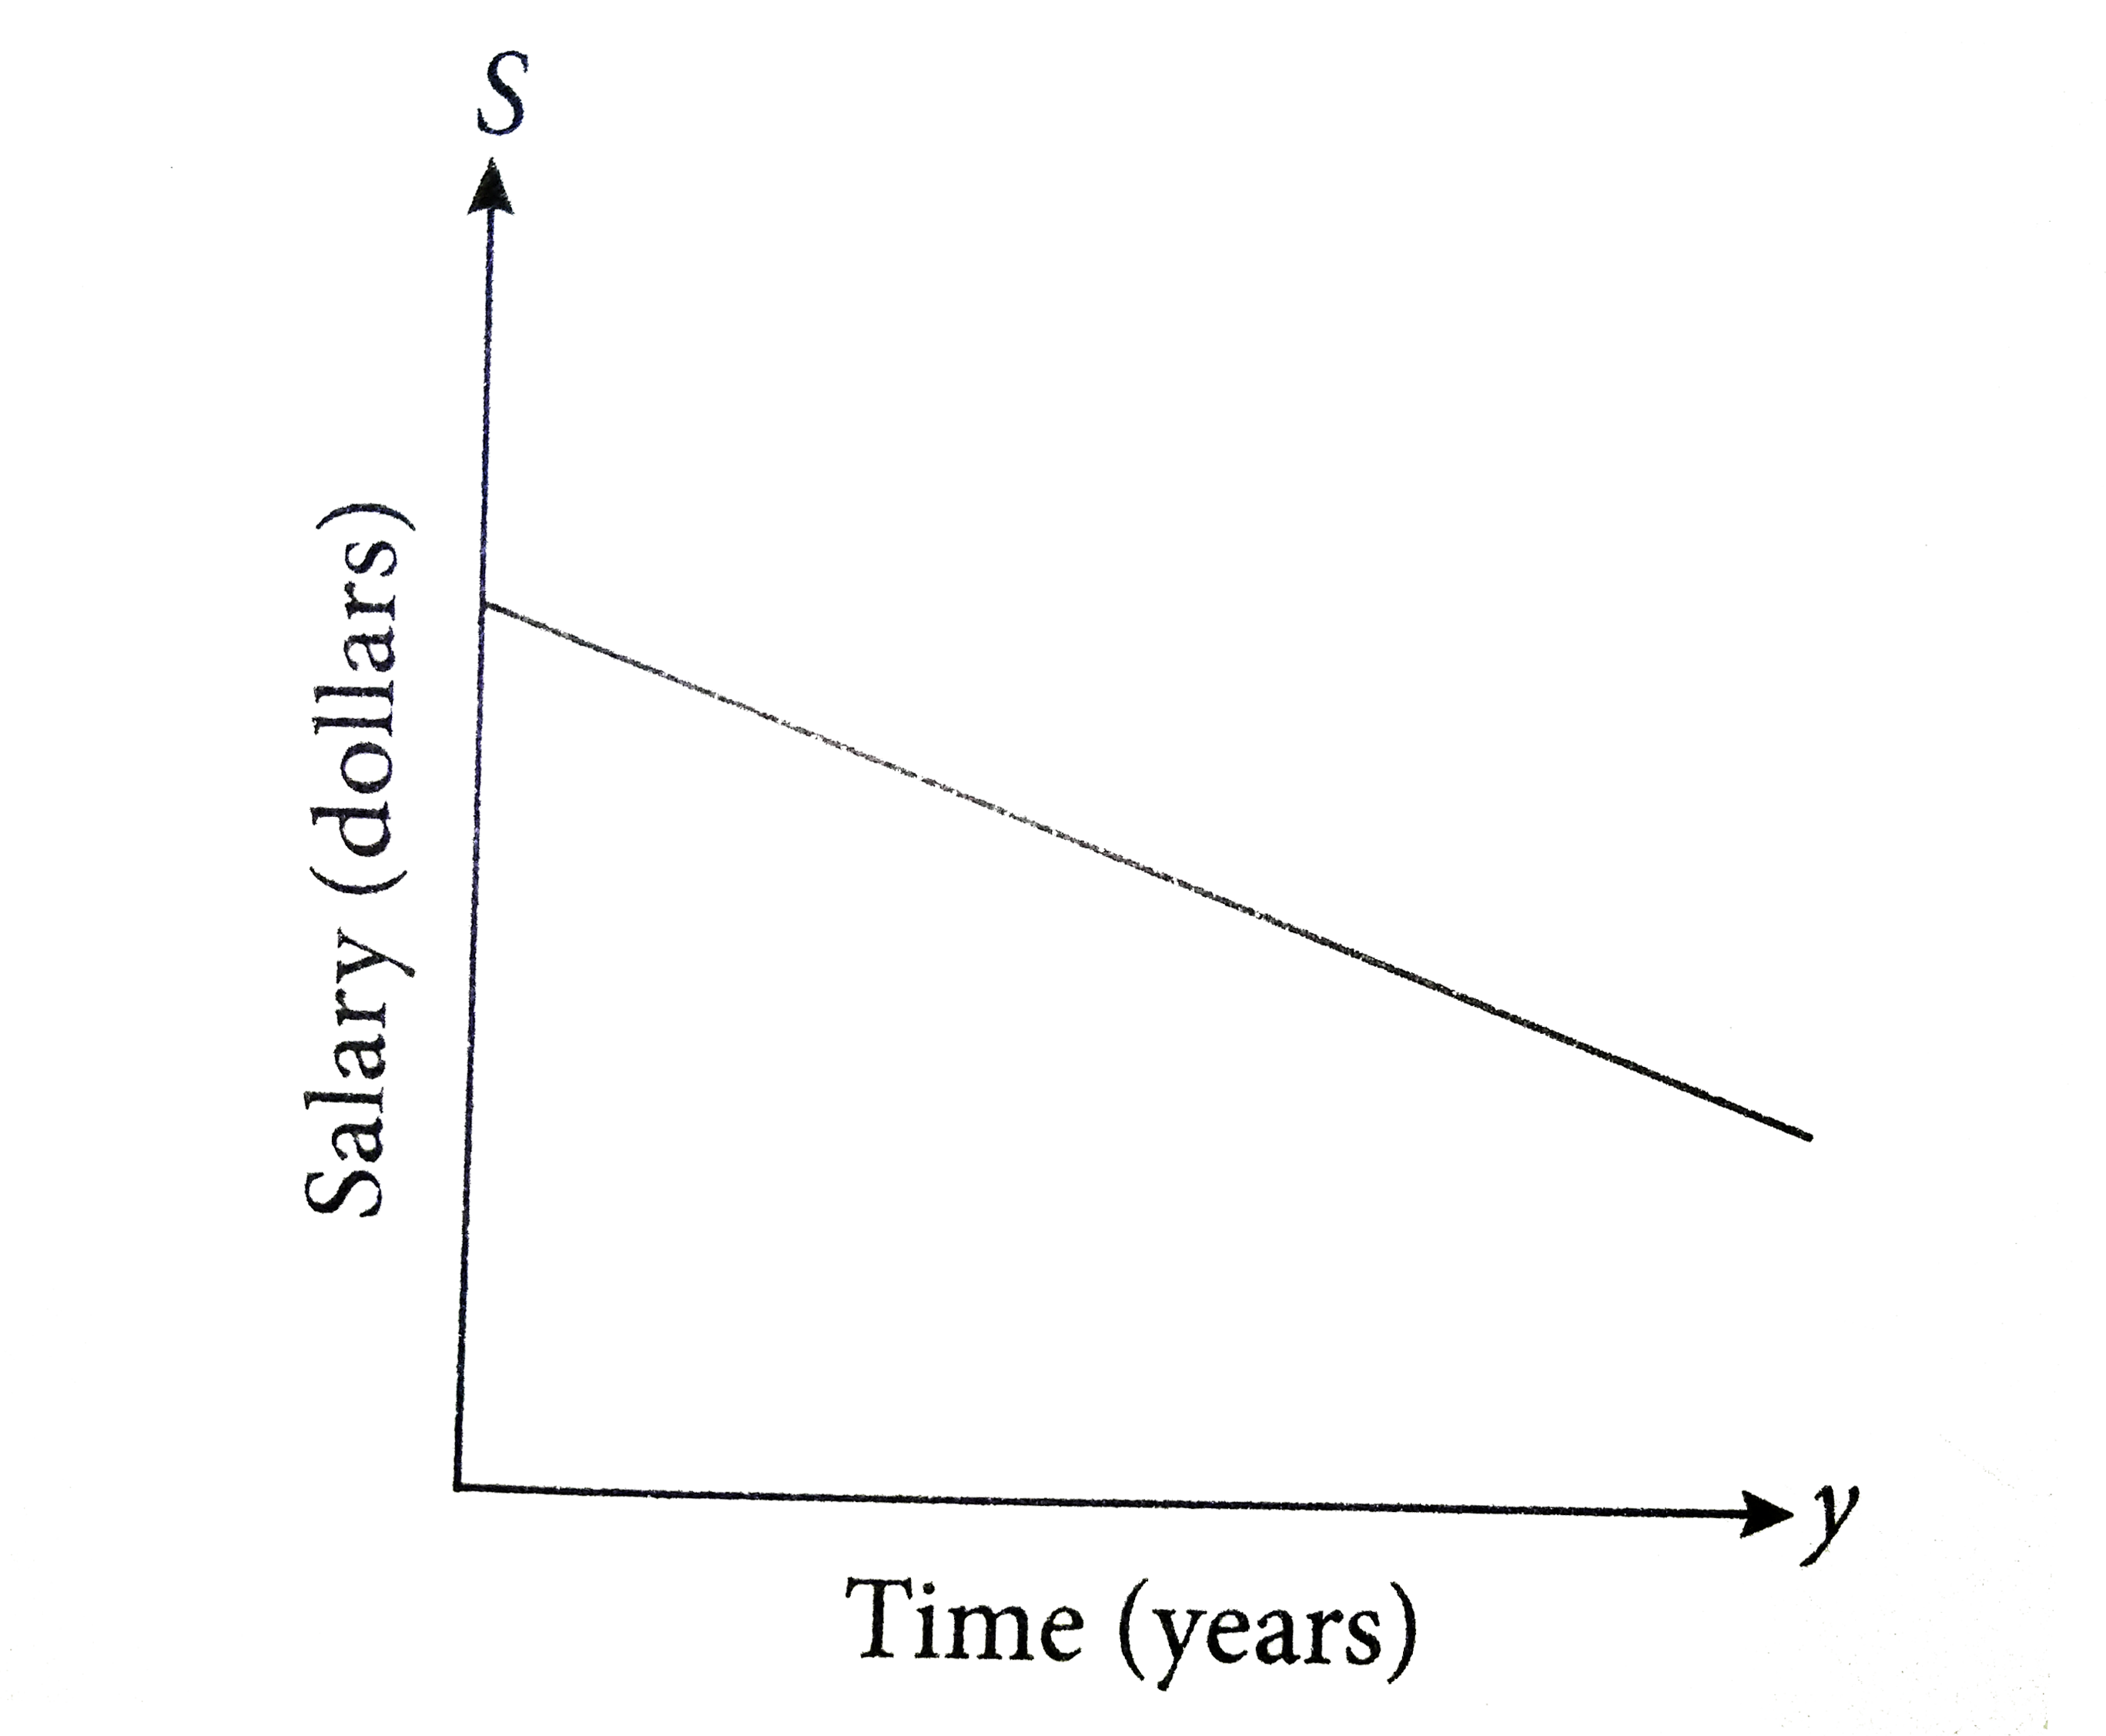
Which of the following graphs could represent Thomas' s salary, S, in dollars, as a function of the number of years,y, after 1977?
The correct Answer is:B
To determine which graph could represent Thomas's salary as a function of the number of years after 1977, we can follow these steps:
Step 1: Identify the starting salary and annual increase
- Thomas's starting salary in 1977 is $40,000.
- From 1978 onwards, he receives an annual increase of $2,300.
Step 2: Define the function for salary
- Let S be the salary after y years.
- The function can be expressed as:
S=40000+2300y
where y is the number of years after 1977.
Step 3: Analyze the function
- The function S=40000+2300y is a linear function because it can be written in the form S=mx+b, where m (the slope) is the annual increase ($2,300) and b (the y-intercept) is the starting salary ($40,000).
Step 4: Determine the characteristics of the graph
- Since the function is linear, the graph will be a straight line.
- The slope is positive, indicating that the salary increases over time.
Step 5: Evaluate the options
- We can rule out any graphs that are not linear.
- Option A and Option C likely represent exponential functions, which do not fit our linear model.
- Option D likely represents a decreasing function, which is not applicable since Thomas's salary is increasing.
Step 6: Identify the correct graph
- The only graph that shows a linear increase starting from $40,000 and increasing by $2,300 each year is Option B.
Conclusion
- Therefore, the graph that represents Thomas's salary as a function of the number of years after 1977 is Option B.
---
- Thomas's starting salary in 1977 is $40,000.
- From 1978 onwards, he receives an annual increase of $2,300.
- Let S be the salary after y years.
- The function can be expressed as:
S=40000+2300y
where y is the number of years after 1977.
- The function S=40000+2300y is a linear function because it can be written in the form S=mx+b, where m (the slope) is the annual increase ($2,300) and b (the y-intercept) is the starting salary ($40,000).
- Since the function is linear, the graph will be a straight line.
- The slope is positive, indicating that the salary increases over time.
- We can rule out any graphs that are not linear.
- Option A and Option C likely represent exponential functions, which do not fit our linear model.
- Option D likely represents a decreasing function, which is not applicable since Thomas's salary is increasing.
- The only graph that shows a linear increase starting from $40,000 and increasing by $2,300 each year is Option B.
- Therefore, the graph that represents Thomas's salary as a function of the number of years after 1977 is Option B.
Similar Questions
Subba Rao started work in 1995 at an annual salary of Rs 5000 and received an increment of Rs 200 each year. In which year did his income reach Rs 7000?
View SolutionMilk starts a job at which his starting salary is $25500 per year. He expects that his salary will increase by a constnat dollar amount annually. In 12 years, his salary will be doulb ehis starting salary. Assuming salary increases take place only at the eand of a full year, how many years must Malik wait until his salary is at least $40,000 annually ?
View Solution
Knowledge Check
Thomas was hired for a new job in 1977, with a starting salary of $40,000 . Beginning in 1978, Thomas received an annual rise, increasing his salary by $2,300 each year.
Which of the following must be true, given that Thomas's salary after y years was between $54,000 and $60,000?A3<y<6B6<y<9C9<y<12Dy>12Thomas was hired for a new job in 1977, with a starting salary of $40,000 . Beginning in 1978, Thomas received an annual rise, increasing his salary by $2,300 each year.
IF thomas retired at the end of 1999, what was his salary in his final year?A90600B76000C54600D40000Two worker were hired to begin work at the same time. Worker A's contract called for a starting salary of $20,000 with an increase of $800 after each year of employment. Worker B's contract called for a starting salary of $15,200 with an increase of $2,000 after each year of employment. If x represents the number of full years employment (that is, the number of yearly increases each worker has received), which of the number of years until B's yearly salary equals A's yearly salary?
A20,000+800x=15,200+2,000xB20,000+2,000x=15,200+800xC(20,000+800)x=(15,200+2,000)xD(2,000+800)x=20,000−15,200
Ram and Ali have been fast friends since childhood. Ali neglected studies and now has no means to earn money other than a channel whereas Ram has become an engineer. Now both are working in the same factory. Ali uses camel to transport the load within the factory.
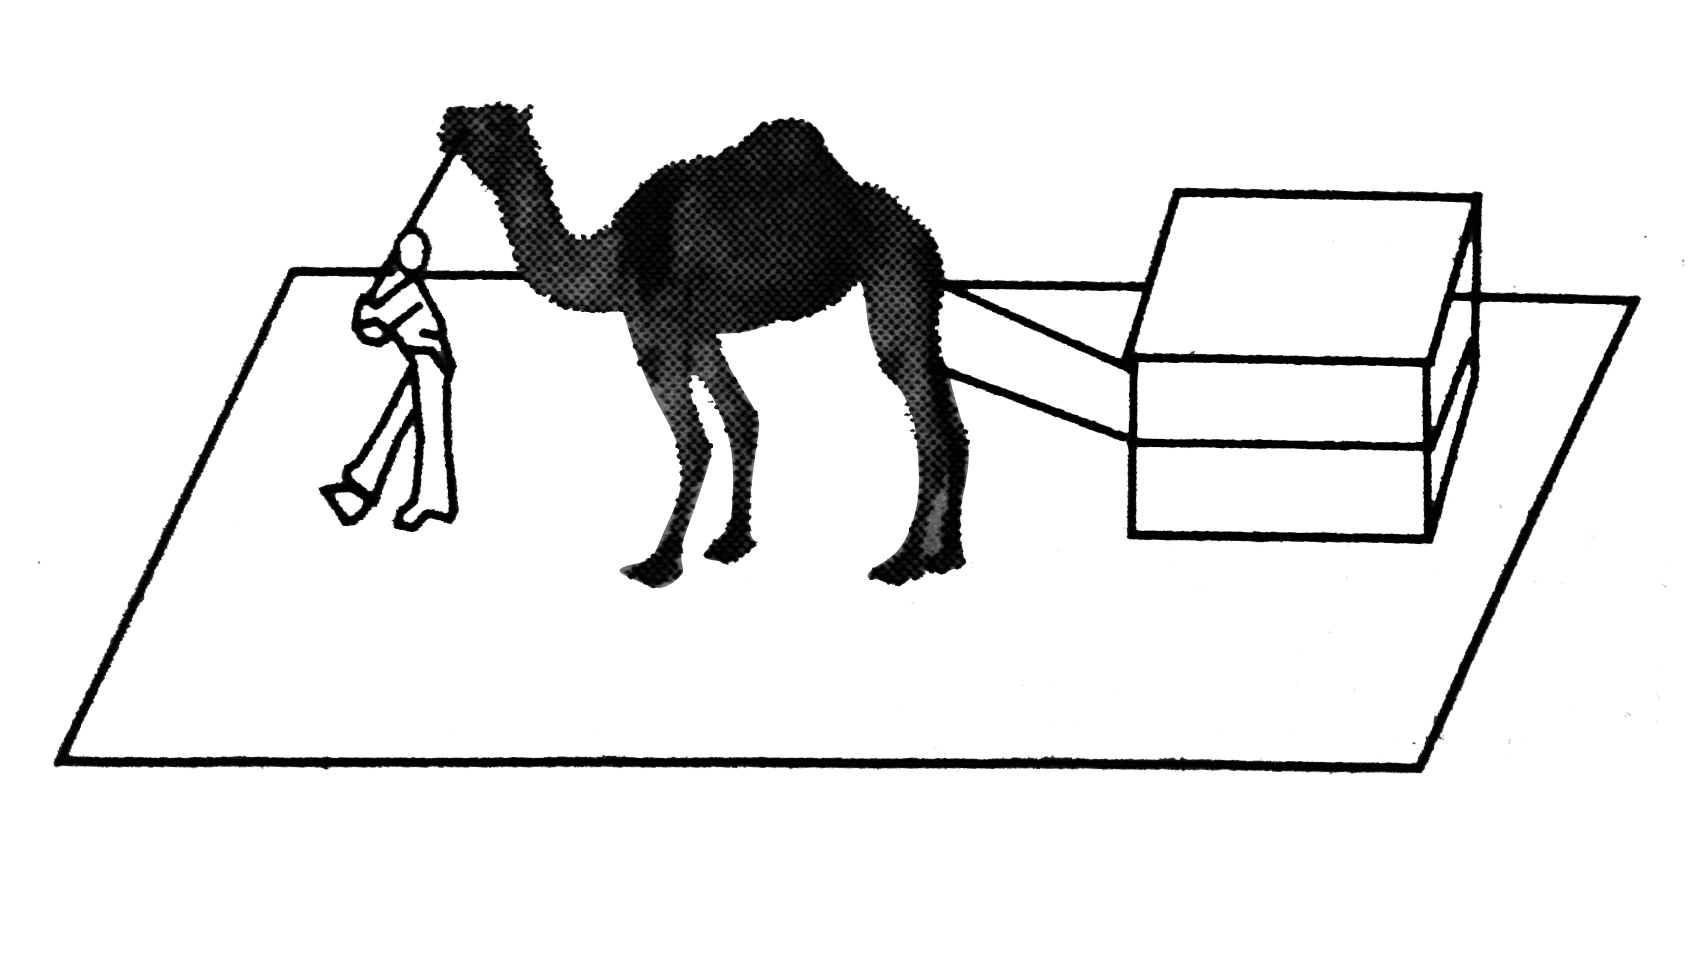 Due to low salary and degradation in health of camel, Ali becomes worried and meets his friend Ram and discusses his problems. Ram collected some data and with some assumptions concluded the following:
i. The load used in each trip is 1000kg and has friction coefficient μk=0.1 and μs=0.2.
ii. Mass of camel is 500kg.
iii. Load is accelerated for first 50m with constant acceleration, then it is pulled at a constant speed of 5ms−1 for 2km and at last stopped with constant retardation in 50m.
iv. From biological data, the rate of consumption of energy of camel can be expressed as P=18×103v+104Js−1 where P is the power and v is the velocity of the camel. After calculations on different issues, Ram suggested proper food, speed of camel, etc. to his friend. For the welfare of Ali, Ram wrote a letter to the management to increase his salary.
(Assuming that the camel exerts a horizontal force on the load):
The ratio of the energy consumed by the camel during uniform motion for the two cases when it moves with speed 5ms−1 to the case when it moves with 10ms−1
View SolutionIn 2012, a retail chain of fast food rstaurant has 68 restaurants in California an started to expand nationally by adding 9 new restaurants each year thereafter. At this rate, which of the following functions f represents the number of restaurants there will be in this retail chain n years after 2012 assuming none of these restaurants close?
View SolutionThe breakdown of a sample of a chemical compounds is represented by the function p(n)=300(0.5)n, where p(n) represents the number of millligrams of the substance that remains at the end of n years. Which of the following is true?
I. 300 represents the number of milligrams of the substance that remains after the first year.
II. 0.5 represents the fraction of the starting amount by which the substance gets reduced by the end of each year.
III. Each year the substance gets reduced by one-half of 300.
View SolutionKeith modeled the growth over several hundred years of a tree population by estimating the number of the trees’ pollen grains per square centimeter that were deposited each year within layers of a lake’s sediment. He estimated there were 310 pollen grains per square centimeter the first year the grains were deposited, with a 1% annual increase in the number of grains per square centimeter thereafter. Which of the following functions models P(t), the number of pollen grains per square centimeter t years after the first year the grains were deposited?
View SolutionA marketing team conducted a study on the use of smartphones. In a certain metropolitan area, there were 1.6 million smartphone users at the end of 2018. The marketing team predicted that the number of smartphone users would increase by 35 percent each year beginning in 2019. If y represents the number of smartphone users in this metropolitan area after x years, then which of the following equations best models the number of smartphone users in this area over time ?
View Solution

