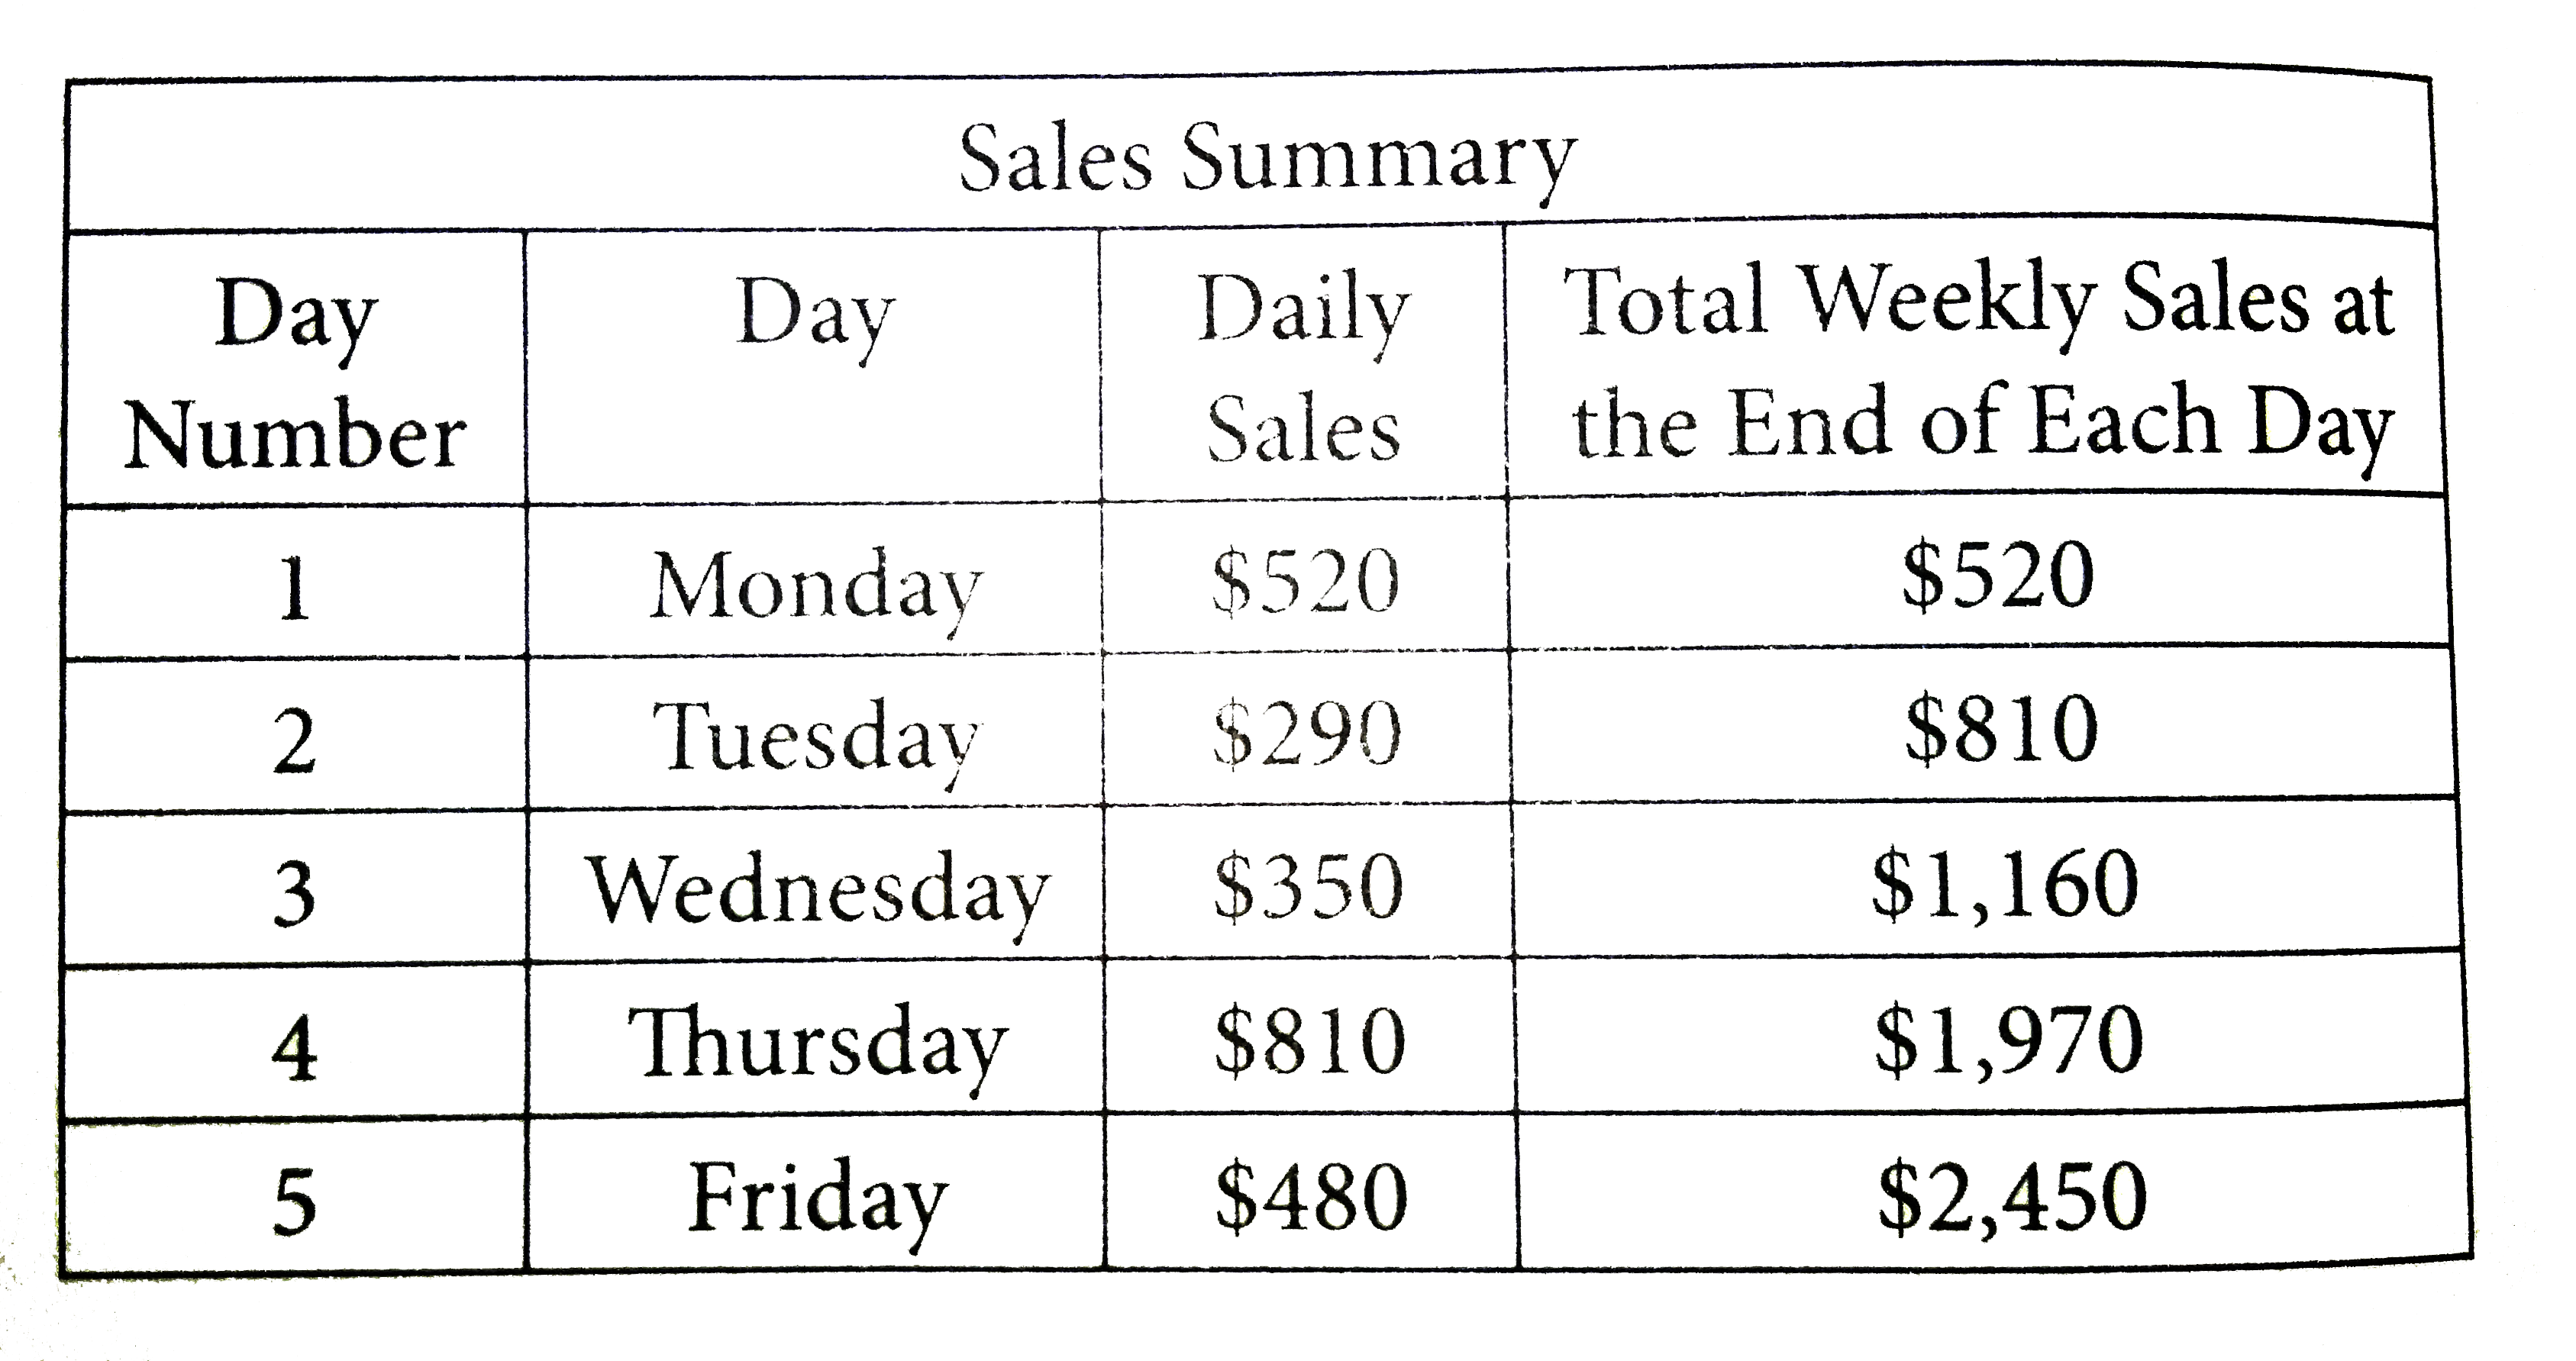
A salesperson recorded her sales during a particular 5-day work week, shown in the table above, in order to study her daily sales.
The salesperson wants to increase her averages sales per day by 20% in the following week. Given the information in the chart above, what should her daily sales average be for the following week?
The correct Answer is:588
Step by step video, text & image solution for A salesperson recorded her sales during a particular 5-day work week, shown in the table above, in order to study her daily sales. The salesperson wants to increase her averages sales per day by 20% in the following week. Given the information in the chart above, what should her daily sales average be for the following week? by Maths experts to help you in doubts & scoring excellent marks in Class 12 exams.
Updated on:21/07/2023Similar Questions
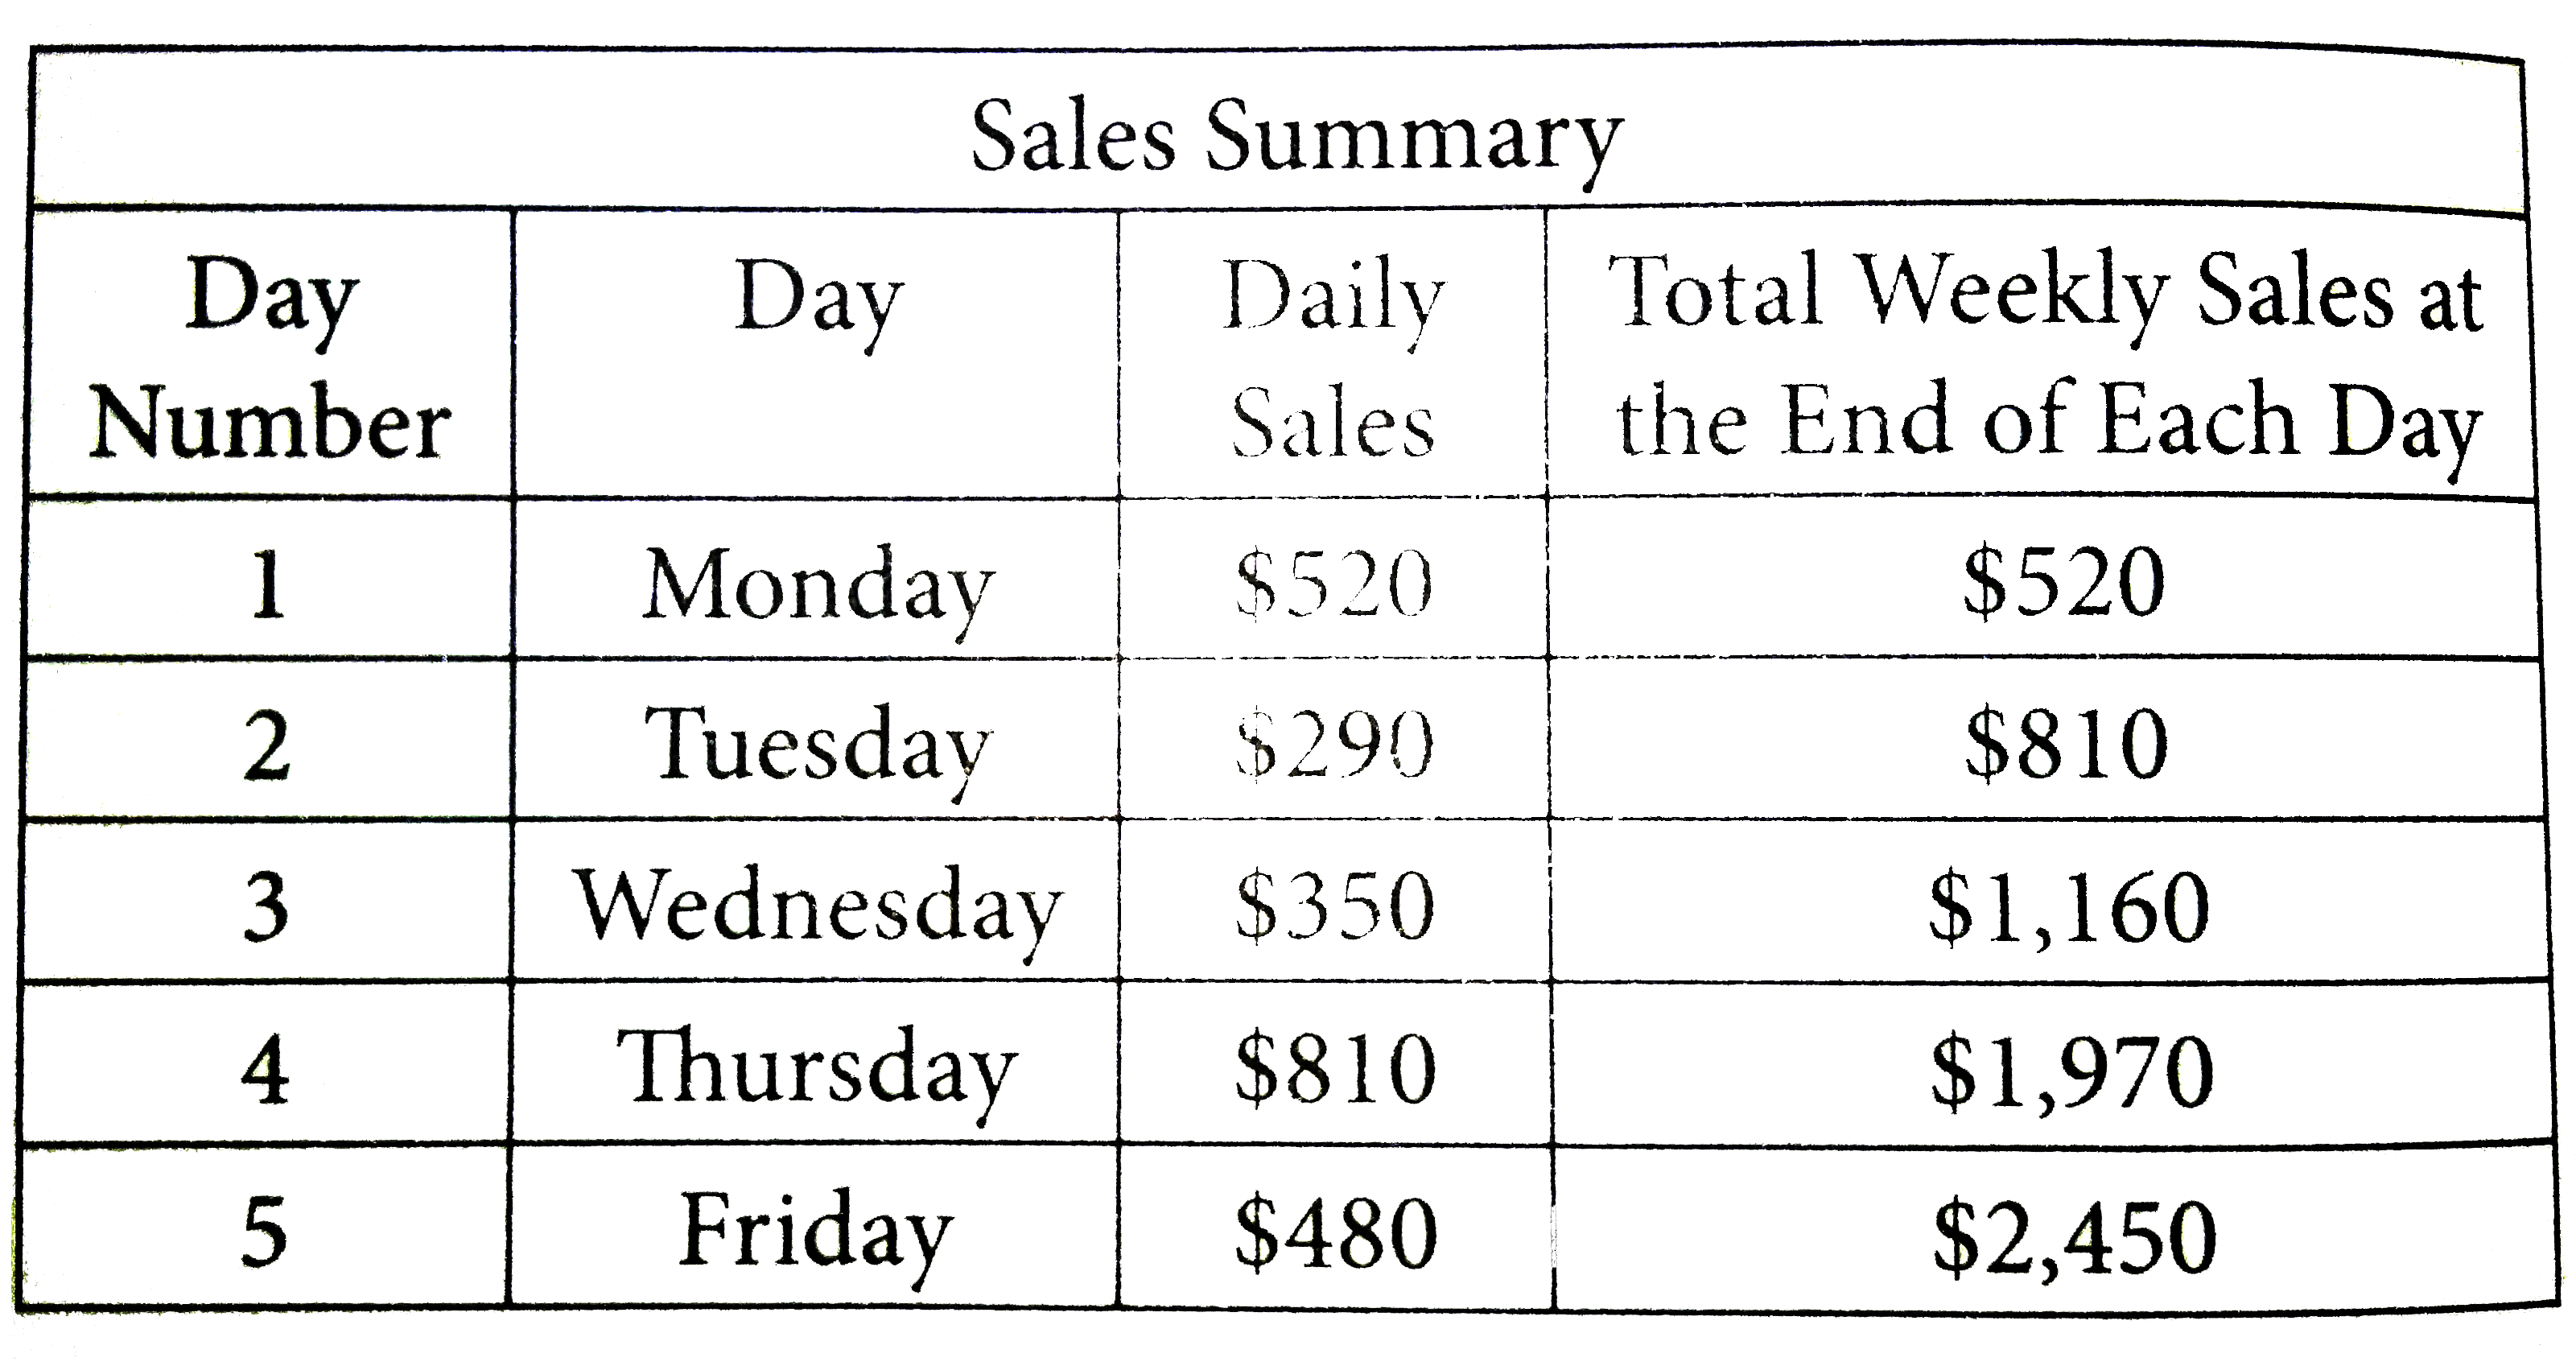
A salesperson recorded her sales during a particular 5-day work week, shown in the table above, in order to study her daily sales.
During her eight-hour shift on Wednesday, the salesperson sold items that had an average price of $8.10. To the nearest tenth of an item, what is the number of items she sold per hour on Wednesday?
View SolutionObserve the bar graph given below :
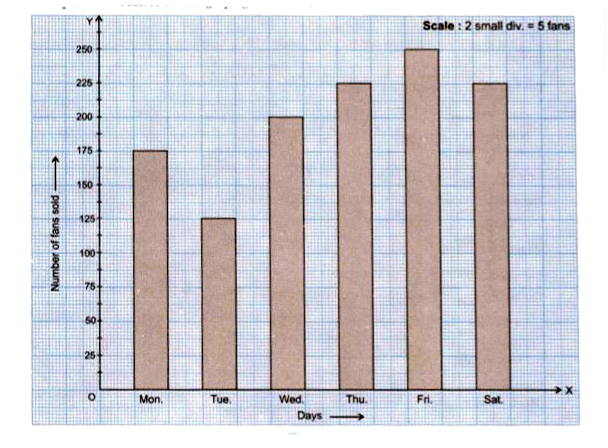
Read the bar graph carefully and answer the following questions :
What was the total sale during the week?
View Solution
Knowledge Check
The bottom of a ske slope is 6,500 feet above sea level,the top of the slope is 11,000 feet above sea level, and the slope drops 5 feet vertically for every 11 feet traveled in the horizontal direction. From the top of the slope, Kayla skis down at an average speed of 30 miles per hour. Which of the following function gives the best estimate for the distance above sea level, d, Kayla is t seconds after she begins her ski run where 6,500<d<11,000?
Ad(t)=11,000−(15011)tBd(t)=11,000−2.2tCd(t)=11,000−20tDd(t)=4,500−1,200t
Daily absence from a school during three weeks is recorded as follows :

Draw a graph , illustrating the above data . Calculate the 5 - days moving average and plot them on the same graph .
View SolutionRamkali required Rs 2500 after 12 weeks to send her daughter to school. She saved Rs100 in first week and increased her weekly savings by Rs 20 every week. Find whether she will be able to send her daughter to school after 12 weeks. What value is generated in the above situation?
View SolutionObserve the bar graph given below :
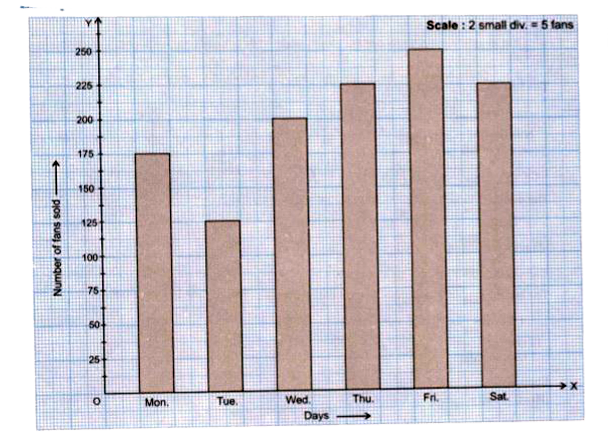
Read the bar graph carefully and answer the following questions :
On which day of the week was the sale maximum?
View SolutionA salesman wants to know the average number of units he sells per sales call. He checks his past sales records and comes up with the following probabilities:: Sales (in units): 0 1 2 3 4 5 Probability 0.15 0.20 0.10 0.05 0.30 0.20 . What is the average number of units he sells per sale call?
View SolutionQuestion 37 and 38 refer to the following information
The U.S. federal Government tracks the Consumer Price Index (CPI)- a comprehensive standard used to estimate the average price change for the typical goods and services purchased by consumers. This measure gives economics a useful way to estimate the rates of the inflation or deflation, which reflects the respective general increase or decrease of prices of goods and services in the economy. The accompanying tables summarizes the changes in the CPI for the years 2005 through 2014, which can be assumed to be the corresponding percent rates of inflation.
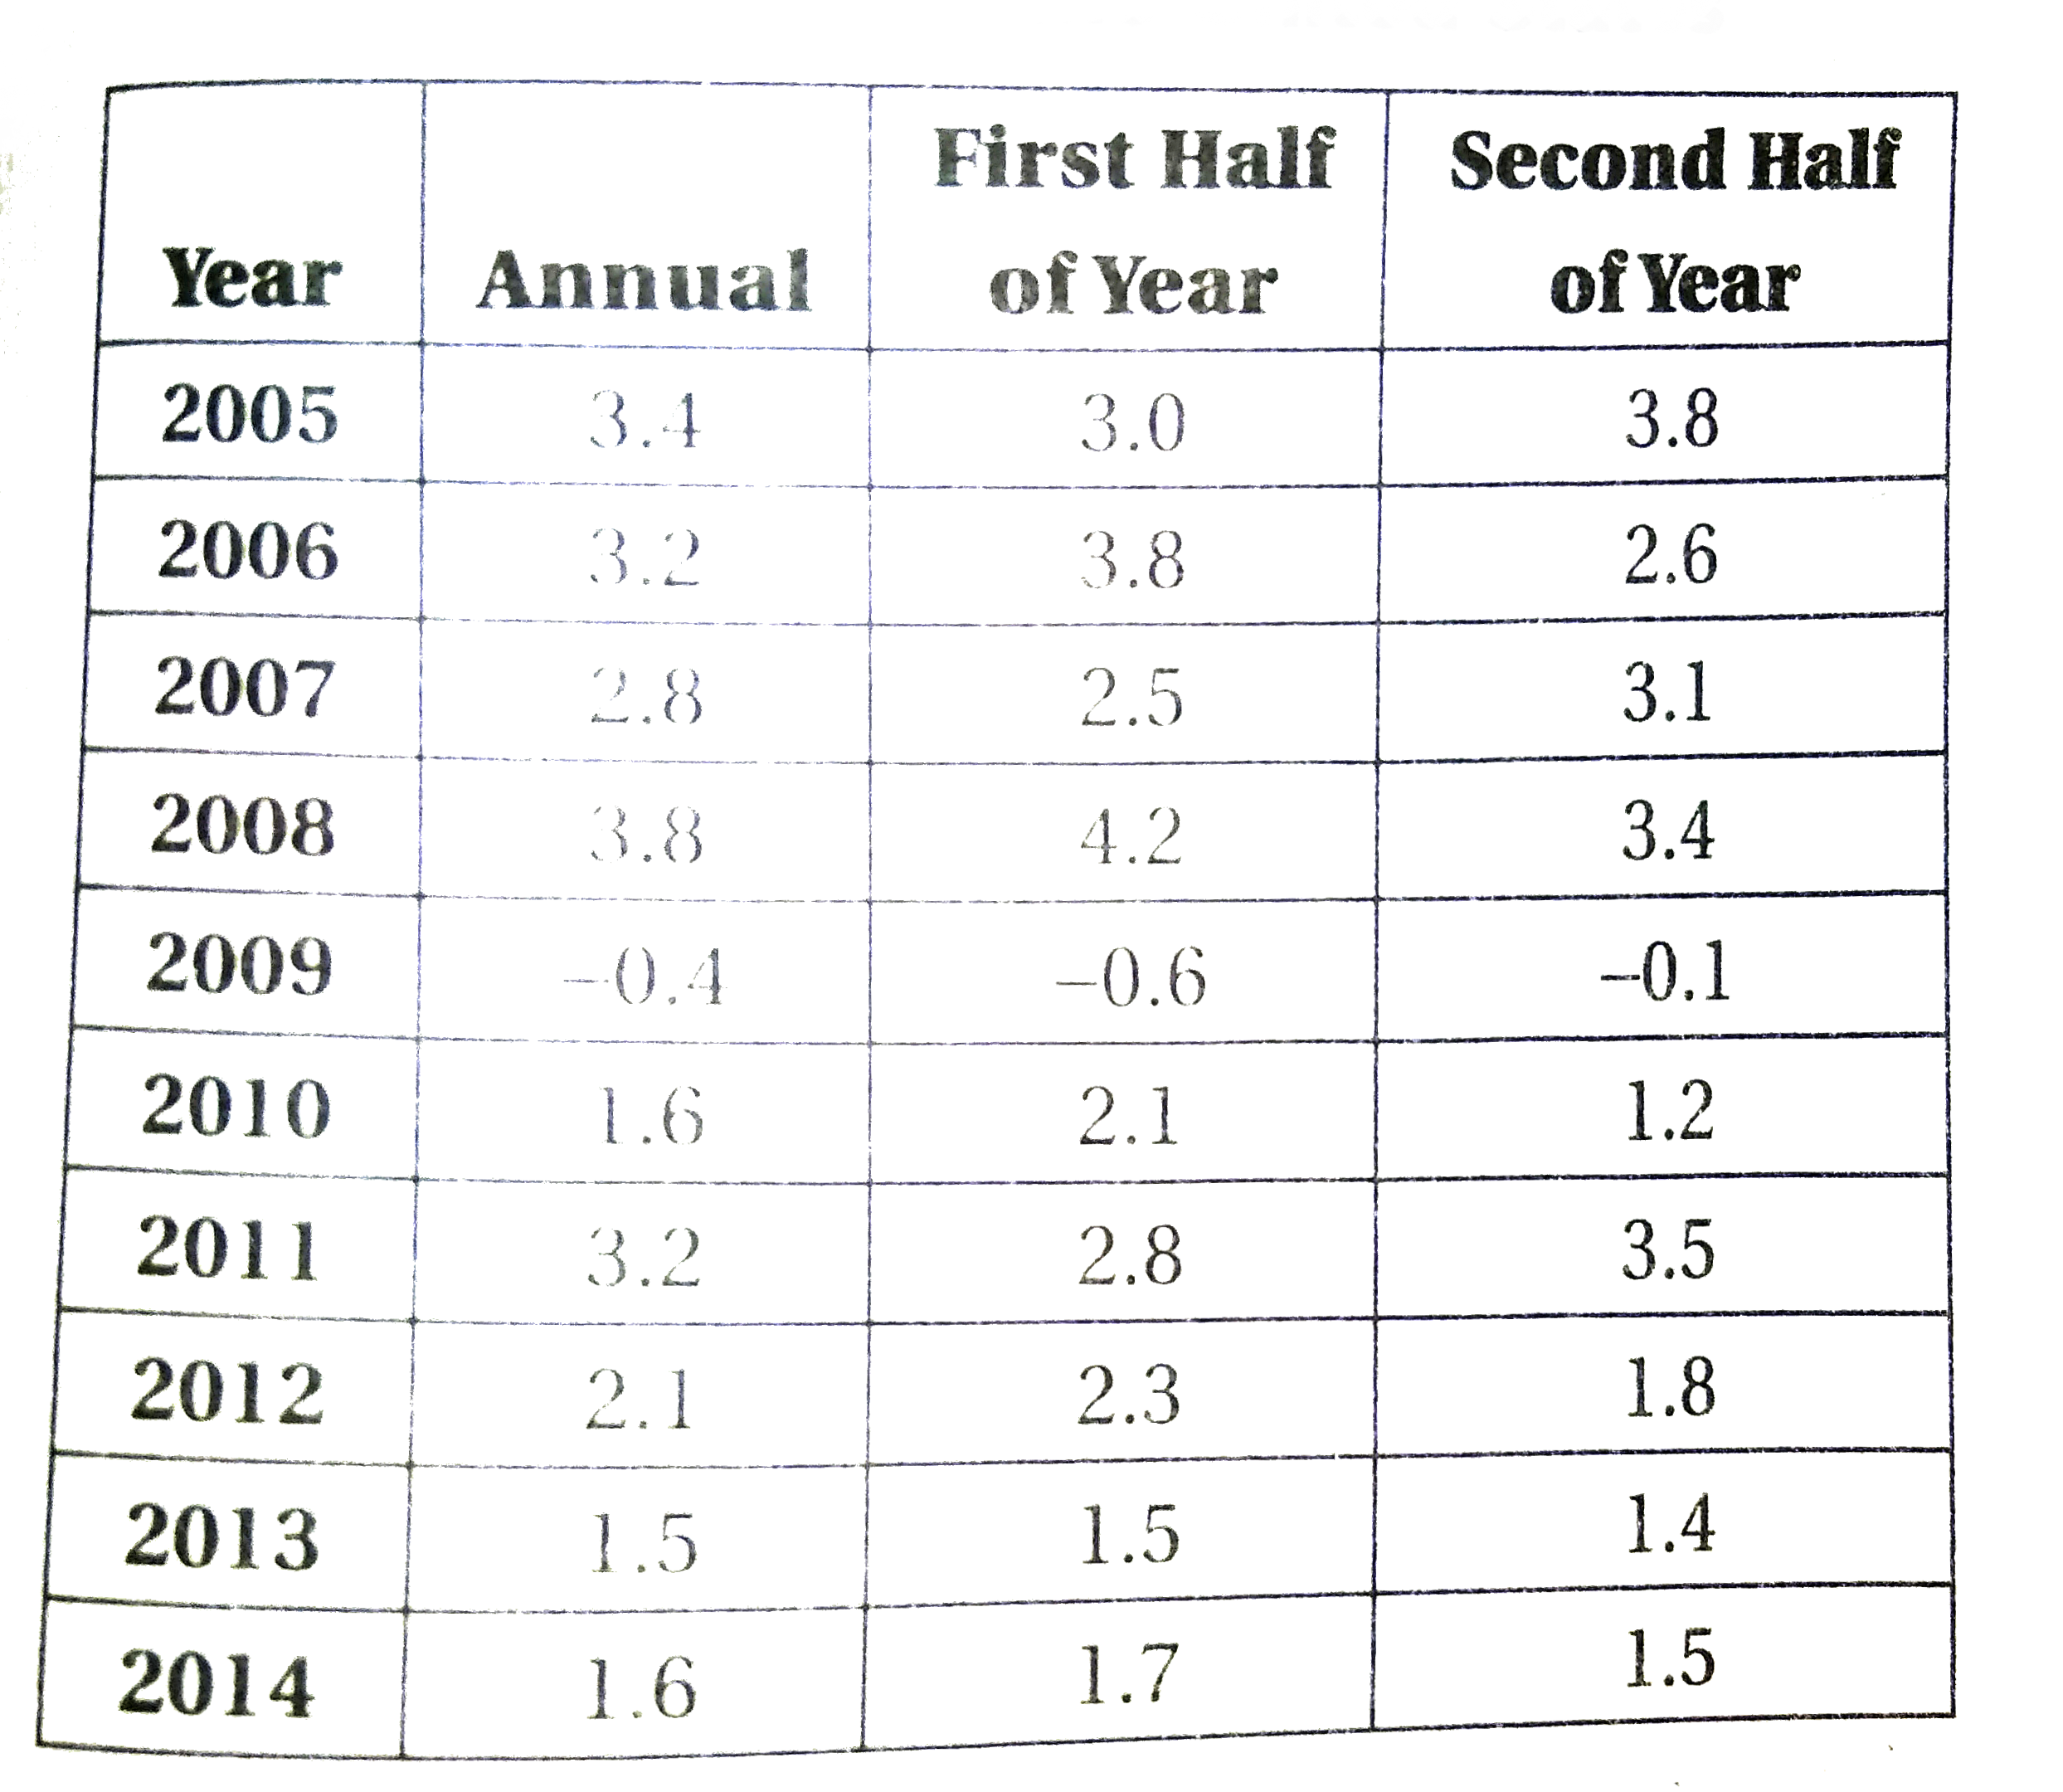
Q. An economist purchases a kitchen applience at the beginning of 2014 for $3,000. The sales person advises him that the only changes in prices for the applience since the beginning of 2012 have been due to inflation. Assuming that is the case, what would have been the purchase price for the applience at the beginning of 2012 correct to the nearest dollars?
View SolutionObserve the bar graph given below :
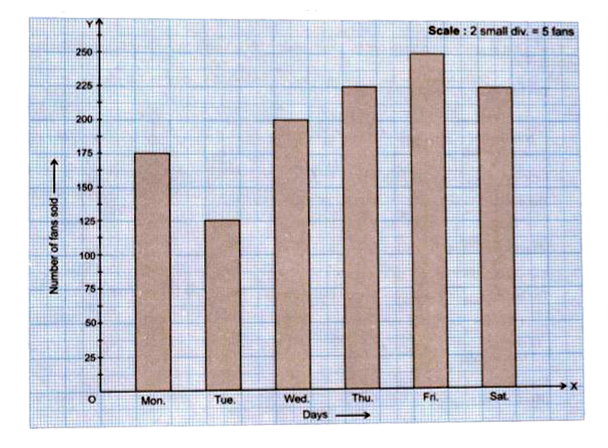
Read the bar graph carefully and answer the following questions :
On which day of the week there was maximum increase in sale compared to the previous day?
View SolutionThe given bar graph shows the number of identical articles sold by 5 different stores A, B, C, D and E during a particular month.
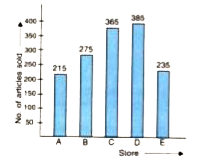
Study the bar graph and answer the following questions :
(i) Which store sold the largest number of articles ?
(ii) By what per cent is the sale of store D more than that of store B ?
(iii) Find the ratio of the total sale of the two highest selling stores to the total sale of the two least selling stores.
(iv) By how much must store E increase its sale to catch up with its nearest rival store ?
View Solution
