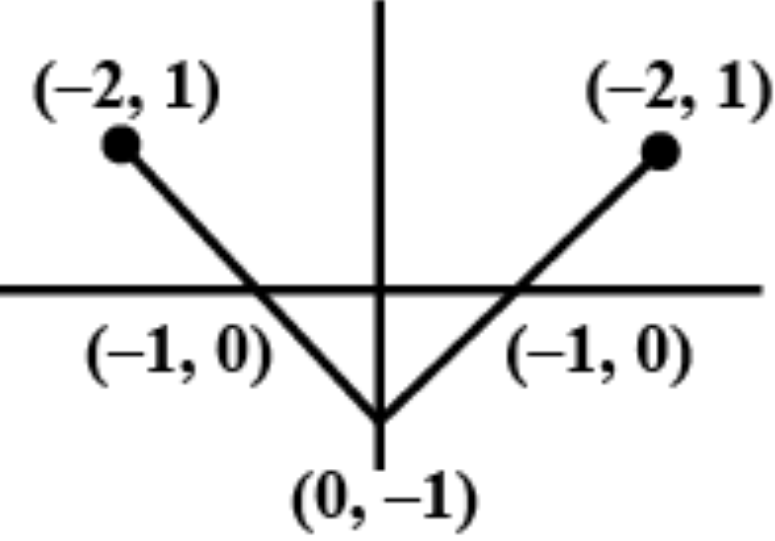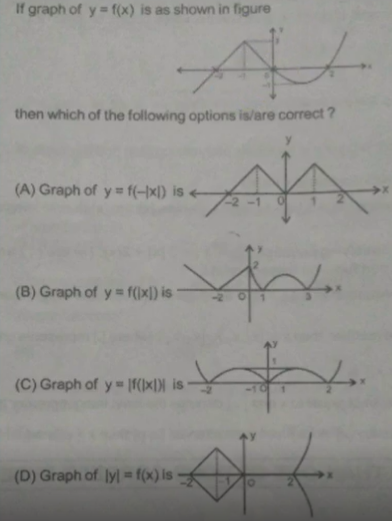
The graph y=f(x), shown above models the performance of a certain crop, where x is the nutrients subtracted or added to the soil and y is the gain or loss of pieces of fruit added to the total harvest. A more powerful fertilizer that is used causes the graph y=f(x) to be reflected over the line y=x. which of the following best describes the behaviour of the crop with the new fertilizer?
For every three nutrients added to the soil, the crop loses two additional fruits for the total harvest.
For every two nutrients added to the soil , the crop loses two additional fruits for the total harvest.
For every three nutrients added to the soil, the crop adds two additional fruits to the total harvest.
For every two nutrients added to the soil, the crop adds three additional fruits to the total harvest.
The correct Answer is:D
Topper's Solved these Questions
Similar Questions
Knowledge Check
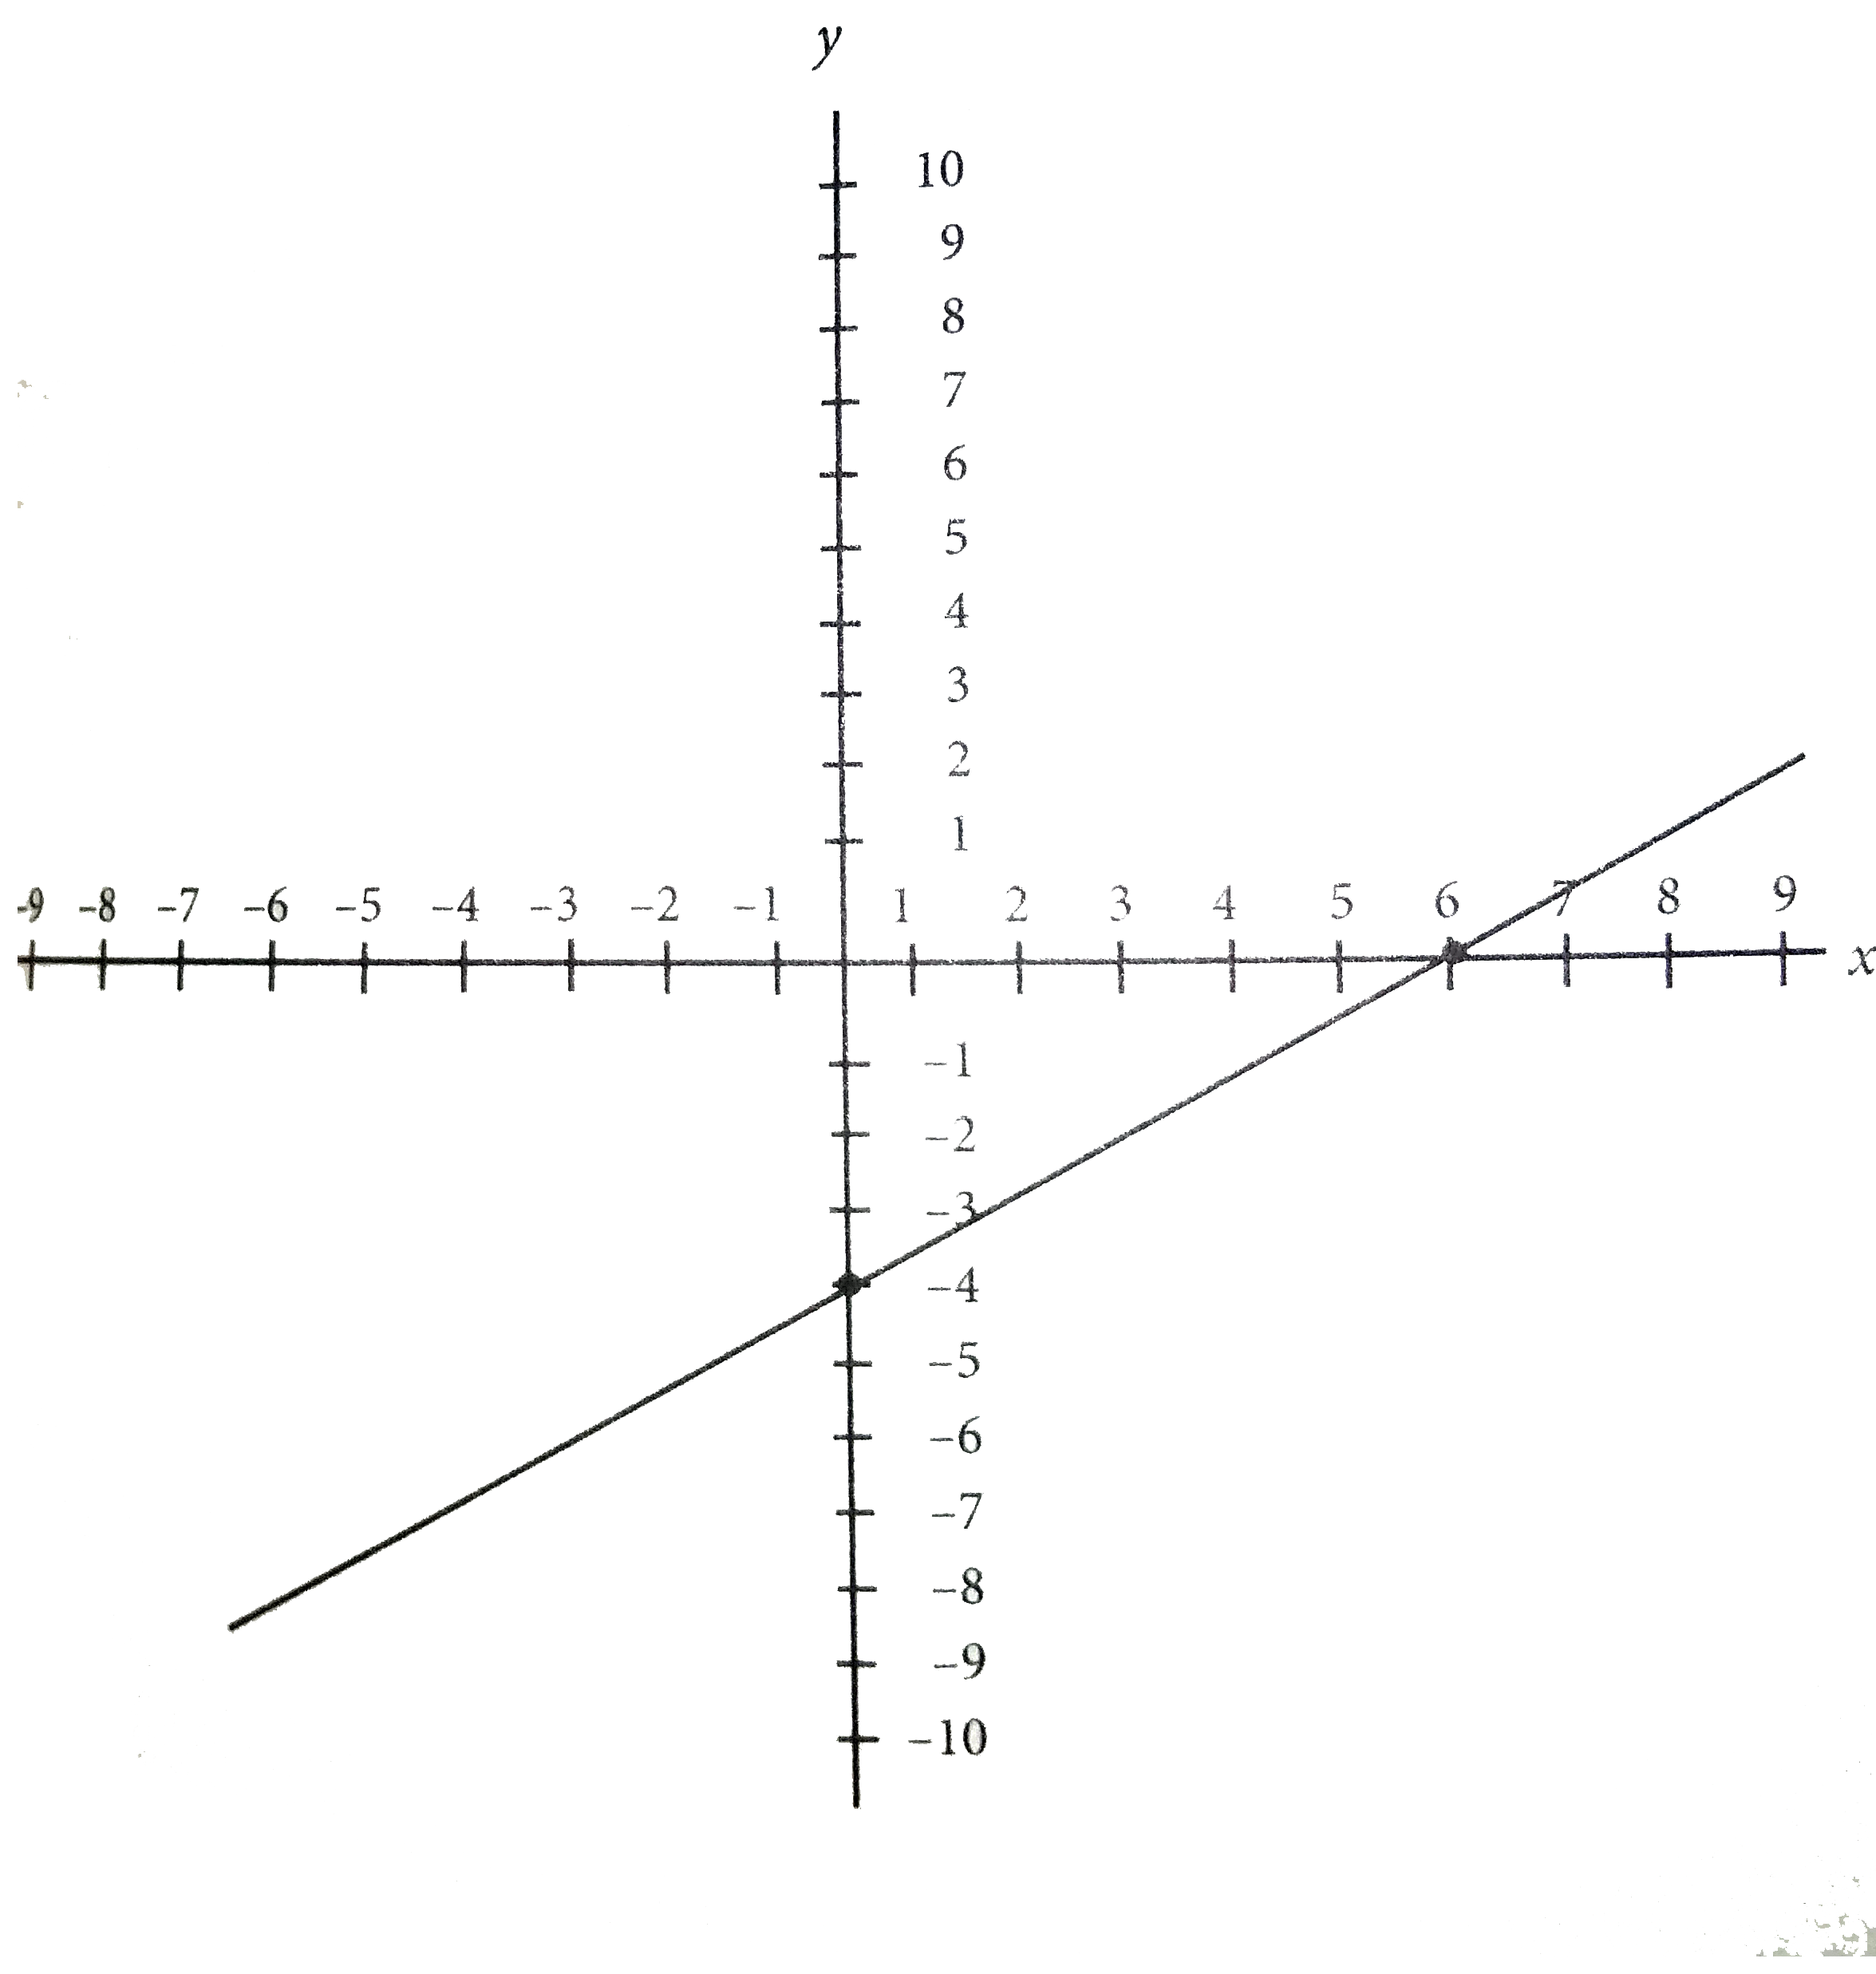
In the figure above, of y=f(x) is shown. Which of the following could be the equation of f(x)?Af(x)=−35x+3Bf(x)=−35x−3Cf(x)=35x−3Df(x)=35x+3The graph of y=f(x) is shown in the standard (x,y) coordinate plane below with points V,W,X,Y,and Z labeled .
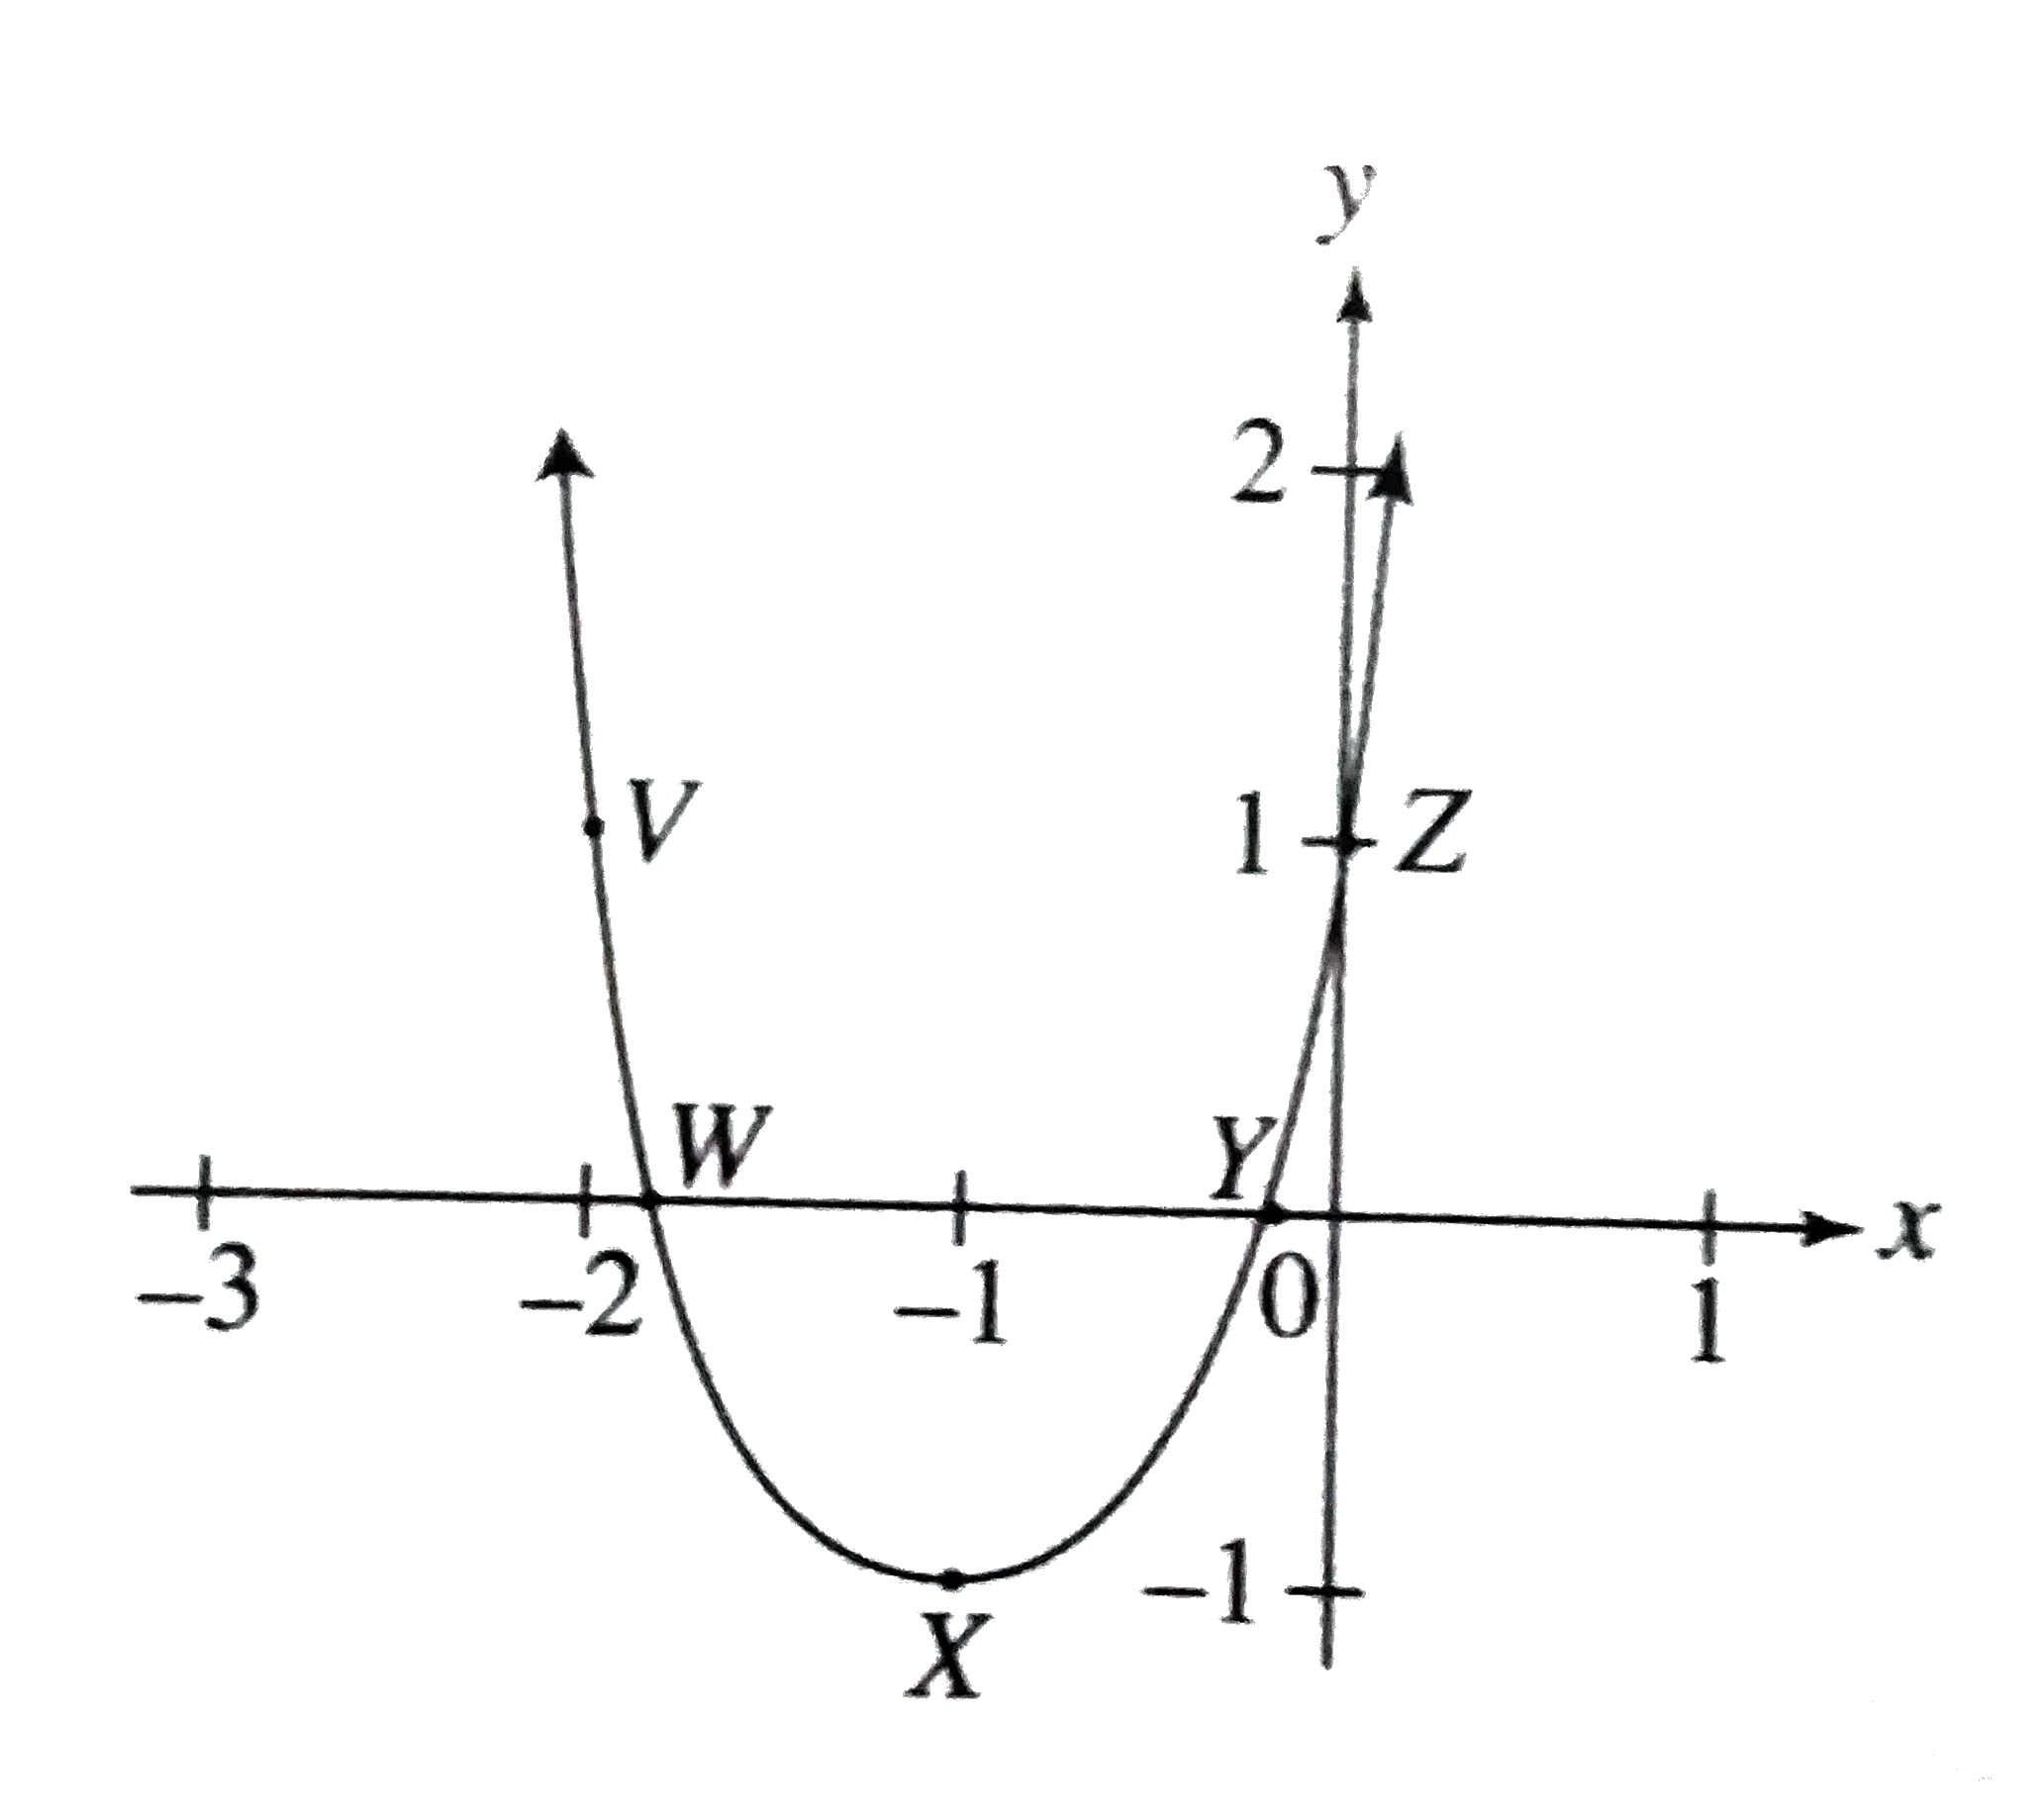
If y=f(x) is to be reflected across the line y=x , which of the following graphs represents the result?A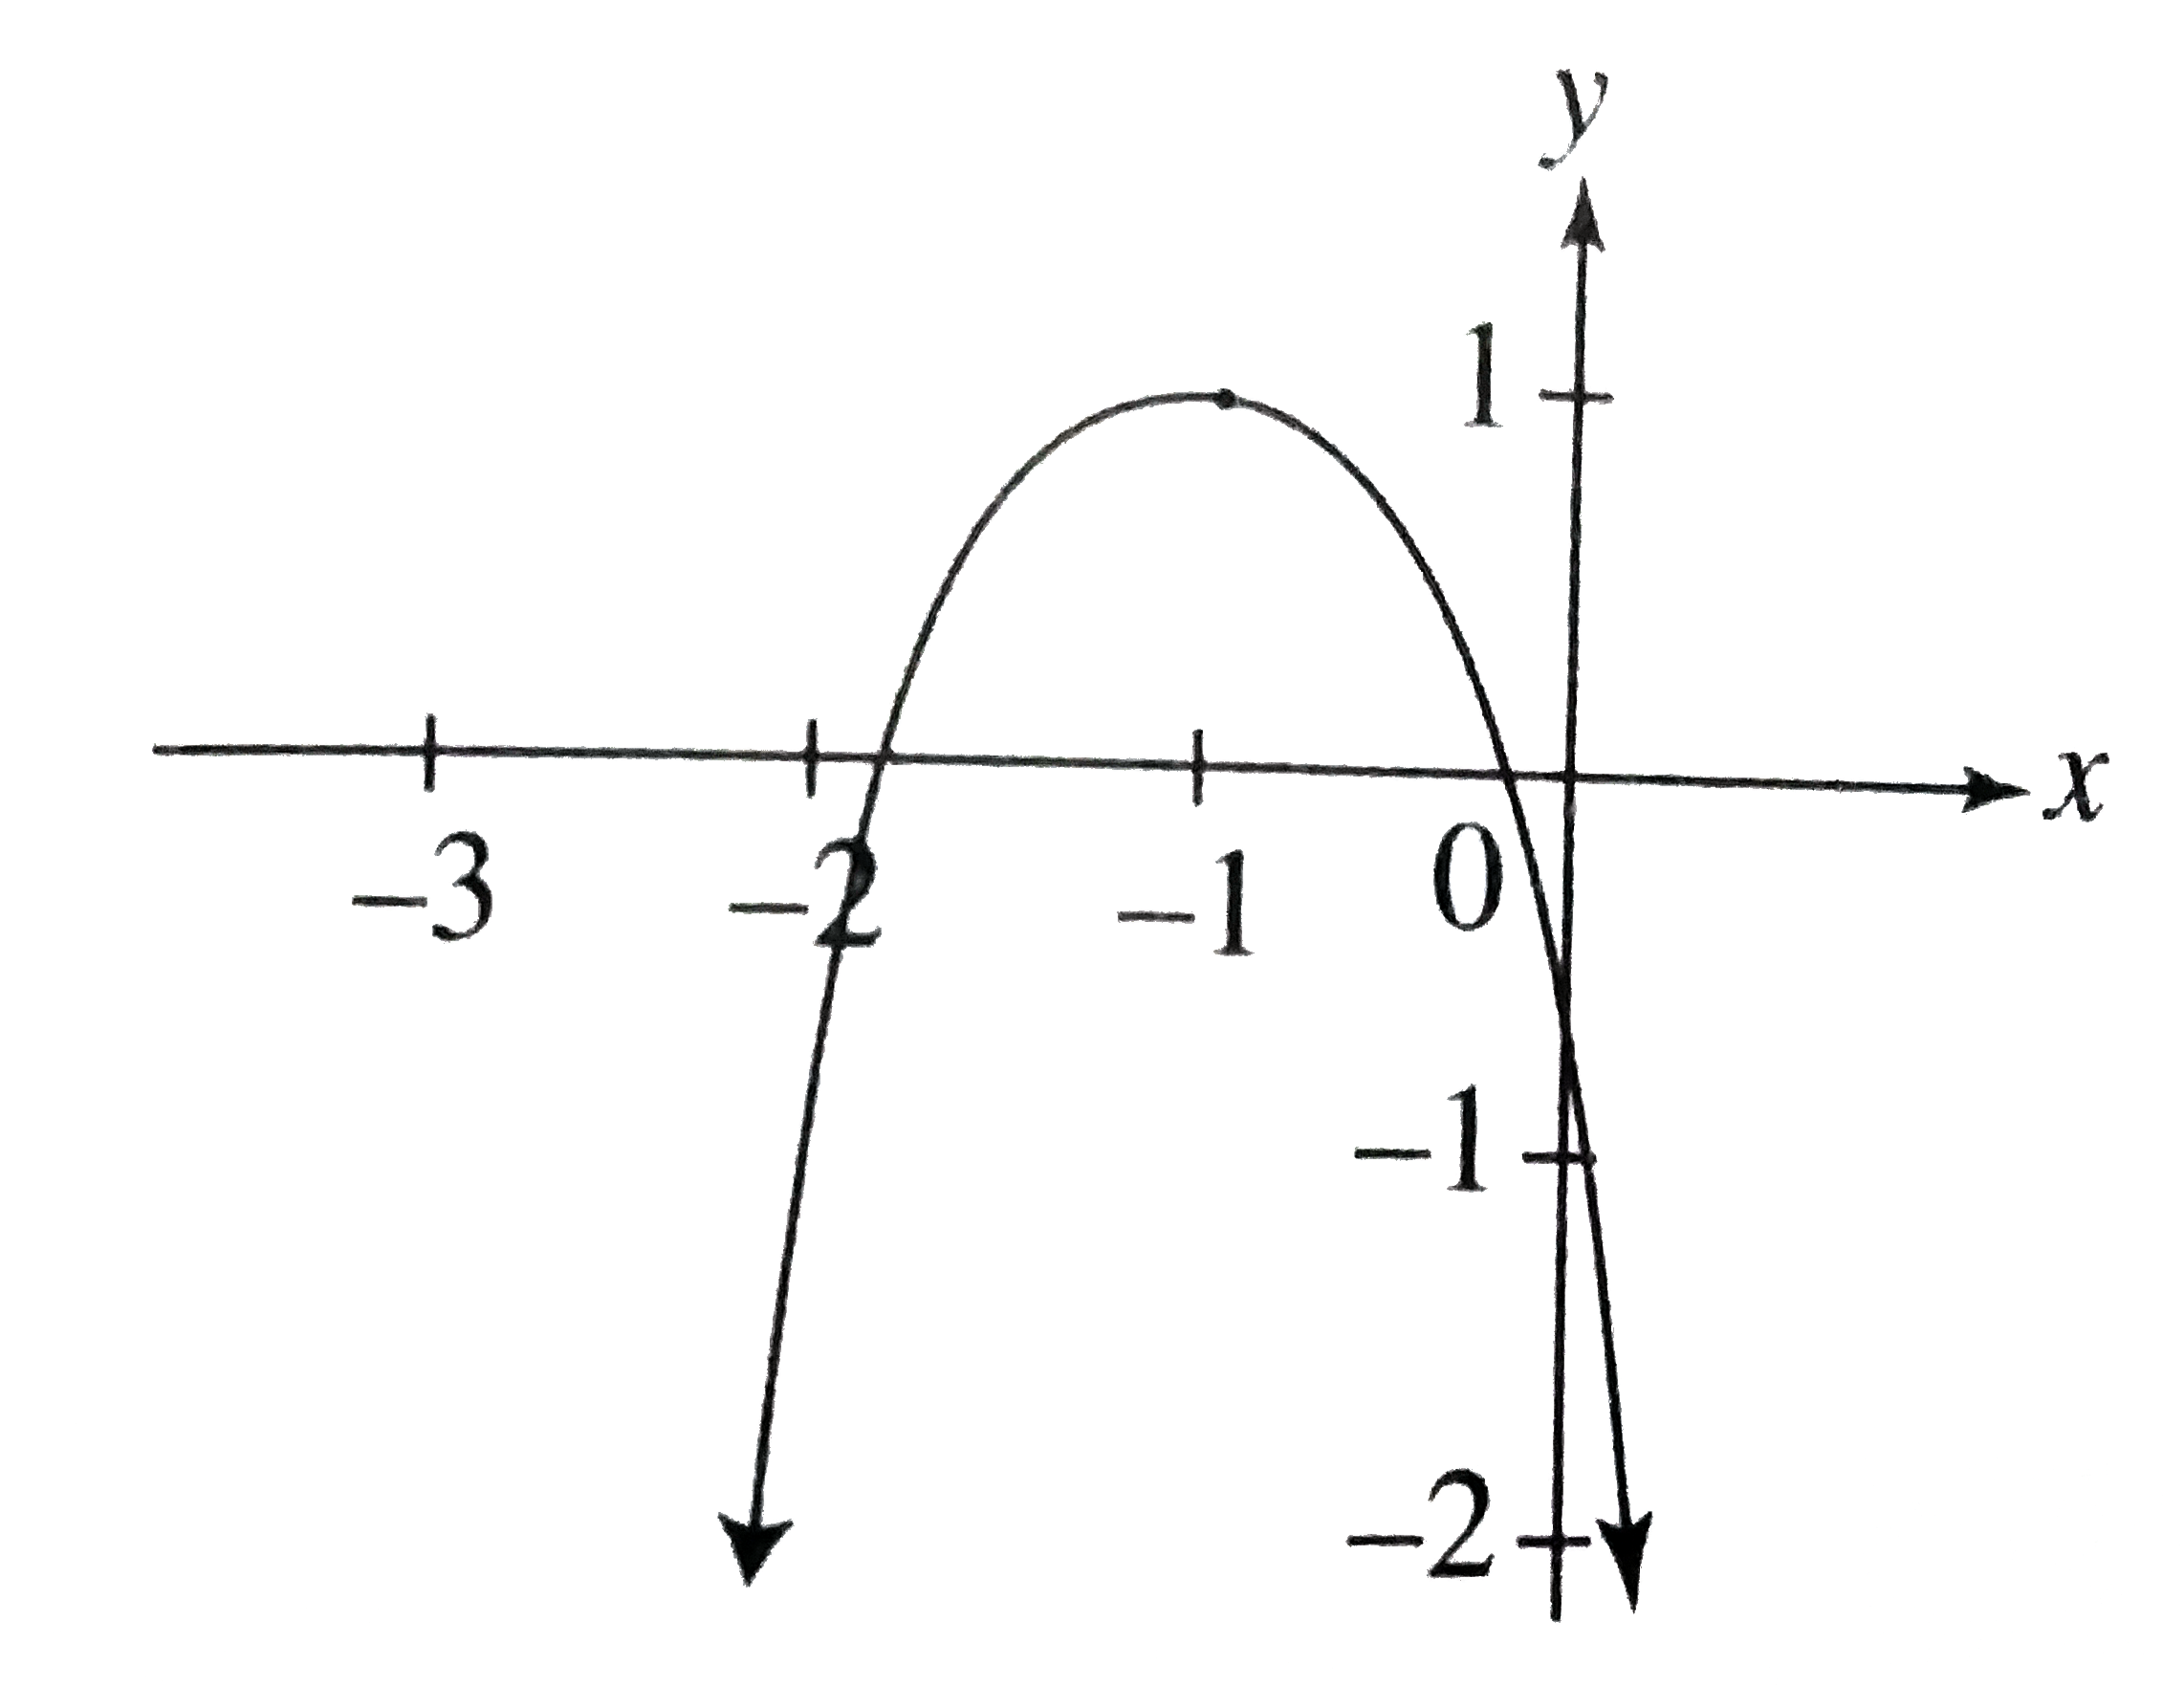 B
B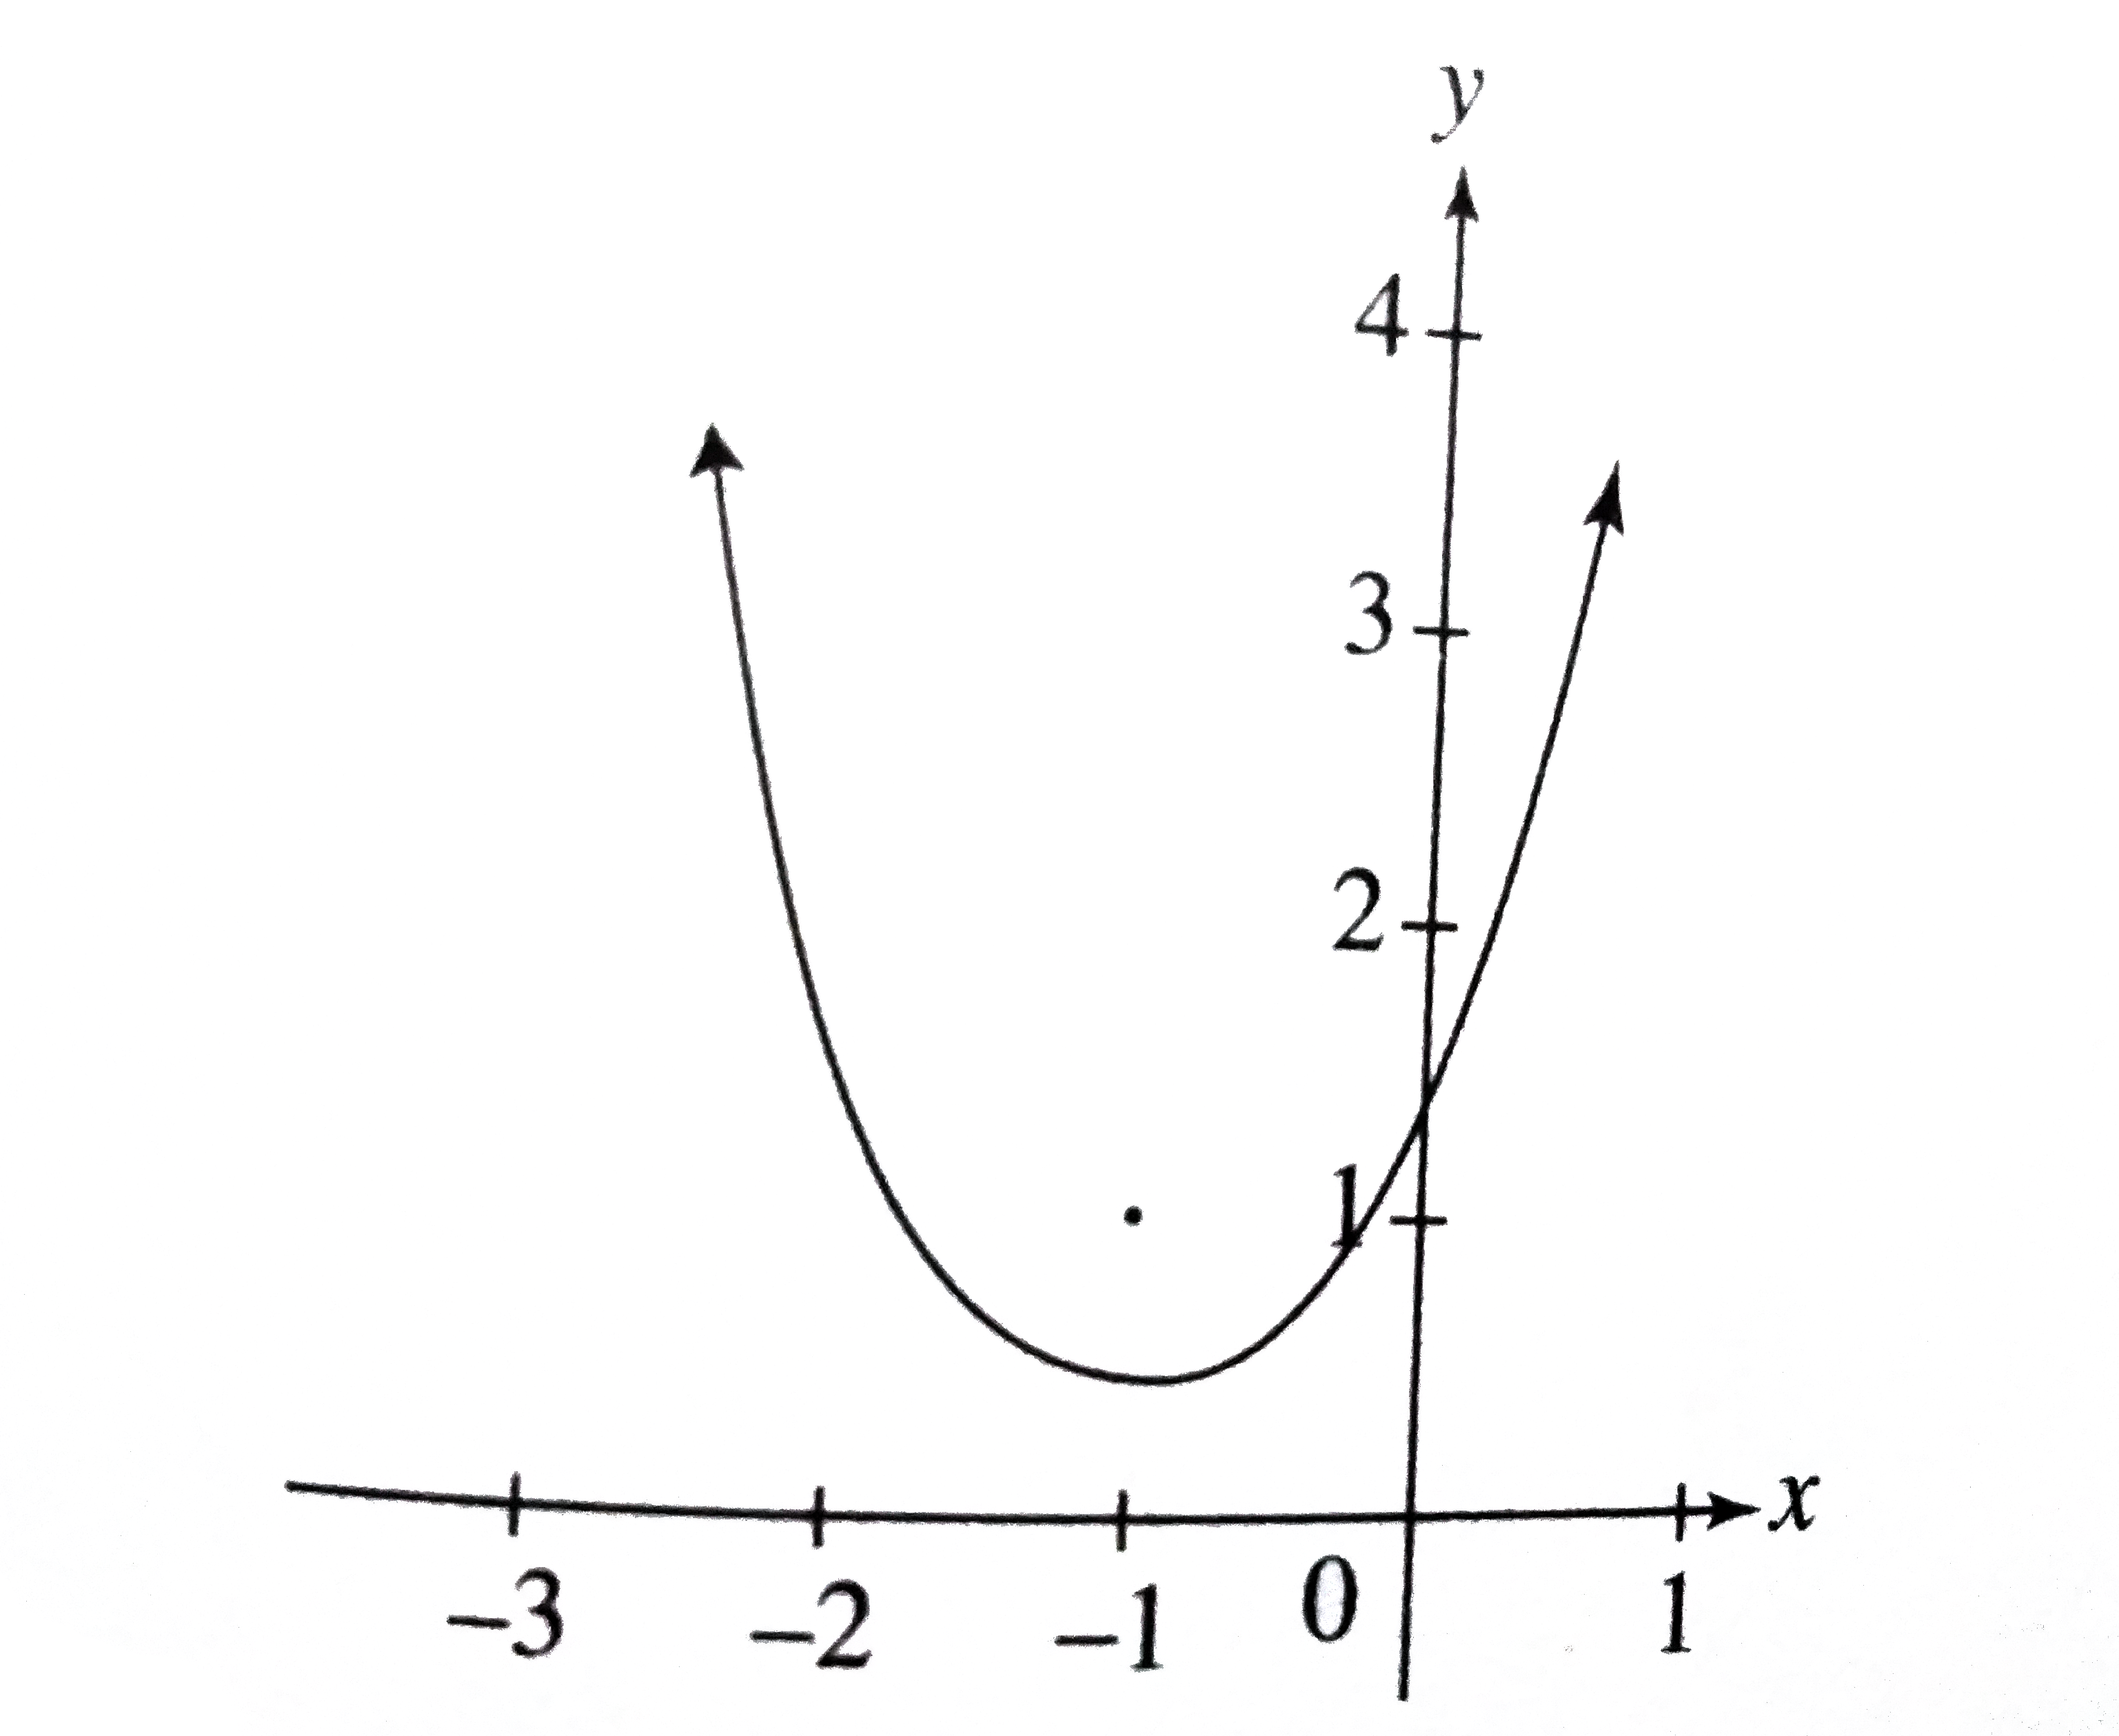 C
C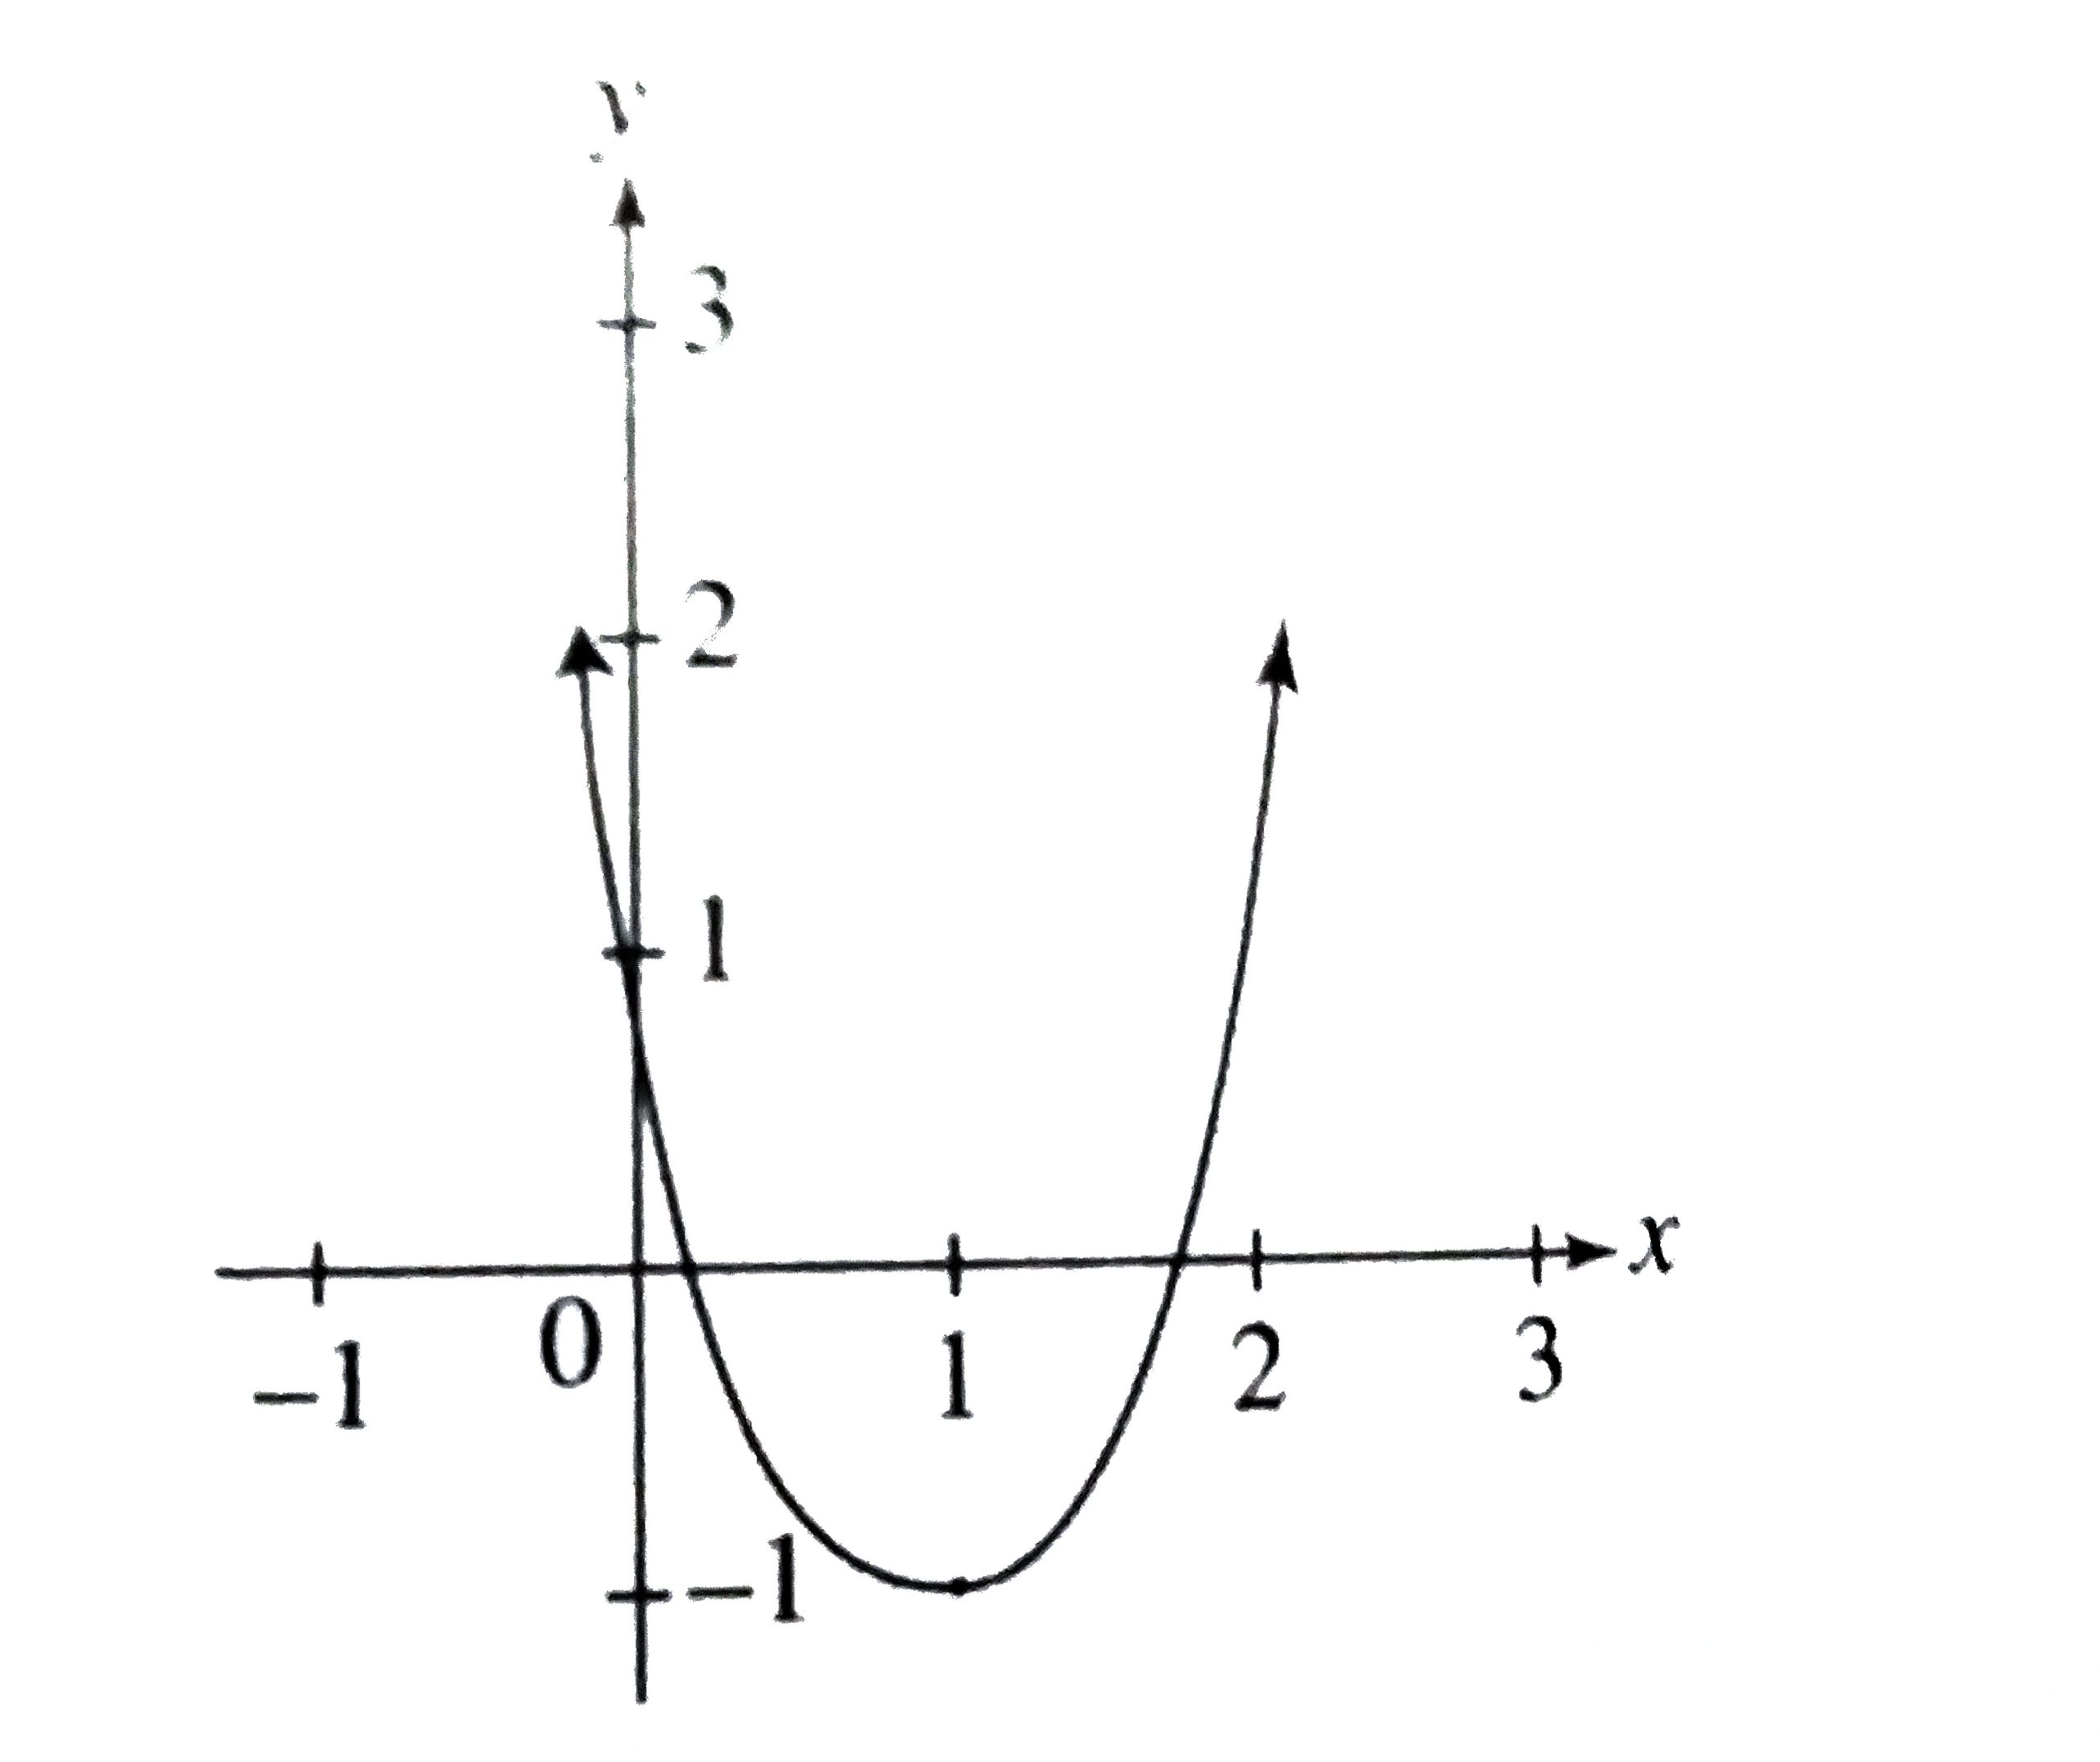 D
D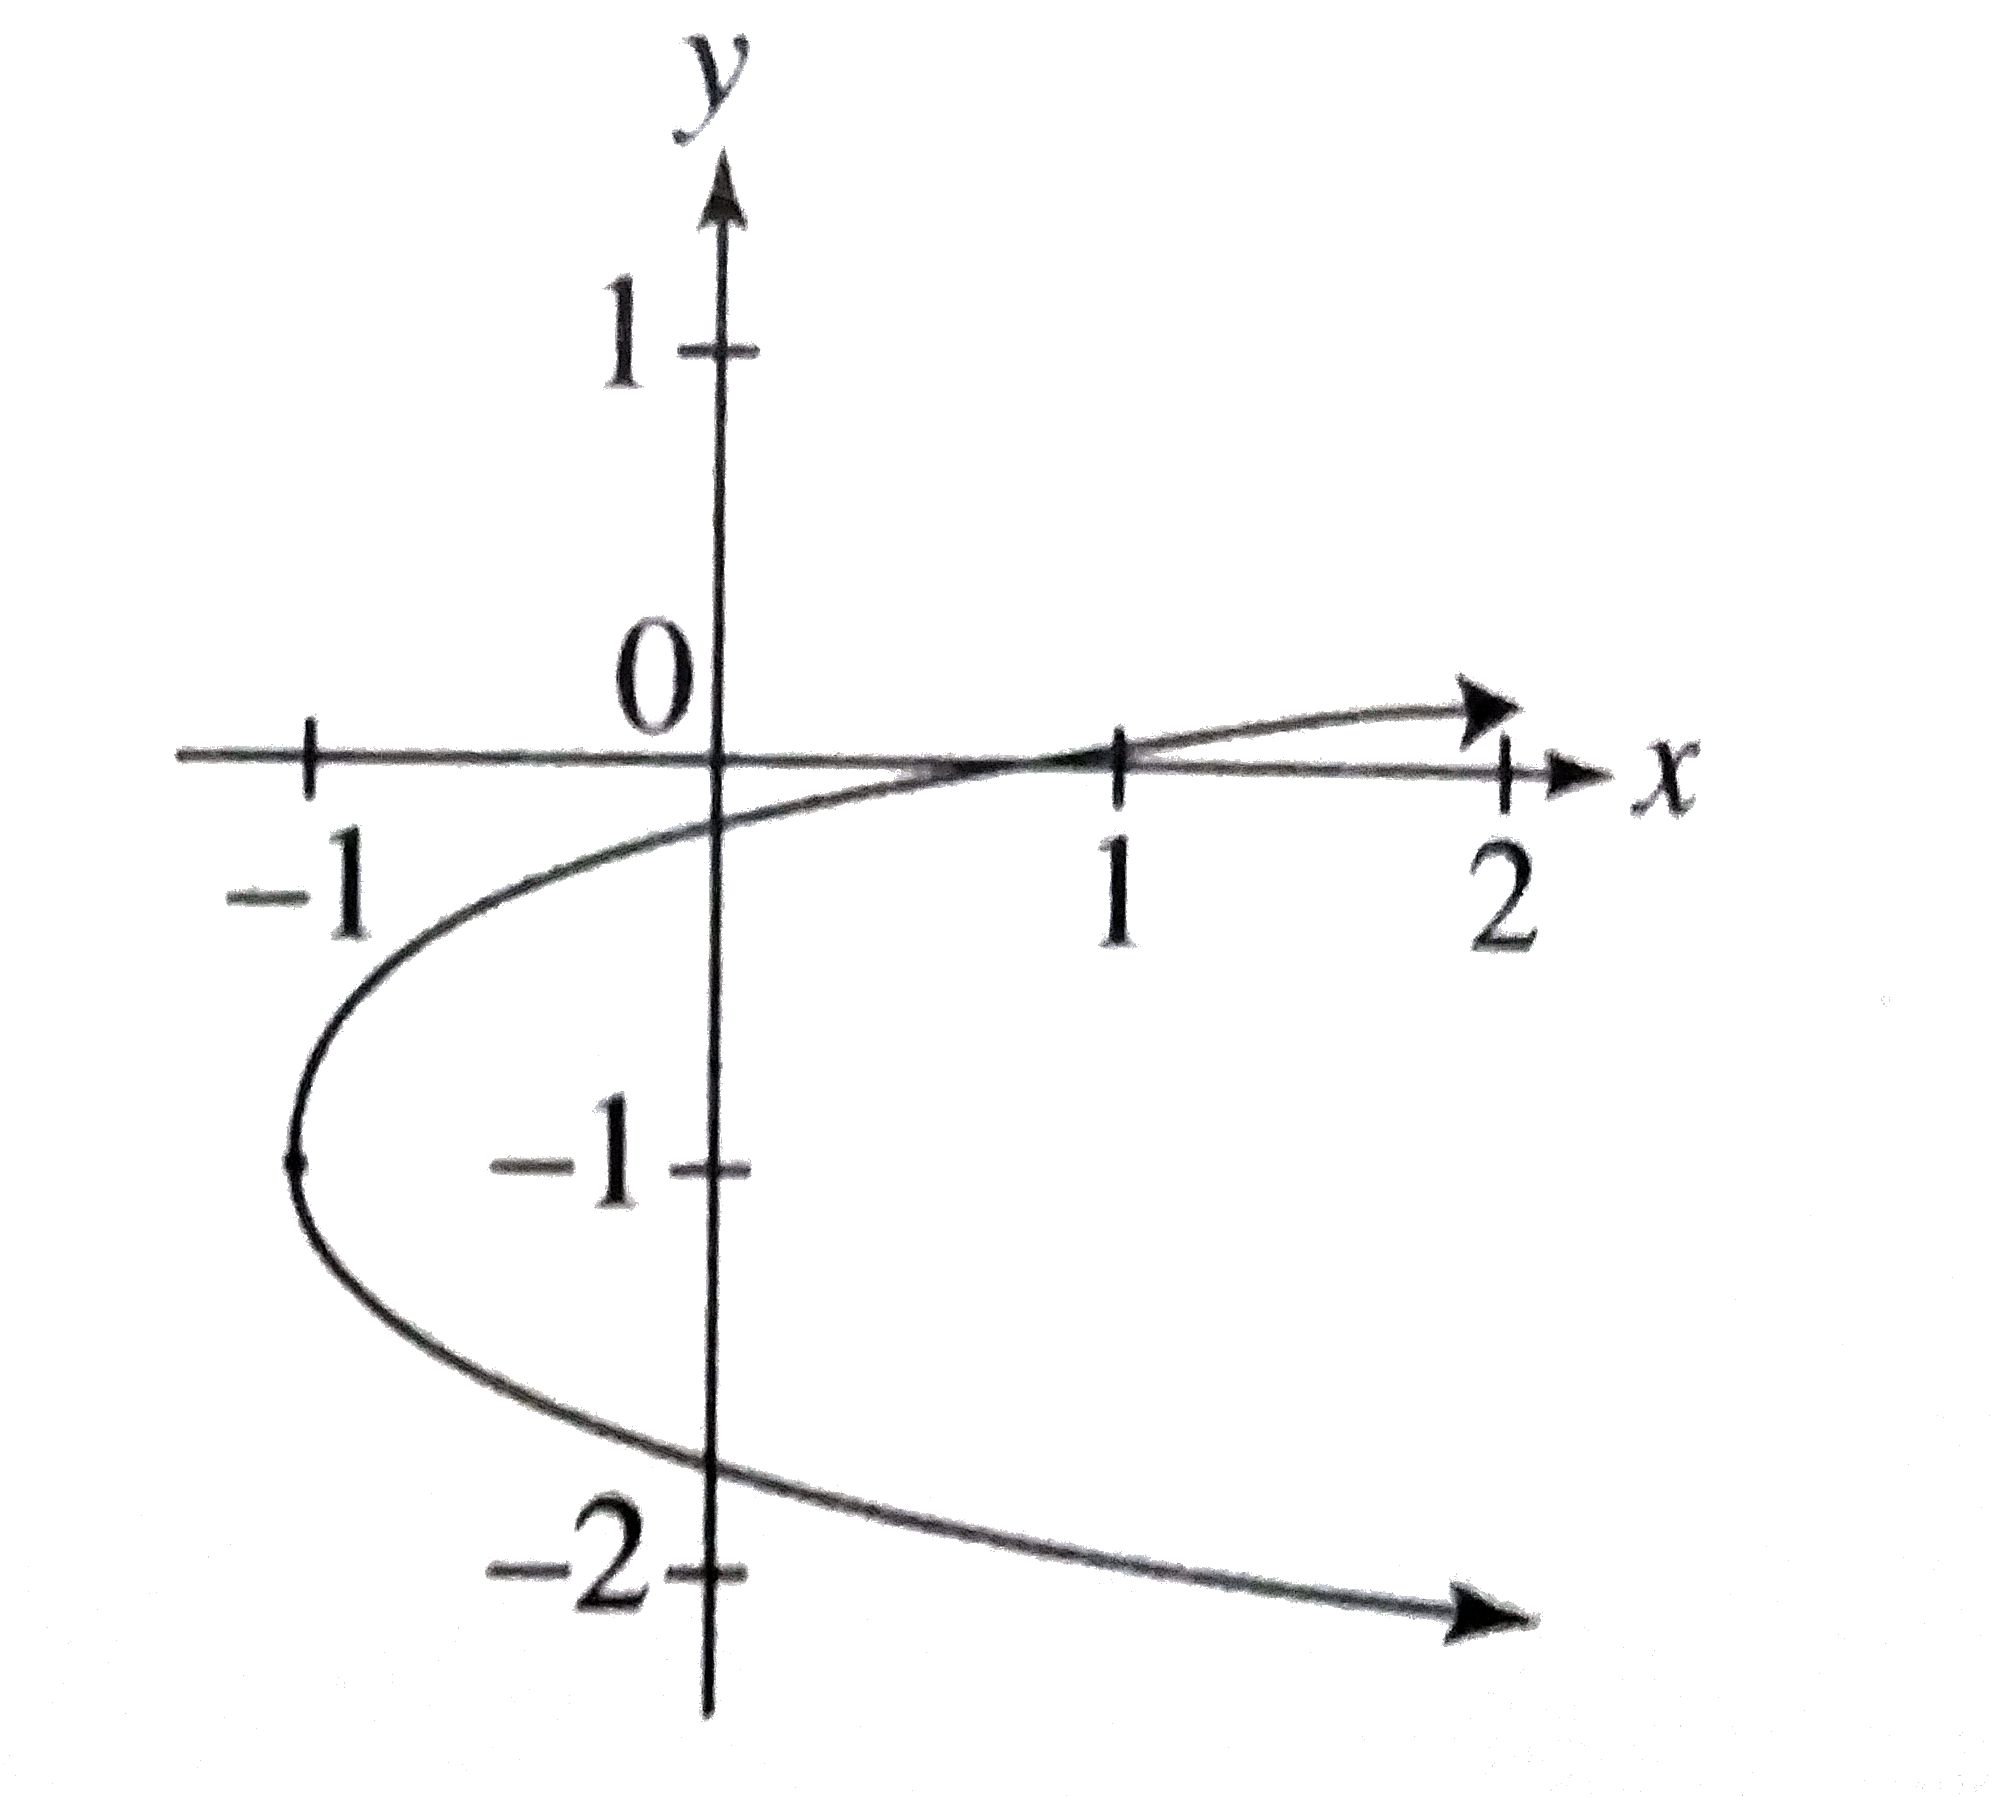
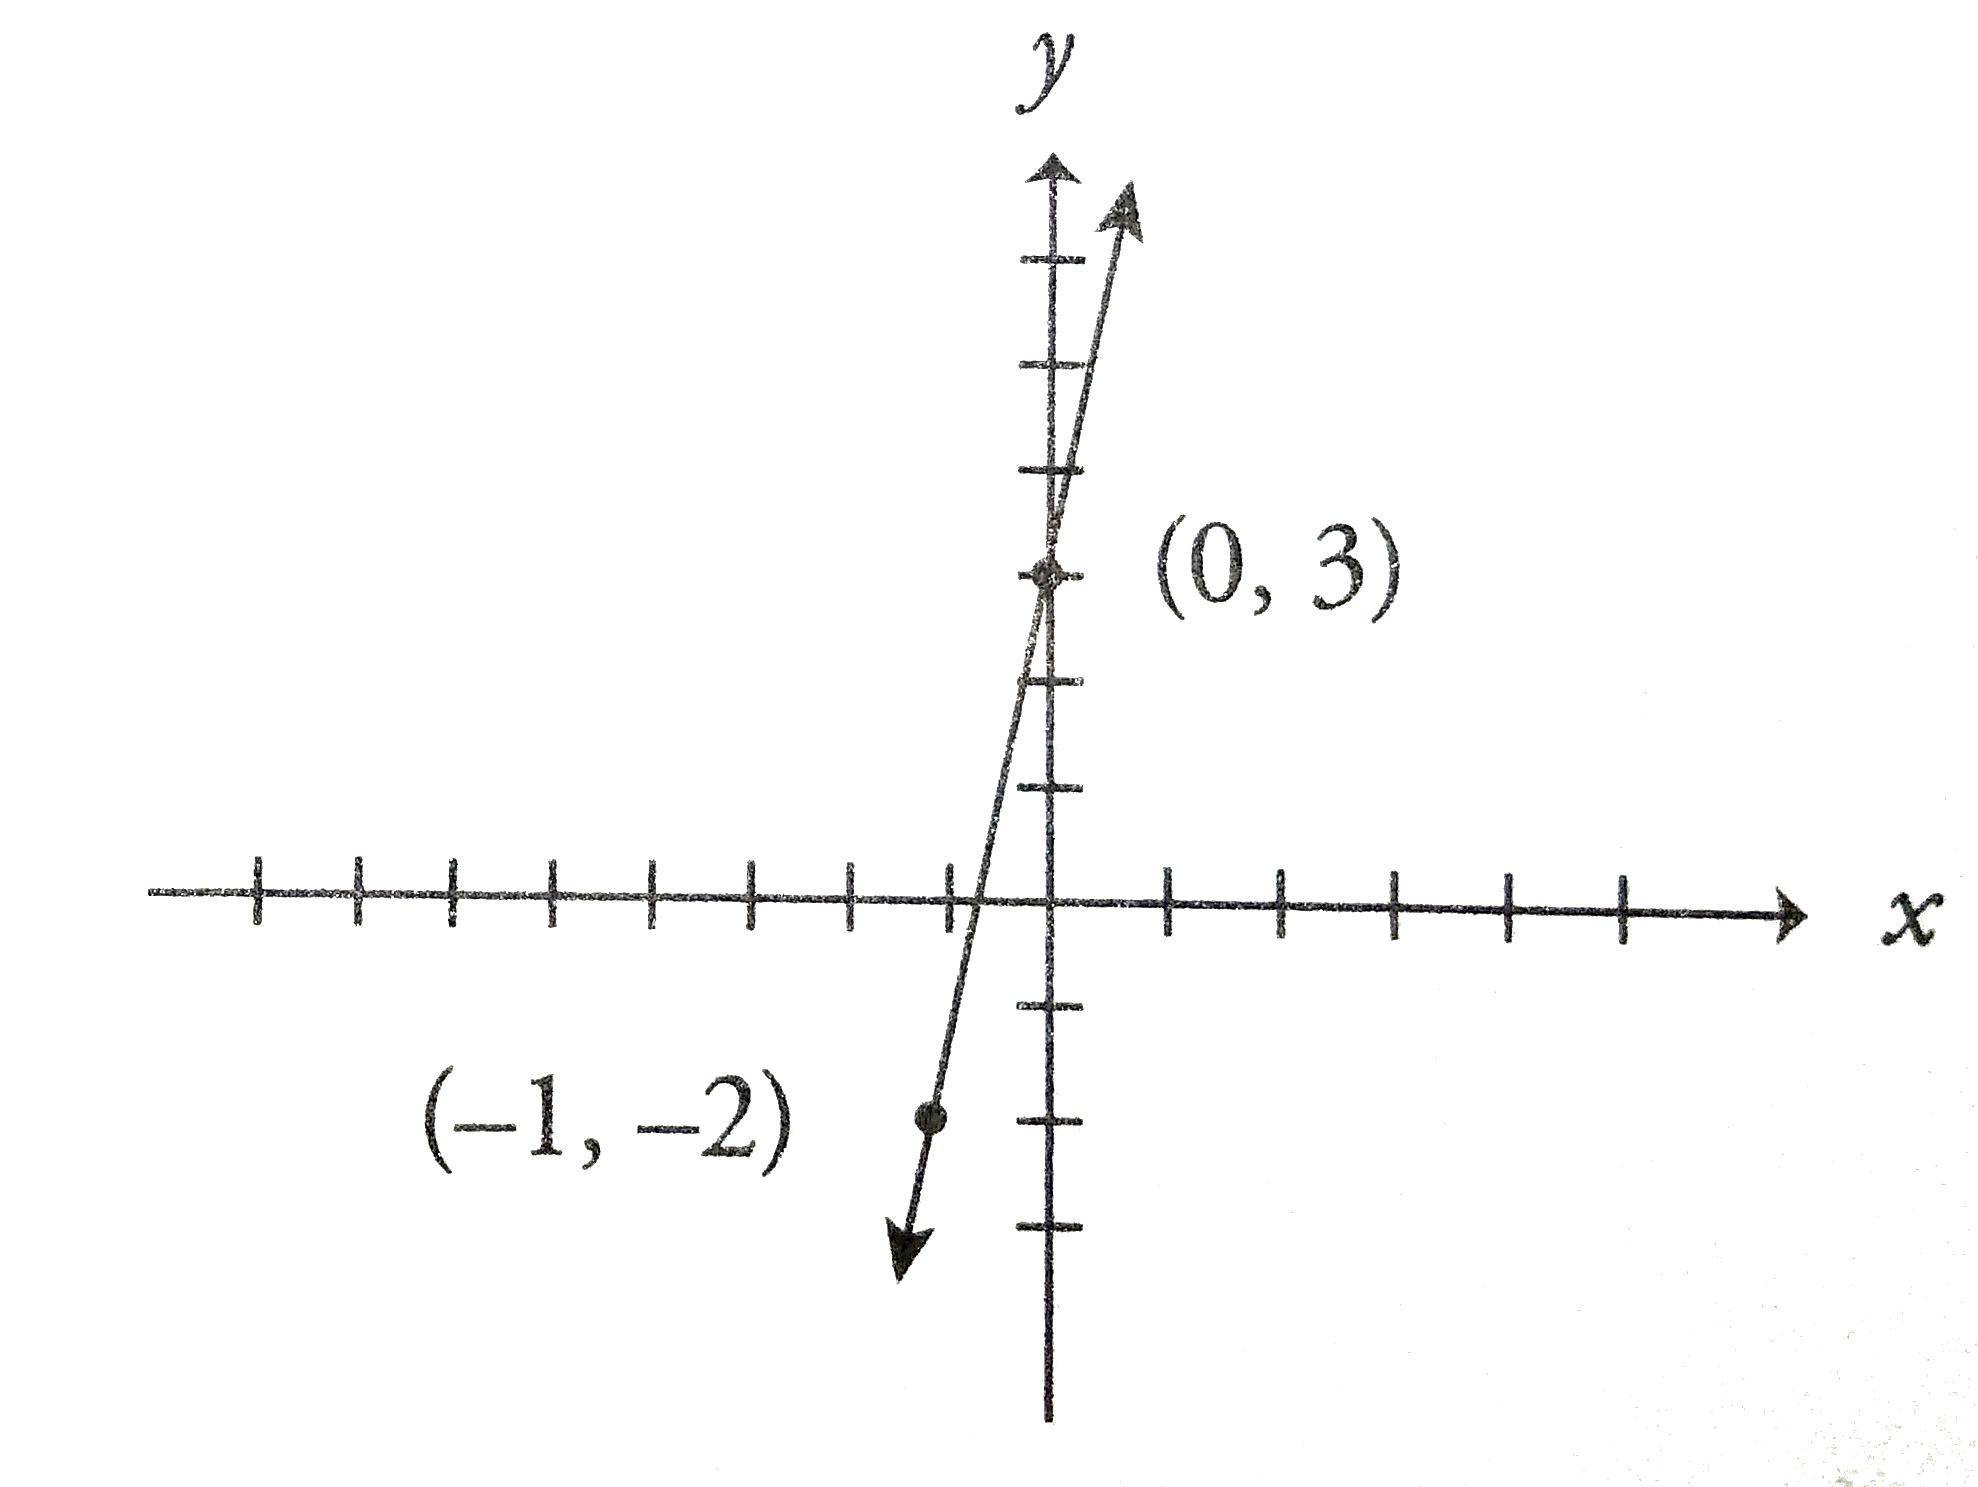
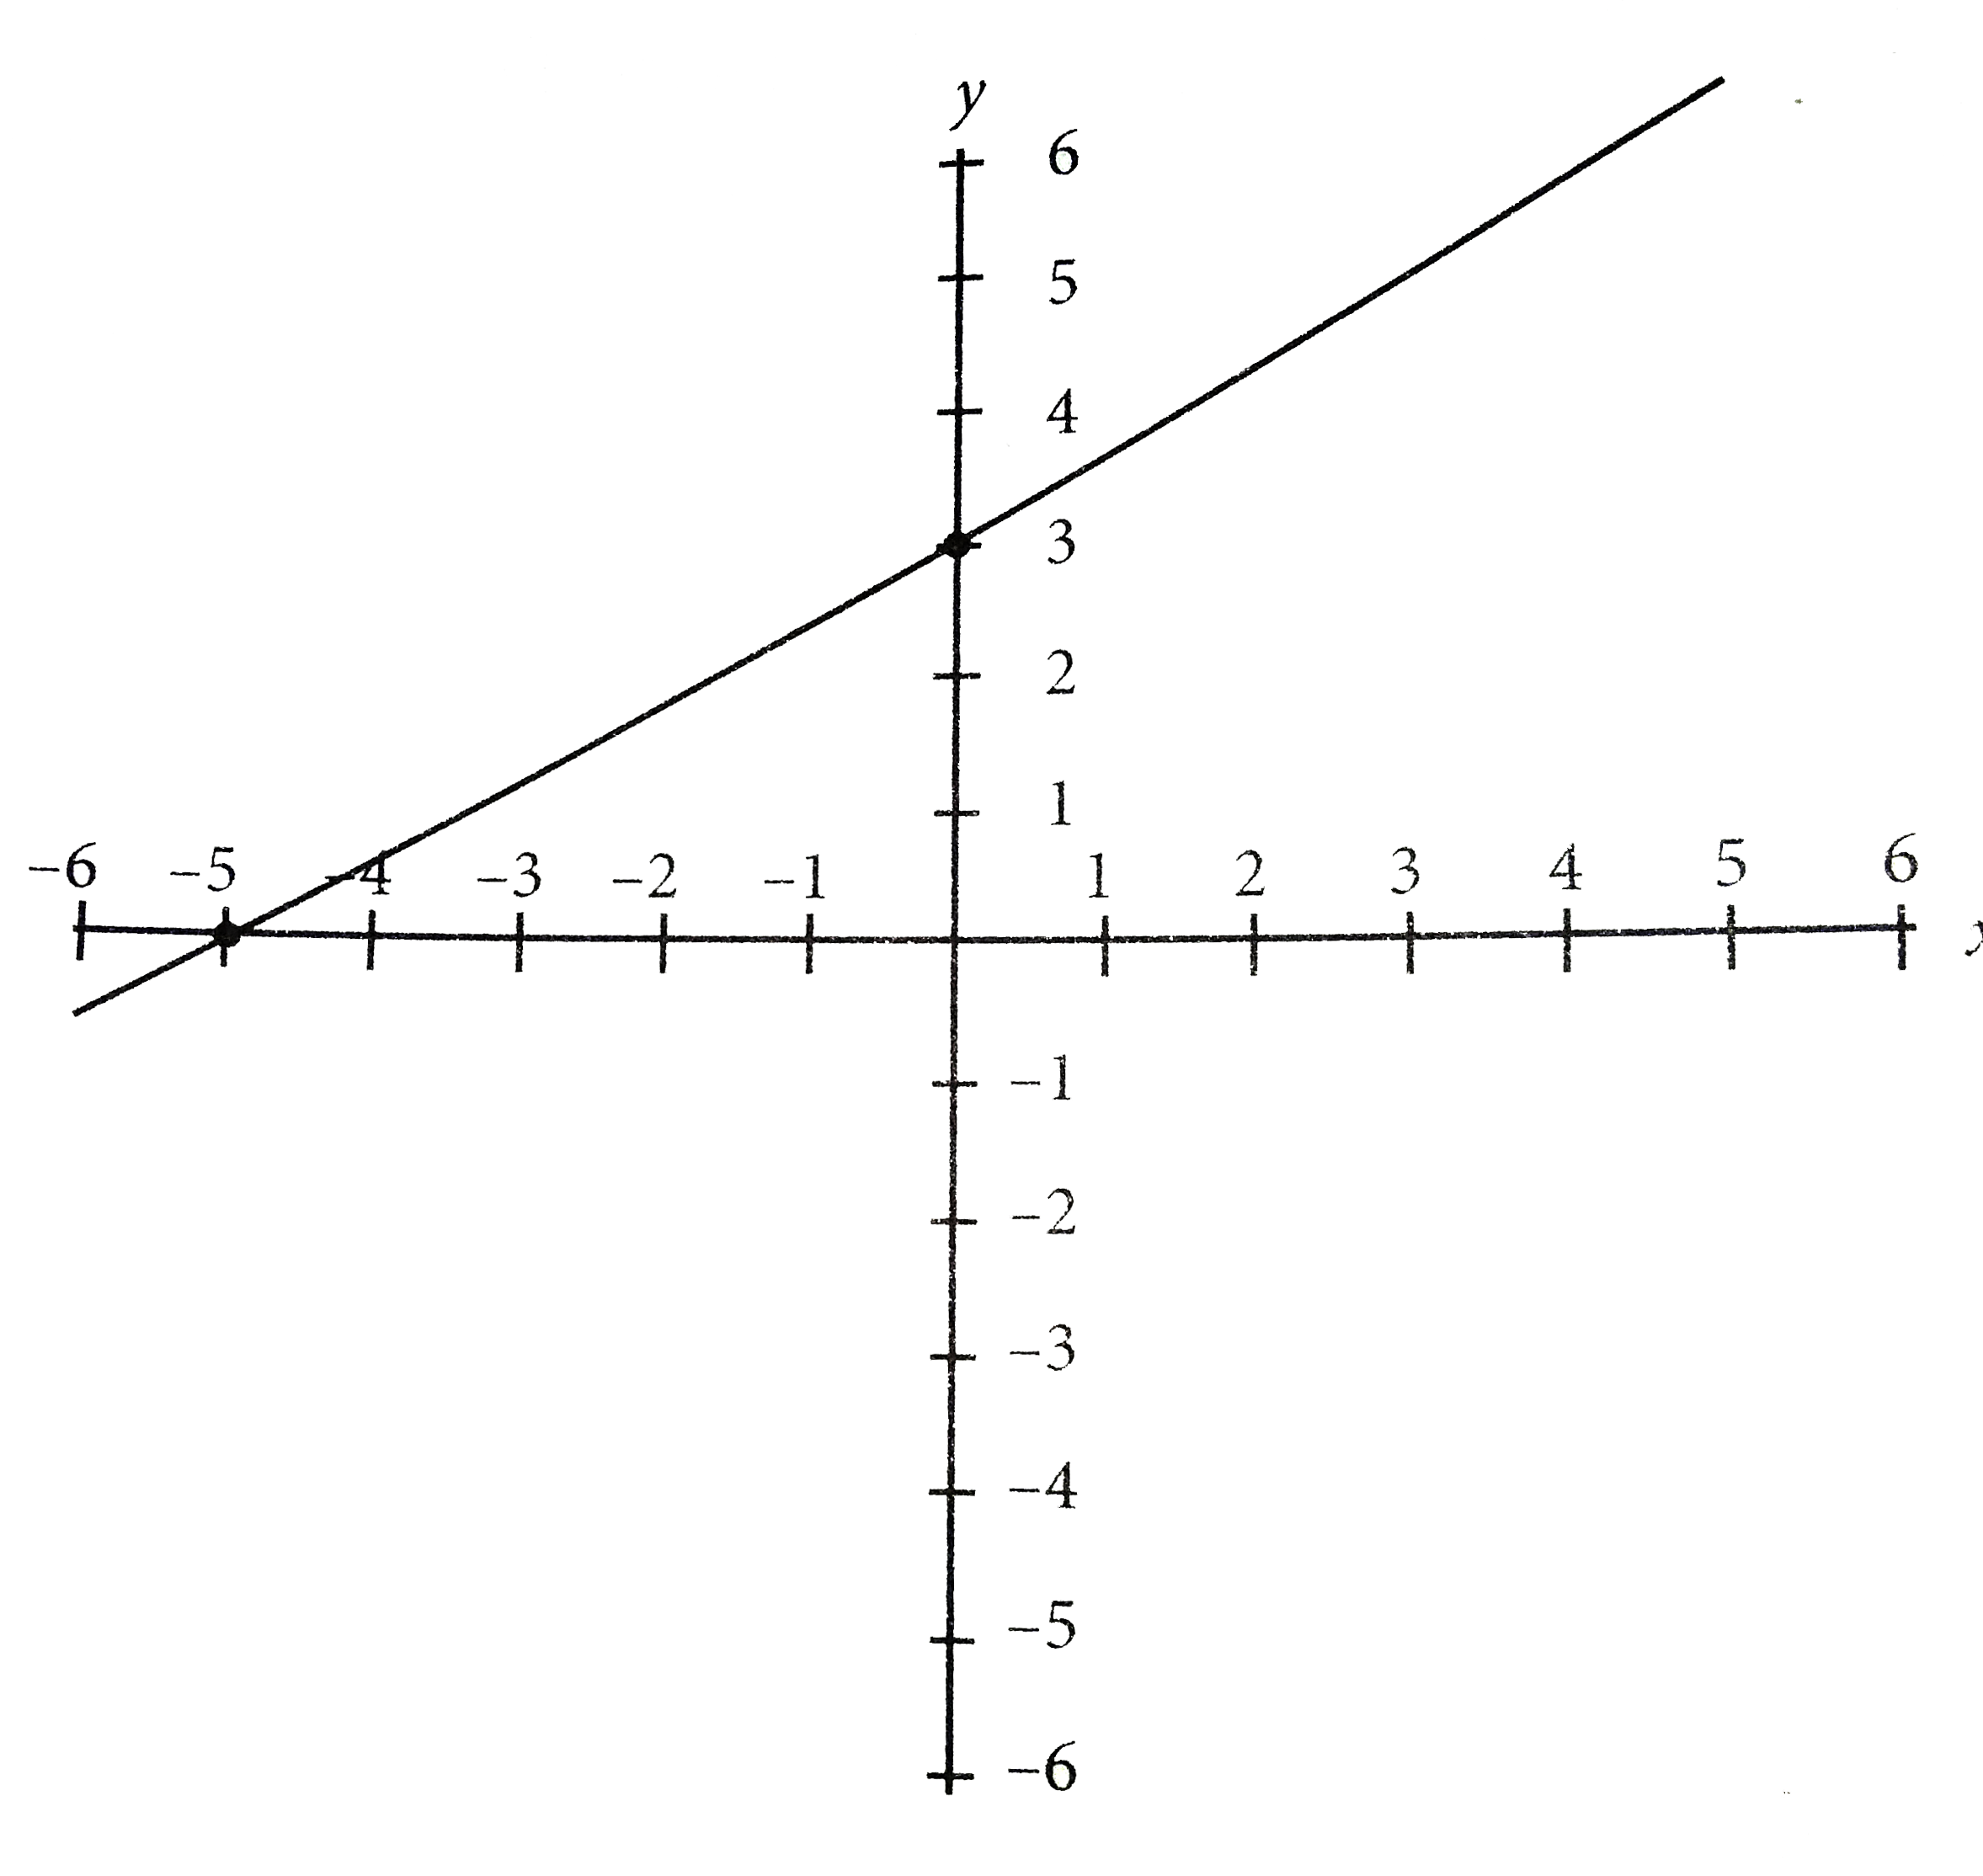
If the graph above is that of f(x), which of the following could be f(x)?Af(x)=15x+15Bf(x)=15x+3Cf(x)=3x+5Df(x)=5x+3
Given the graph of y=f(x), which of the following is graph of y=f(1−x)
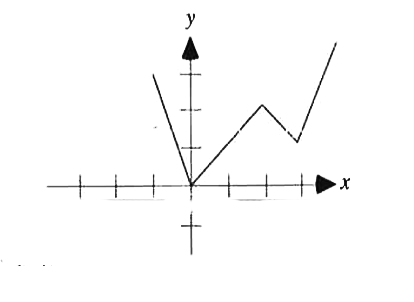
View SolutionThe graph of y=f(x) is shown to the right. If f(−1)=v, then which one of the following could be the value of f(v) ?
View Solution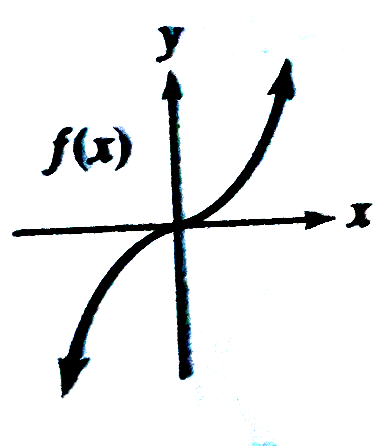
The graph of f(x) is shown above , Which of the following represents the graph of f(x-3) ?
View Solution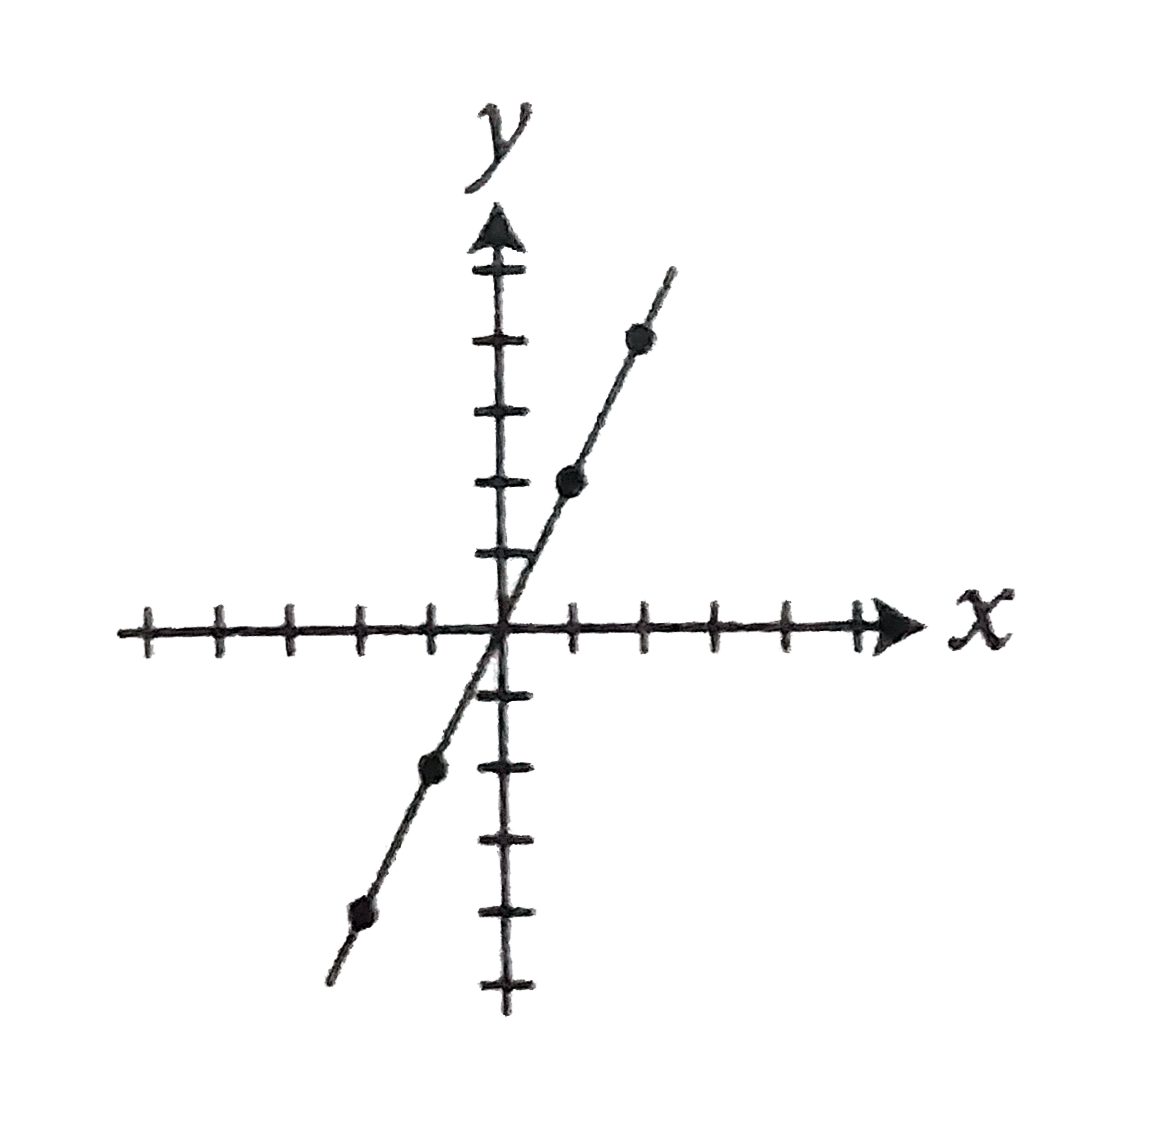
The graph above shows y=2x. Which of the following graphs represents y=|2x|?
View Solution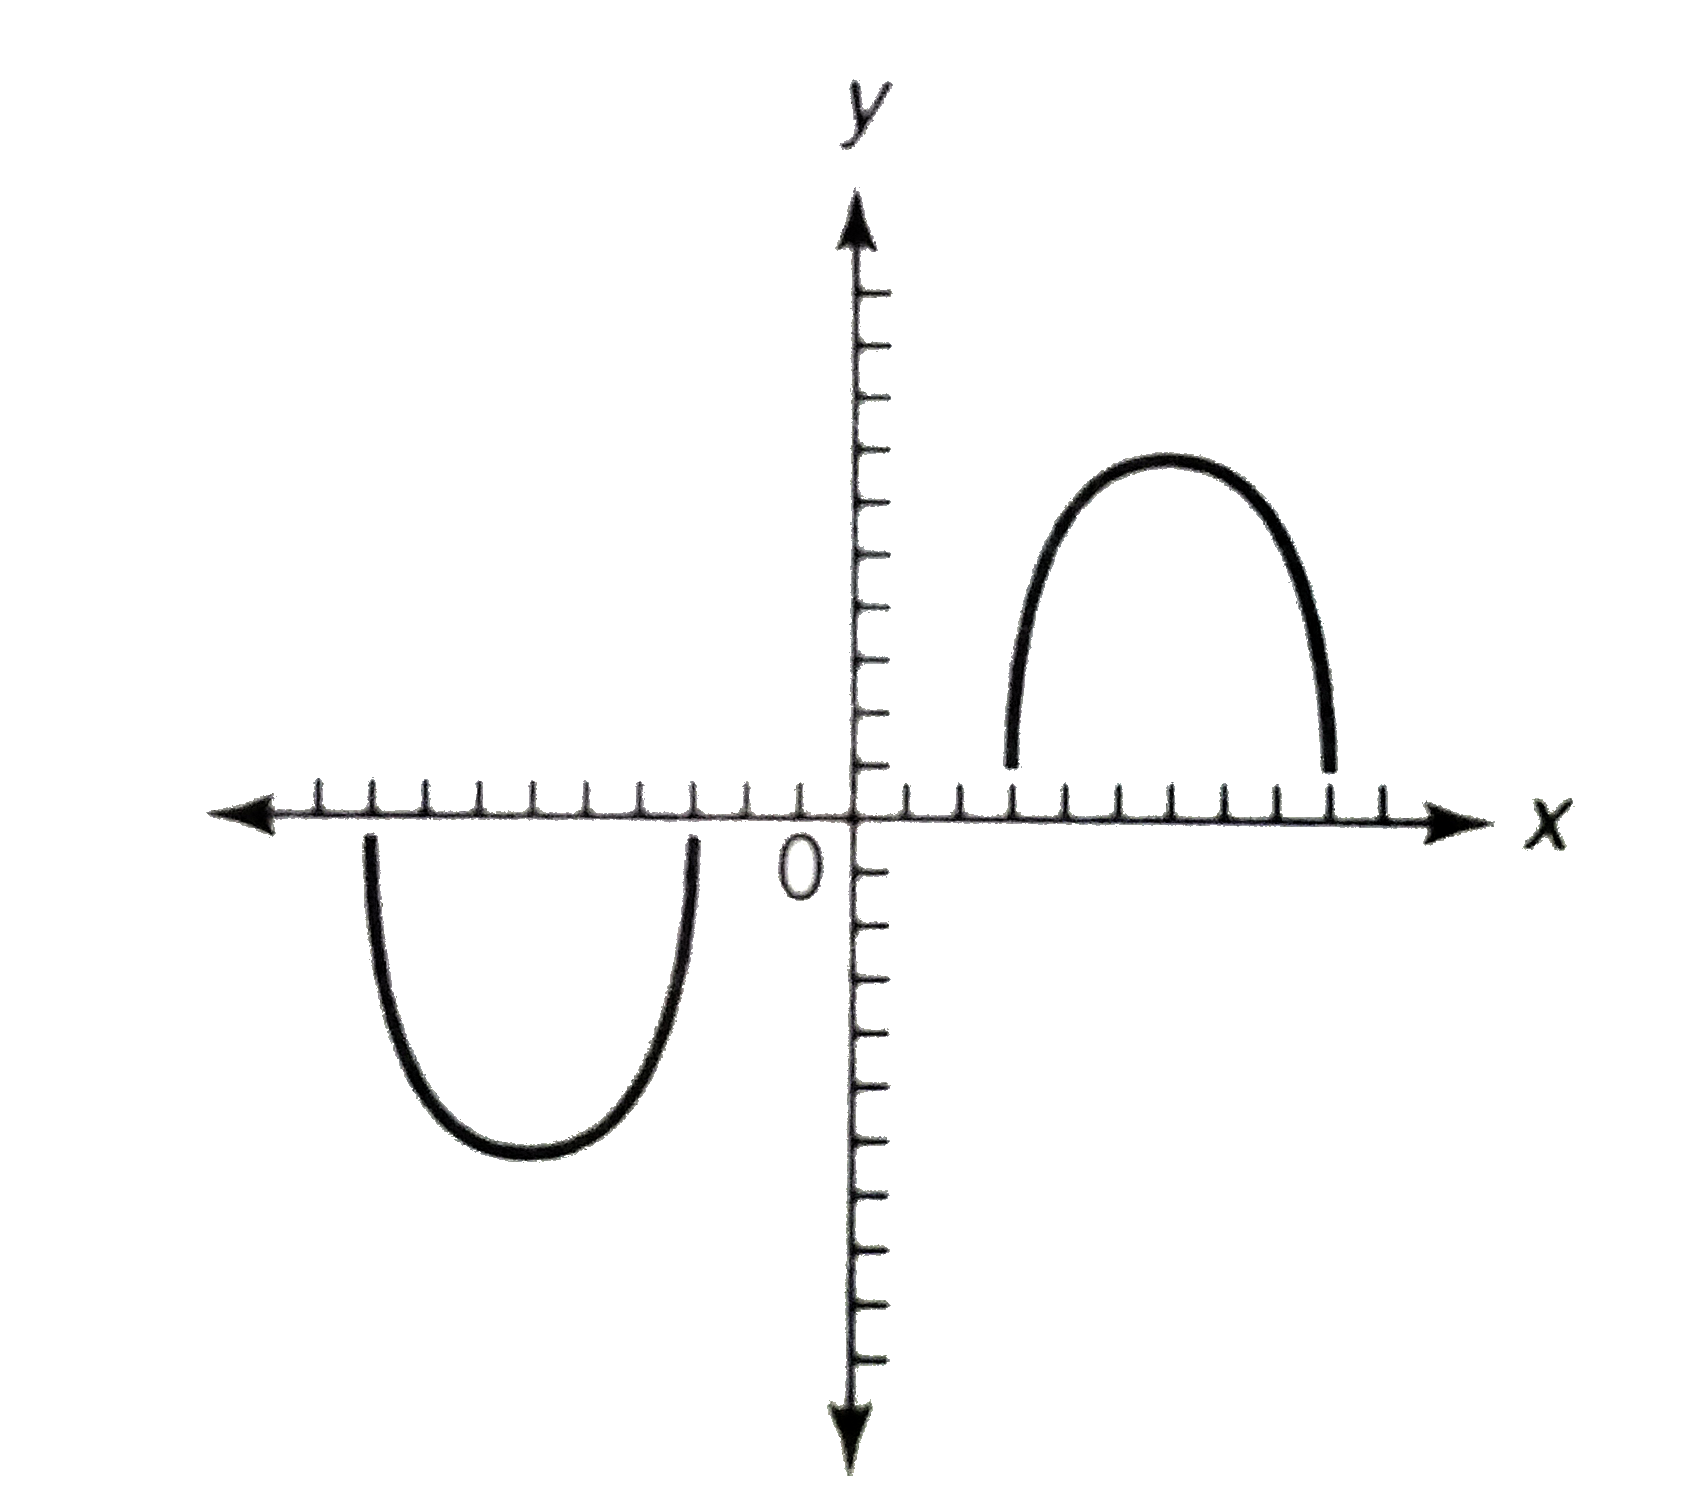
The graph of the function f is shown above. Which of the following could represent the graph of y=|f(x)|?
View Solution


