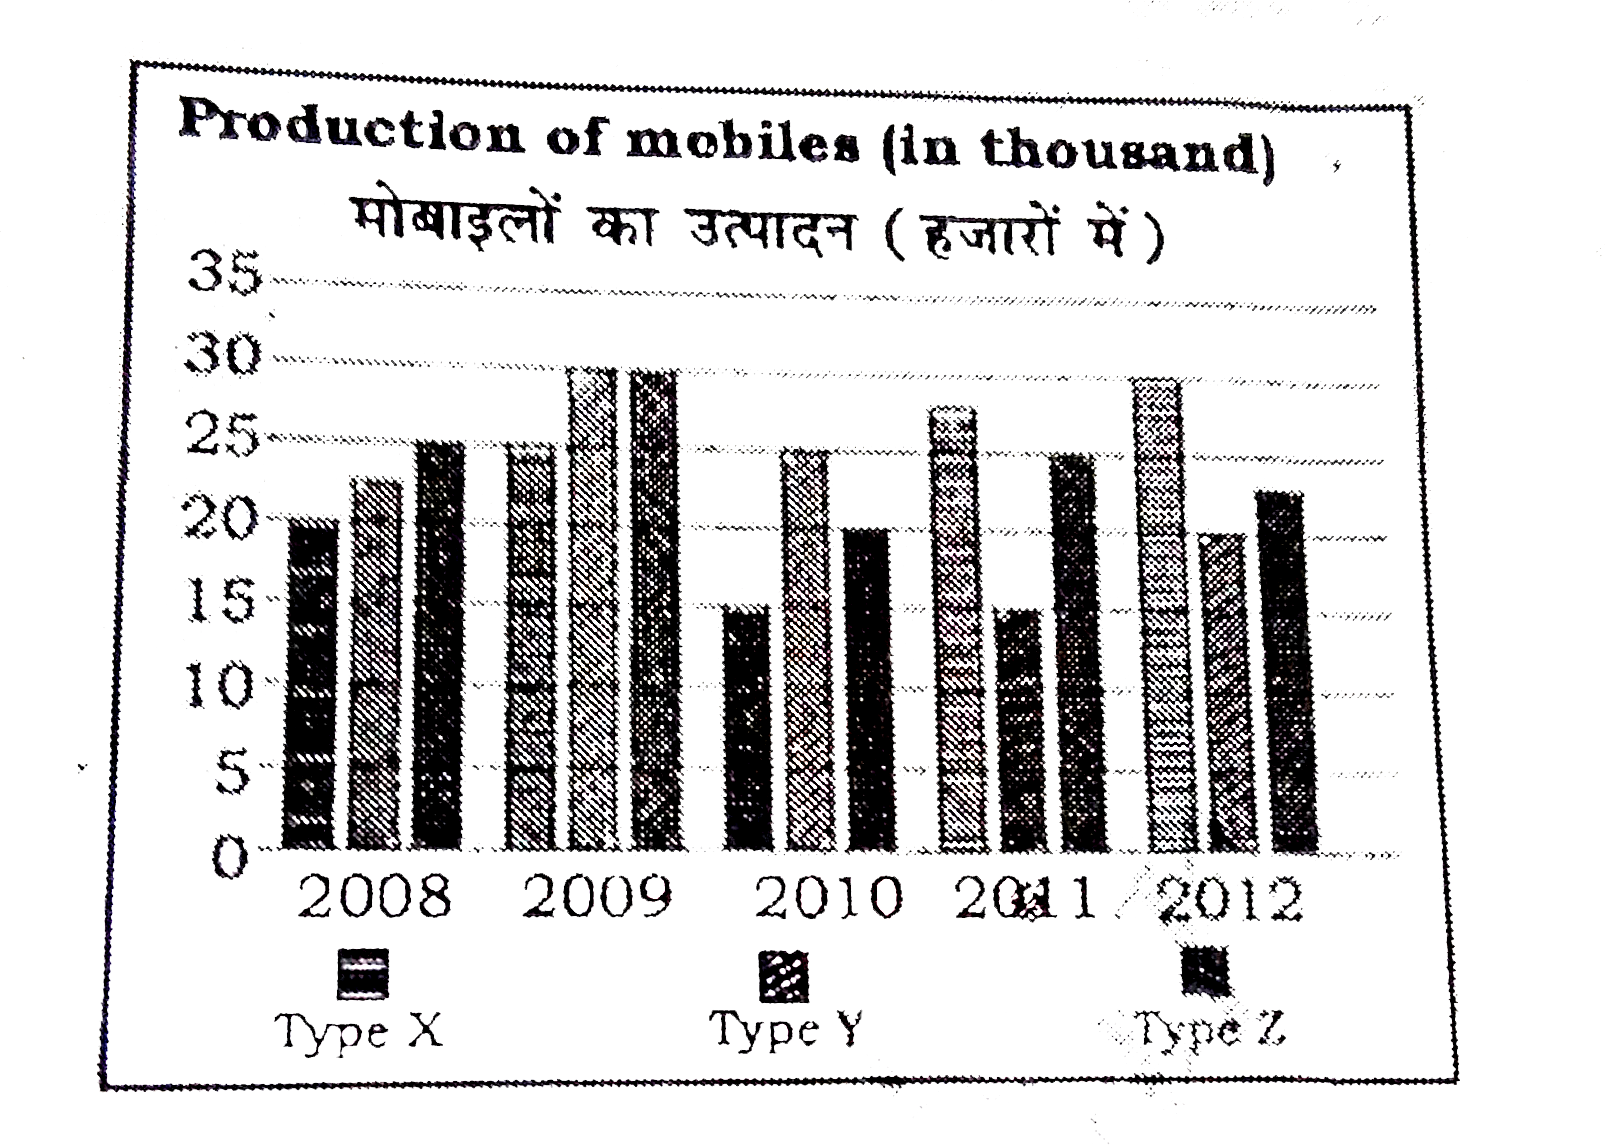
निमिन ग्राफ को ध्यानपूर्वक पढ़े और निचे दिए गए पर्सन का उतर दे?

निमिन में से किस वर्ष में Z प्रकार के मोबाइल फ़ोन की तुलना में Y प्रकार के मोबाइल फ़ोन का प्रतिसत उत्पादन अदिक्तम है?

2008
2010
2011
2012
केवल दो वर्ष में y प्रकार के मोबाइल फ़ोन का उत्पादन अधिक है!
2010 में y इस प्रकार की प्रतिशत अधिकता =520×100=25%
Similar Questions
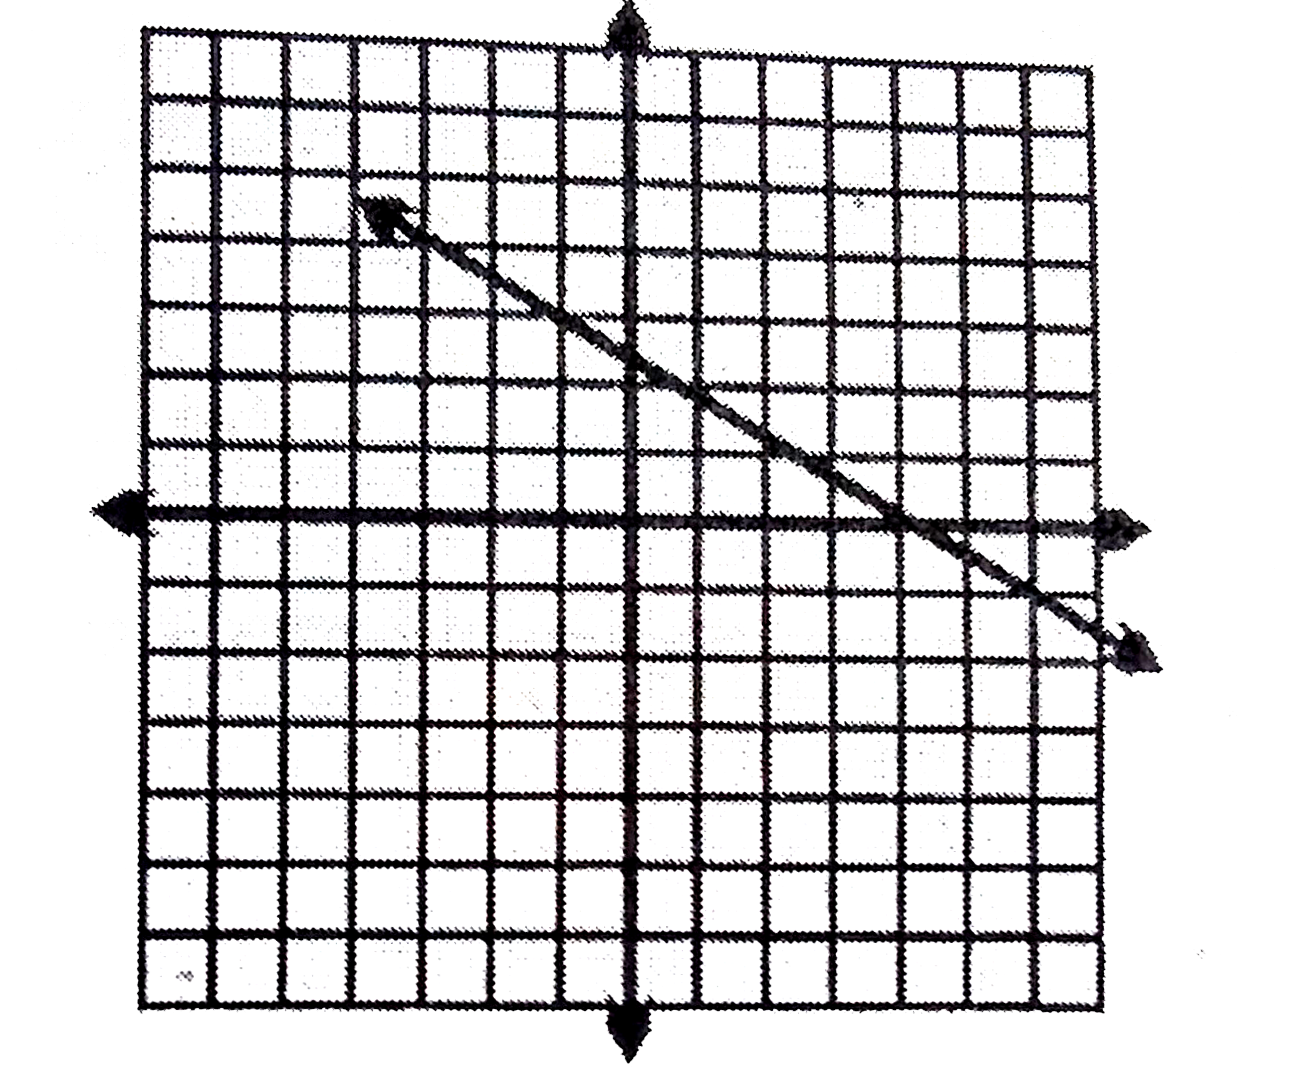
The inequation that best describes the graph given below is _________
View SolutionThe inequation that best describes the following graph is _________
View SolutionWhich inequations represent the shaded region in the given figure
View SolutionAt x=0, value of (dy)/(dx) is : ltimg src="https://d10lpgp6xz60nq.cloudfront.net/physics_images/ALN_PHY_R04_E01_024_Q01.png" width="80%"gt
View SolutionFrom the following figure, the correct observation is :- ltimg src="https://d10lpgp6xz60nq.cloudfront.net/physics_images/ALN_PHY_R03_E08_015_Q01.png" width="80%"gt
View SolutionMatch Column I with Column II: ltimg src="https://d10lpgp6xz60nq.cloudfront.net/physics_images/NCERT_BIO_XI_C20_E01_010_Q01.png" width="80%"gt
View SolutionMatch the items given in column A and B: ltimg src="https://d10lpgp6xz60nq.cloudfront.net/physics_images/NCERT_BIO_XII_C16_E01_004_Q01.png" width="80%"gt
View SolutionShifting of the curve to right takes place in the case of ltimg src="https://d10lpgp6xz60nq.cloudfront.net/physics_images/ALN_BIO_NTUG_E01_065_Q01.png" width="80%"gt
View Solution
