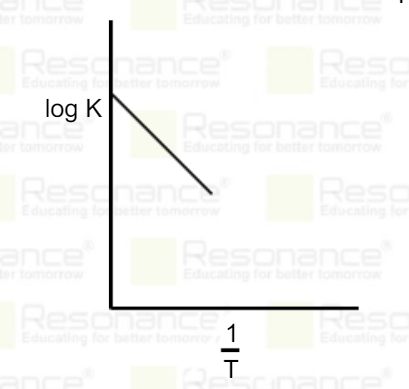
What is the slope of the straight line for the graph drawn between Ink and y, where k is the rate constant of a reaction at temperature T?Solution in Telugu
−Ea2.303R
−EaR
EaR
REa
The correct Answer is:B
Arrhenius equation k=Ae−Ea/RT
Take "log" on both sides
lnk=lnA+ln(e−Ea/RT)
⇒lnk=lnA−Ea/RT
⇒lnk=−Ea/RT+lnA…….(1)
y=mx+c
By comparing equations (1) and (2), we get,
∴ The slope of the straight line, m=−EaR

Similar Questions
Rate constant k of a reaction varies with temperature according to the equation
logk = constant −Ea2.303R(1T)
where Ea is the energy of activation for the reaction . When a graph is plotted for log k versus 1T , a straight line with a slope - 6670 K is obtained. Calculate the energy of activation for this reaction
View SolutionThe rate constant 'k'. For a reaction varies with temperature 'T' according to the question. logk=logA−Ea2.303R(1T)
Where Ea is the activation energy. When a graph is plotted for logkvs1/T, a straight line with a slope of −4250 K is obtained. Calcualte Ea for this reaction.
View Solutionयदि Ink और 1/T के प्रथम-कोटि अभिक्रिया के लिये ग्राफ खींचा जाए, तो सीधी रेखा का ढाल (Slope) होगा :
View Solutionदर स्थिरांक k का तापमान T(R) के साथ विक्षेपण निम्न समीकरण द्वारा दर्शाया जाता है
logk=logA−Ea2.303RT
logk और 1T के बीच खींचा गया ग्राफ एक सीधी रेखा है, अतः कहा जा सकता है
View SolutionFor a reaction graph between logK vs 1T is as with slope = -10,000.

At temperature 500K rate constant k = 10−5 .
Find the temperature in K at which rate constant = 10−4
View SolutionRate constant k of a reaction varies with temperature according to the equation logk = constant -E_a/(2.303R)(1/T) where E_a is the energy of activation for the reaction . When a graph is plotted for log k versus 1/T , a straight line with a slope - 6670 K is obtained. Calculate the energy of activation for this reaction
View SolutionFor a reaction having rate constant k at a temperature T, when a graph between ln k and 1/T is drawn a straight line is obtained. The point at which line cuts y -axis and x -axis respectively correspond to the temperature:
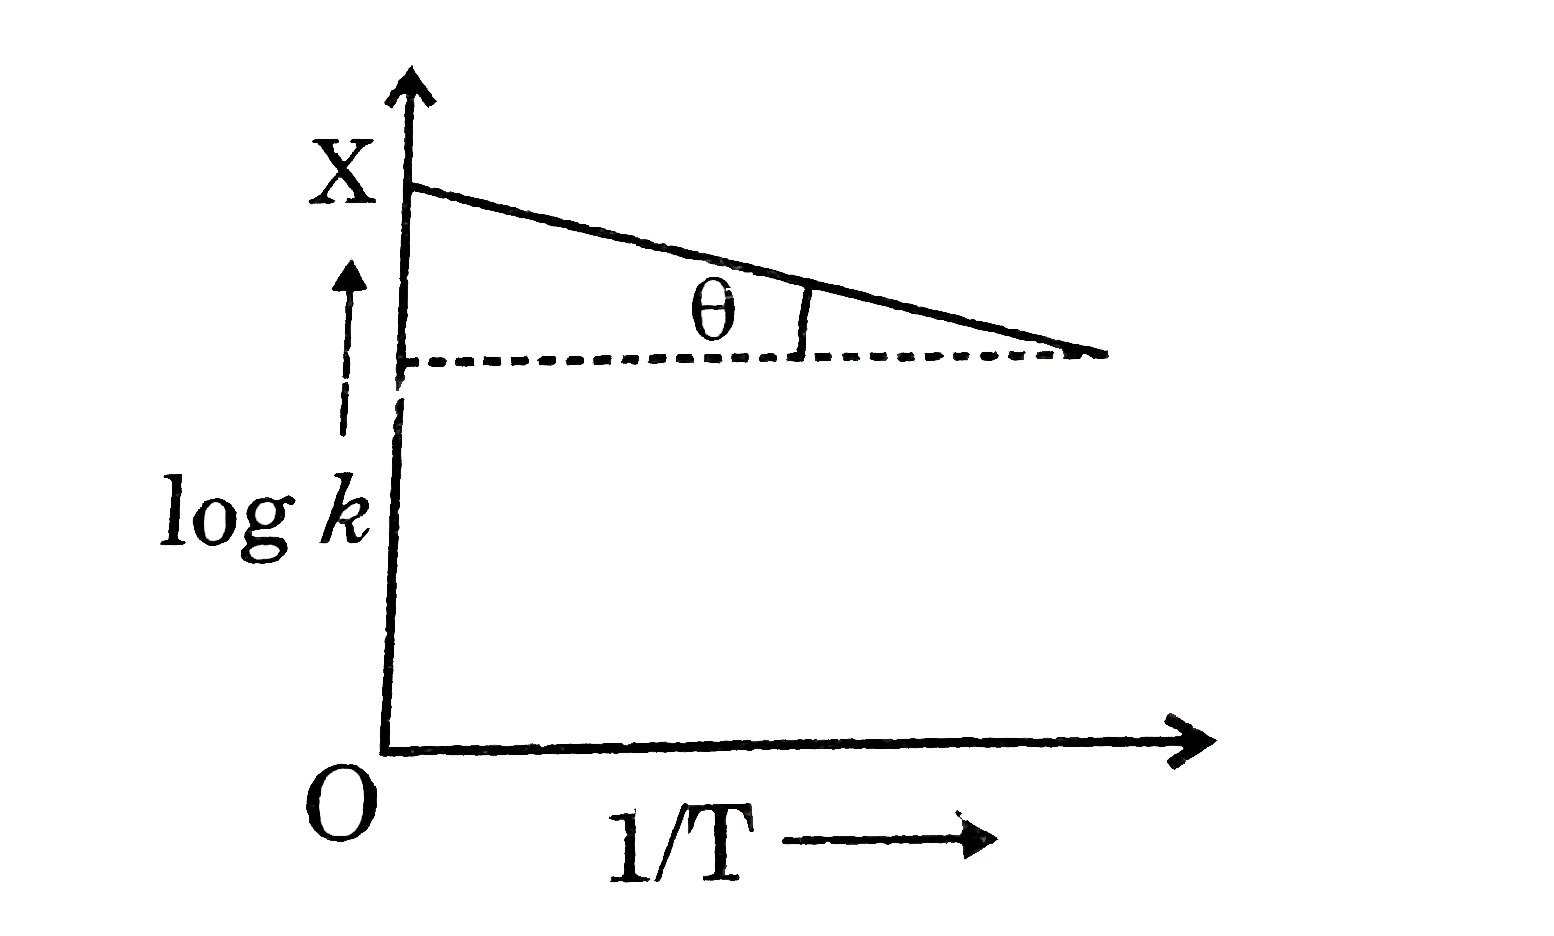
View SolutionGraph between log k and 1T (k is rate constant in s−1 and T is the temperature in K) is a straight line. As shown in figure if OX = 5 and slope of the line =−12.303then Ea is :

View Solution

