The table below details a recent census report about the commuting habits of U.S . Workers age 16 or over for the years 2004 , 2005 , and 2006.
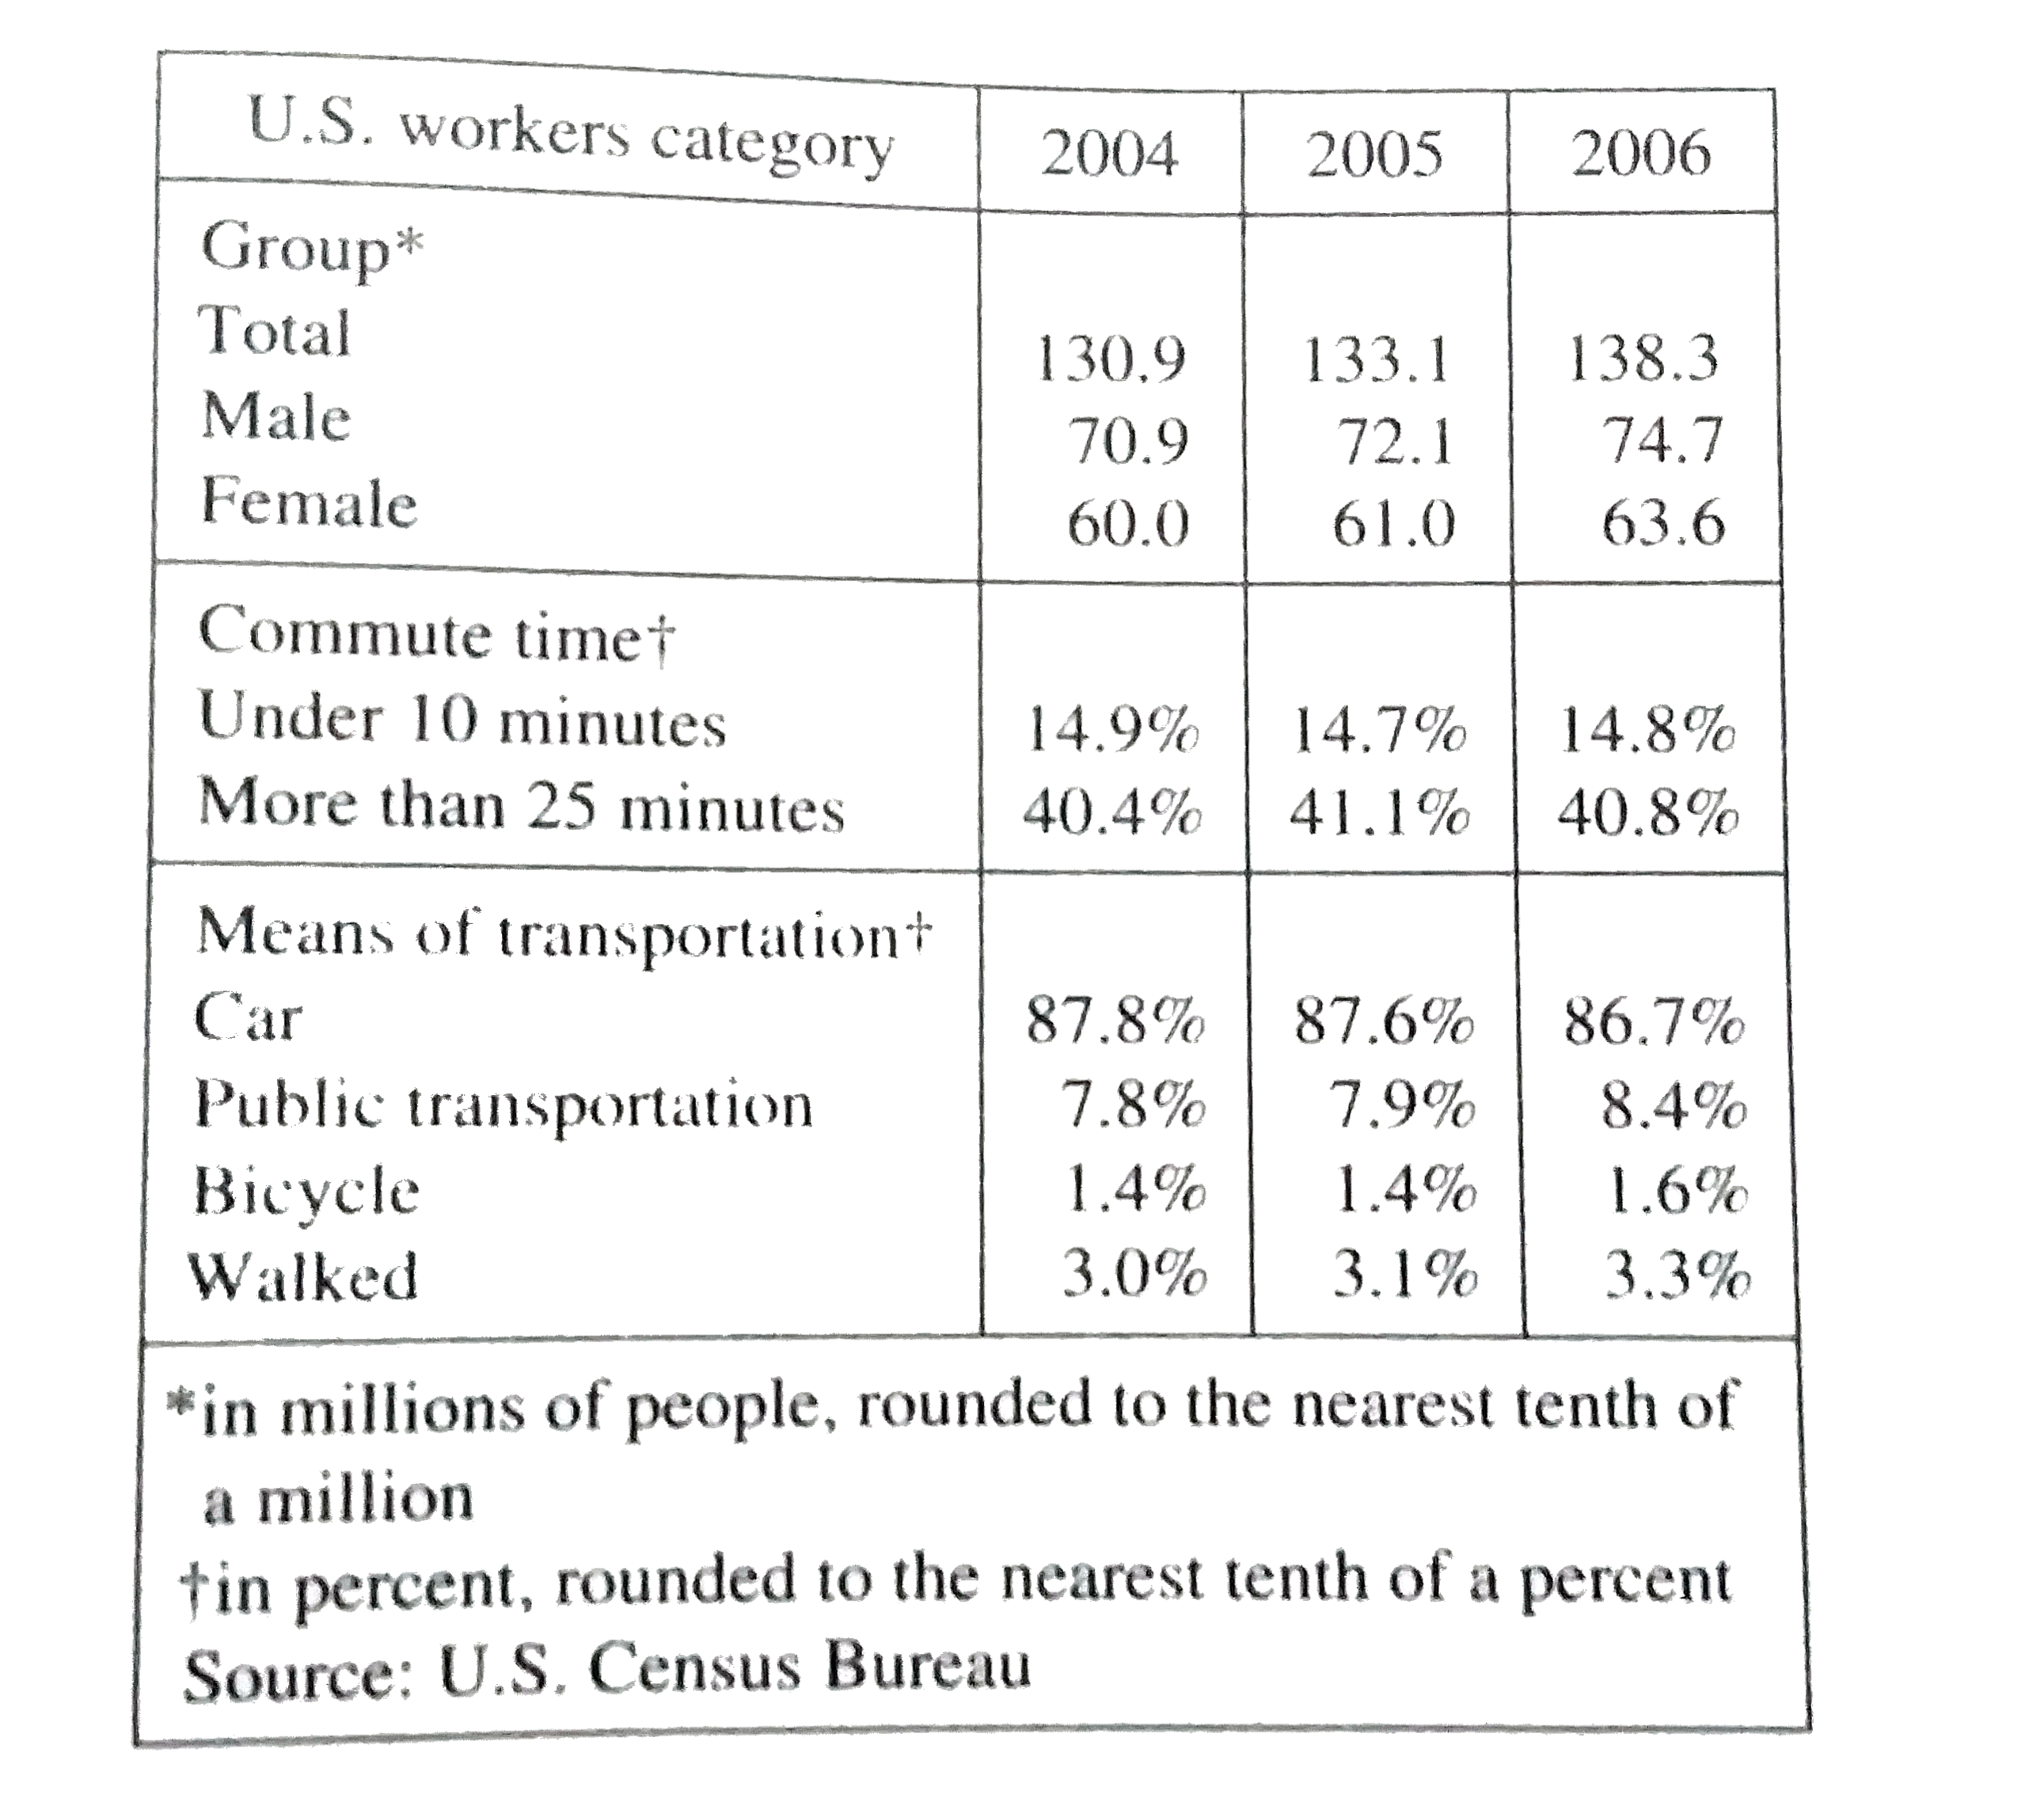
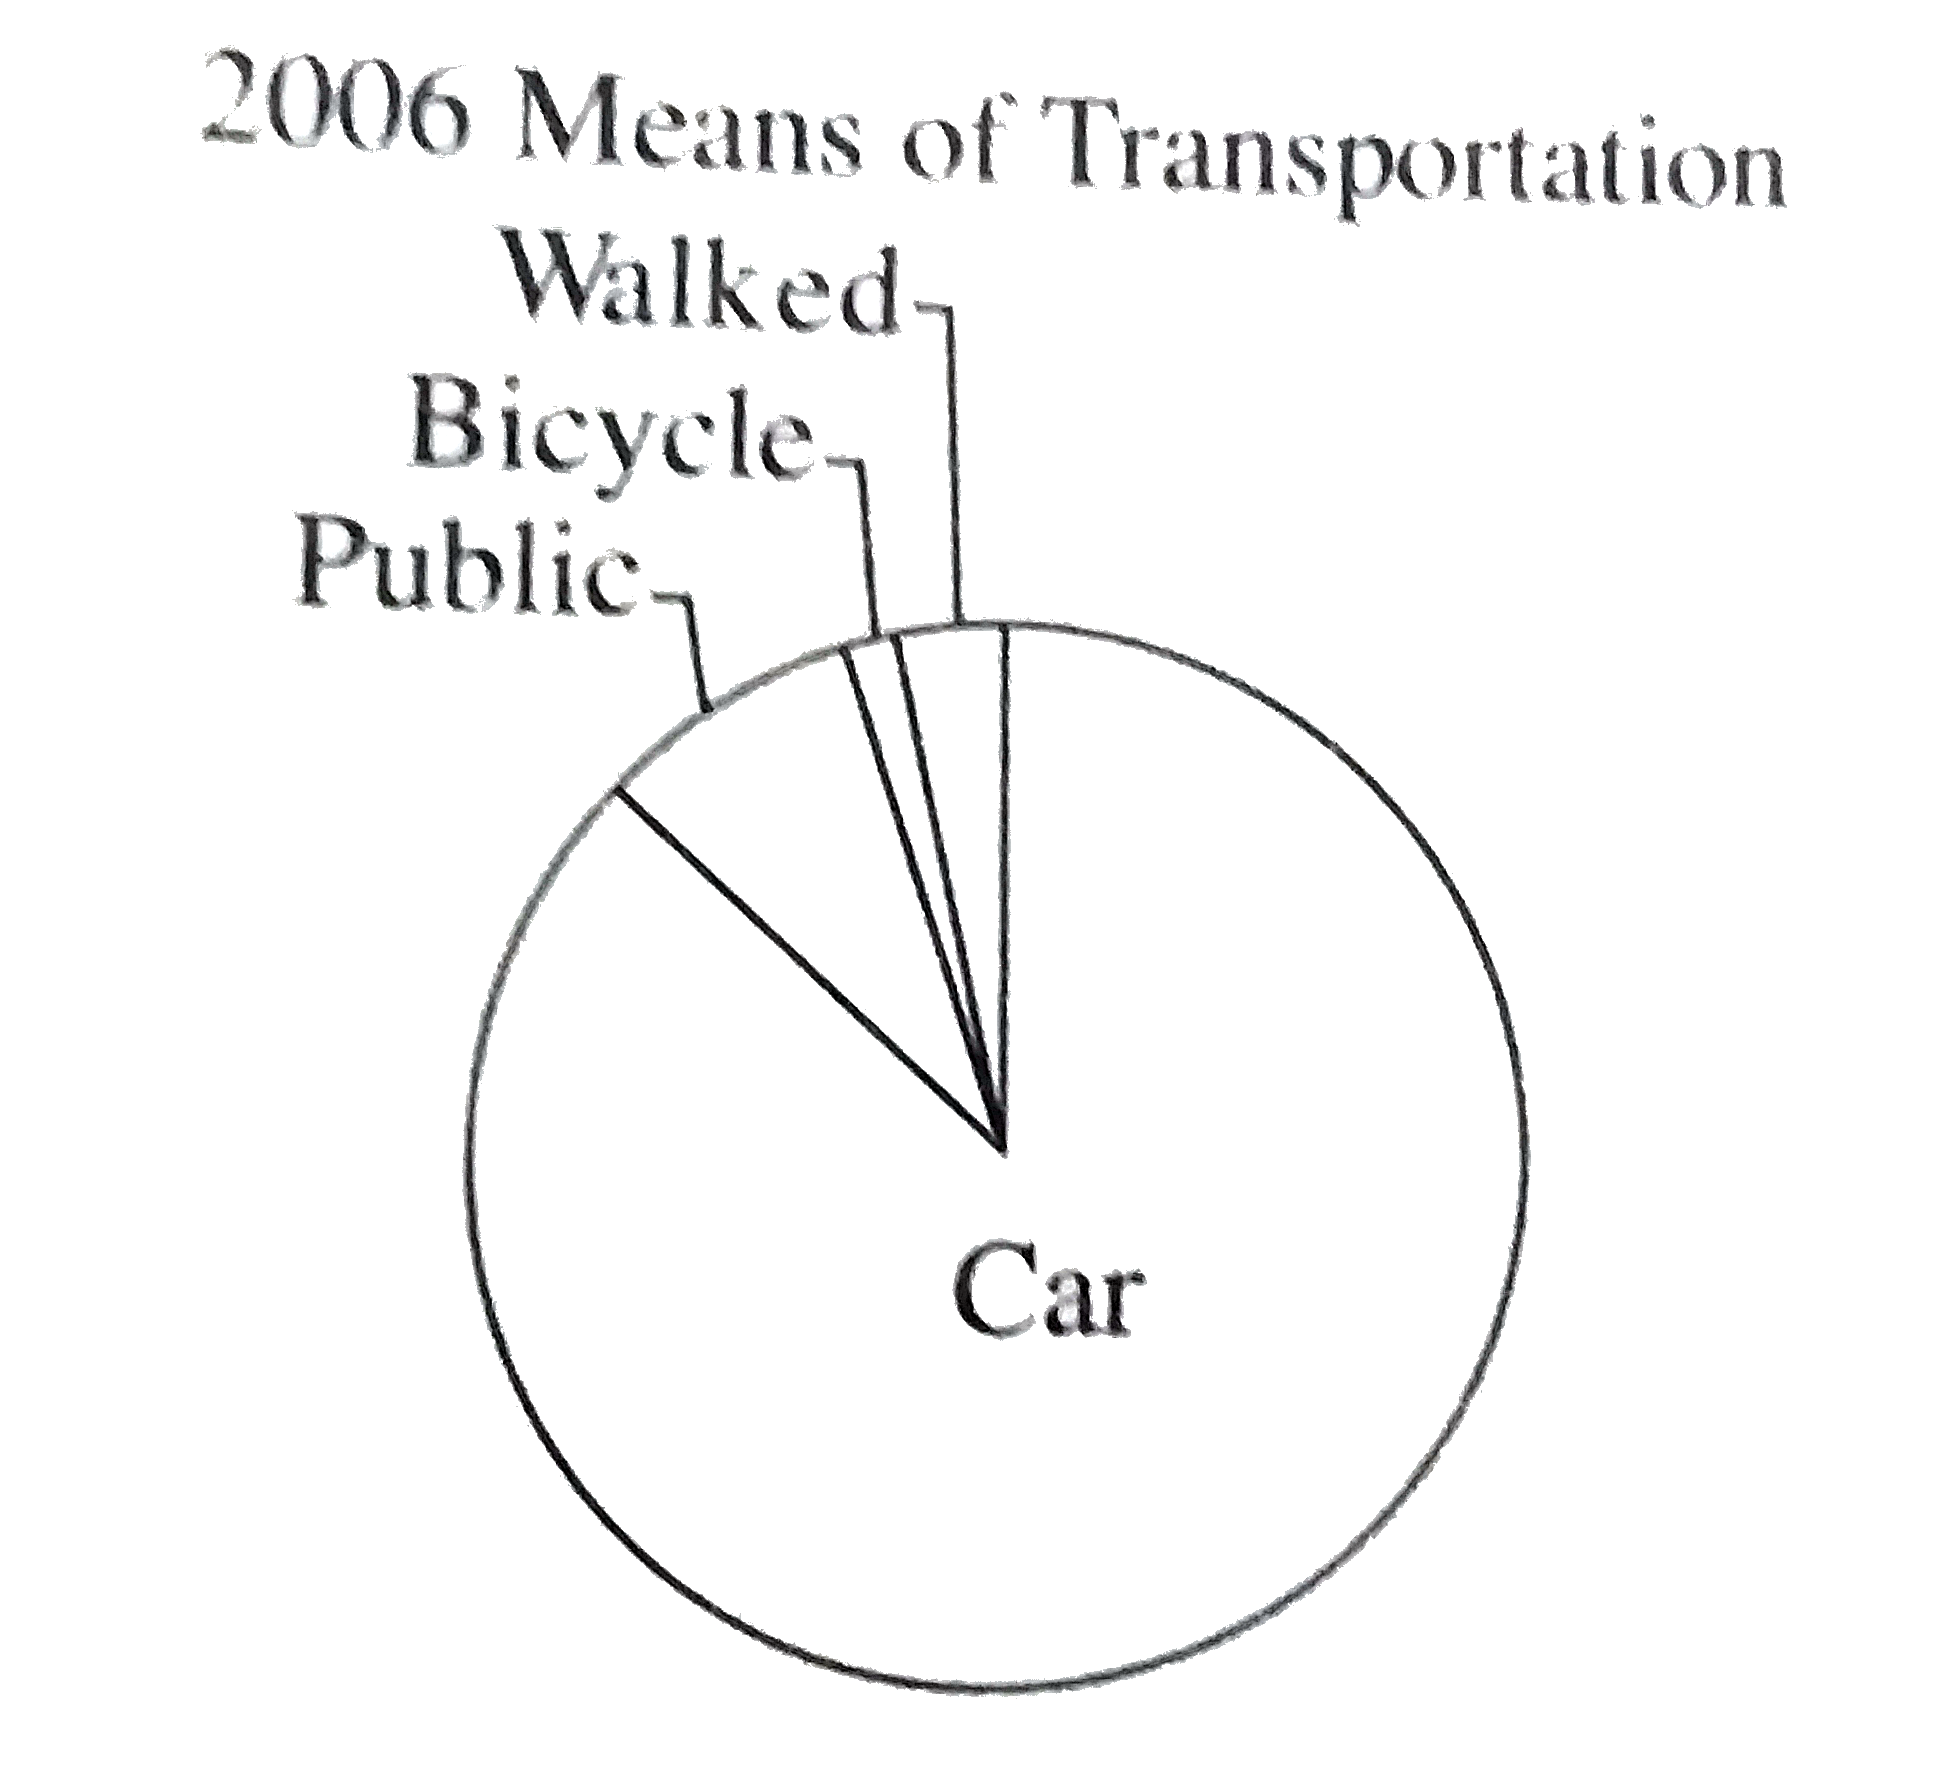
The circle graph (pie chart ) below represents the 2006 means of transportation for U.S . workers age 16 or over for the four transportation types listed . To the nearest degree , What is the measure of the central angle for the " Public " sector ?
A
8∘
B
12∘
C
20∘
D
30∘
Text Solution
The correct Answer is:D
|
Topper's Solved these Questions
Similar Questions
Knowledge Check
The table below details a recent census report about the commuting habits of U.S . Workers age 16 or over for the years 2004 , 2005 , and 2006.
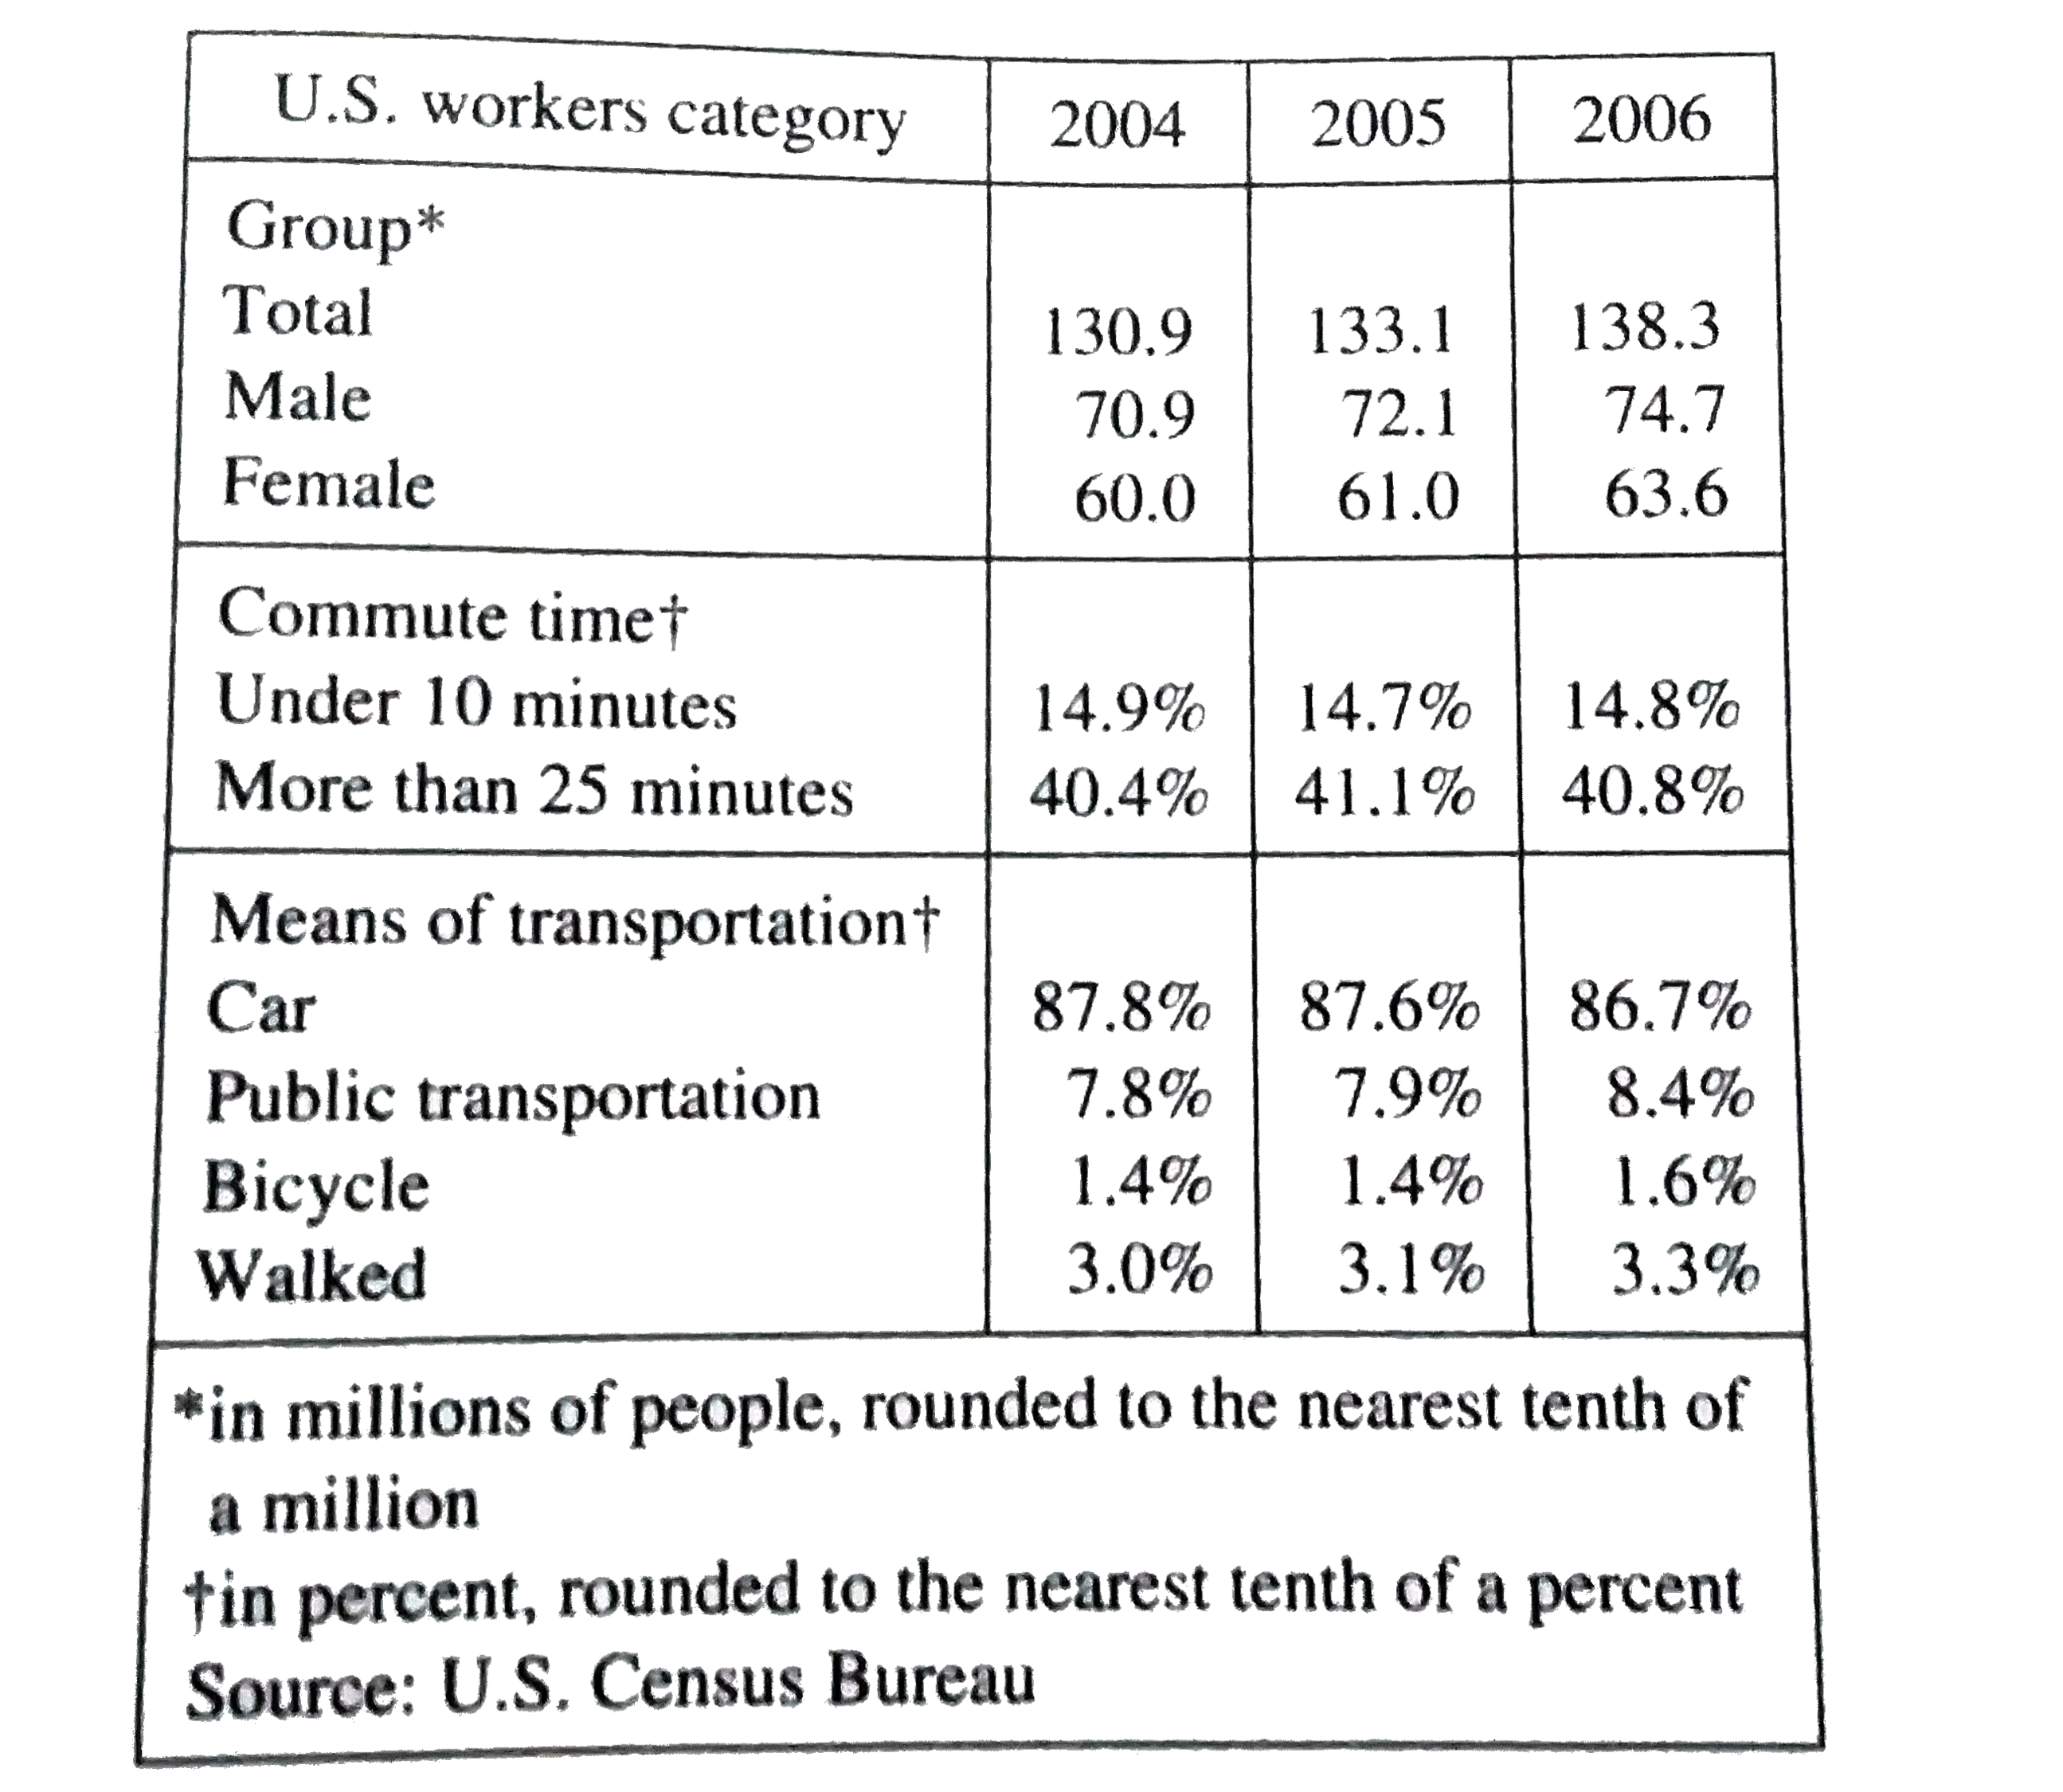
The the nearest percent , what percent of all U.S workers age 16 or over in 2004 was female ?A50%B48%C46%D44%The table below details a recent census report about the commuting habits of U.S . Workers age 16 or over for the years 2004 , 2005 , and 2006.
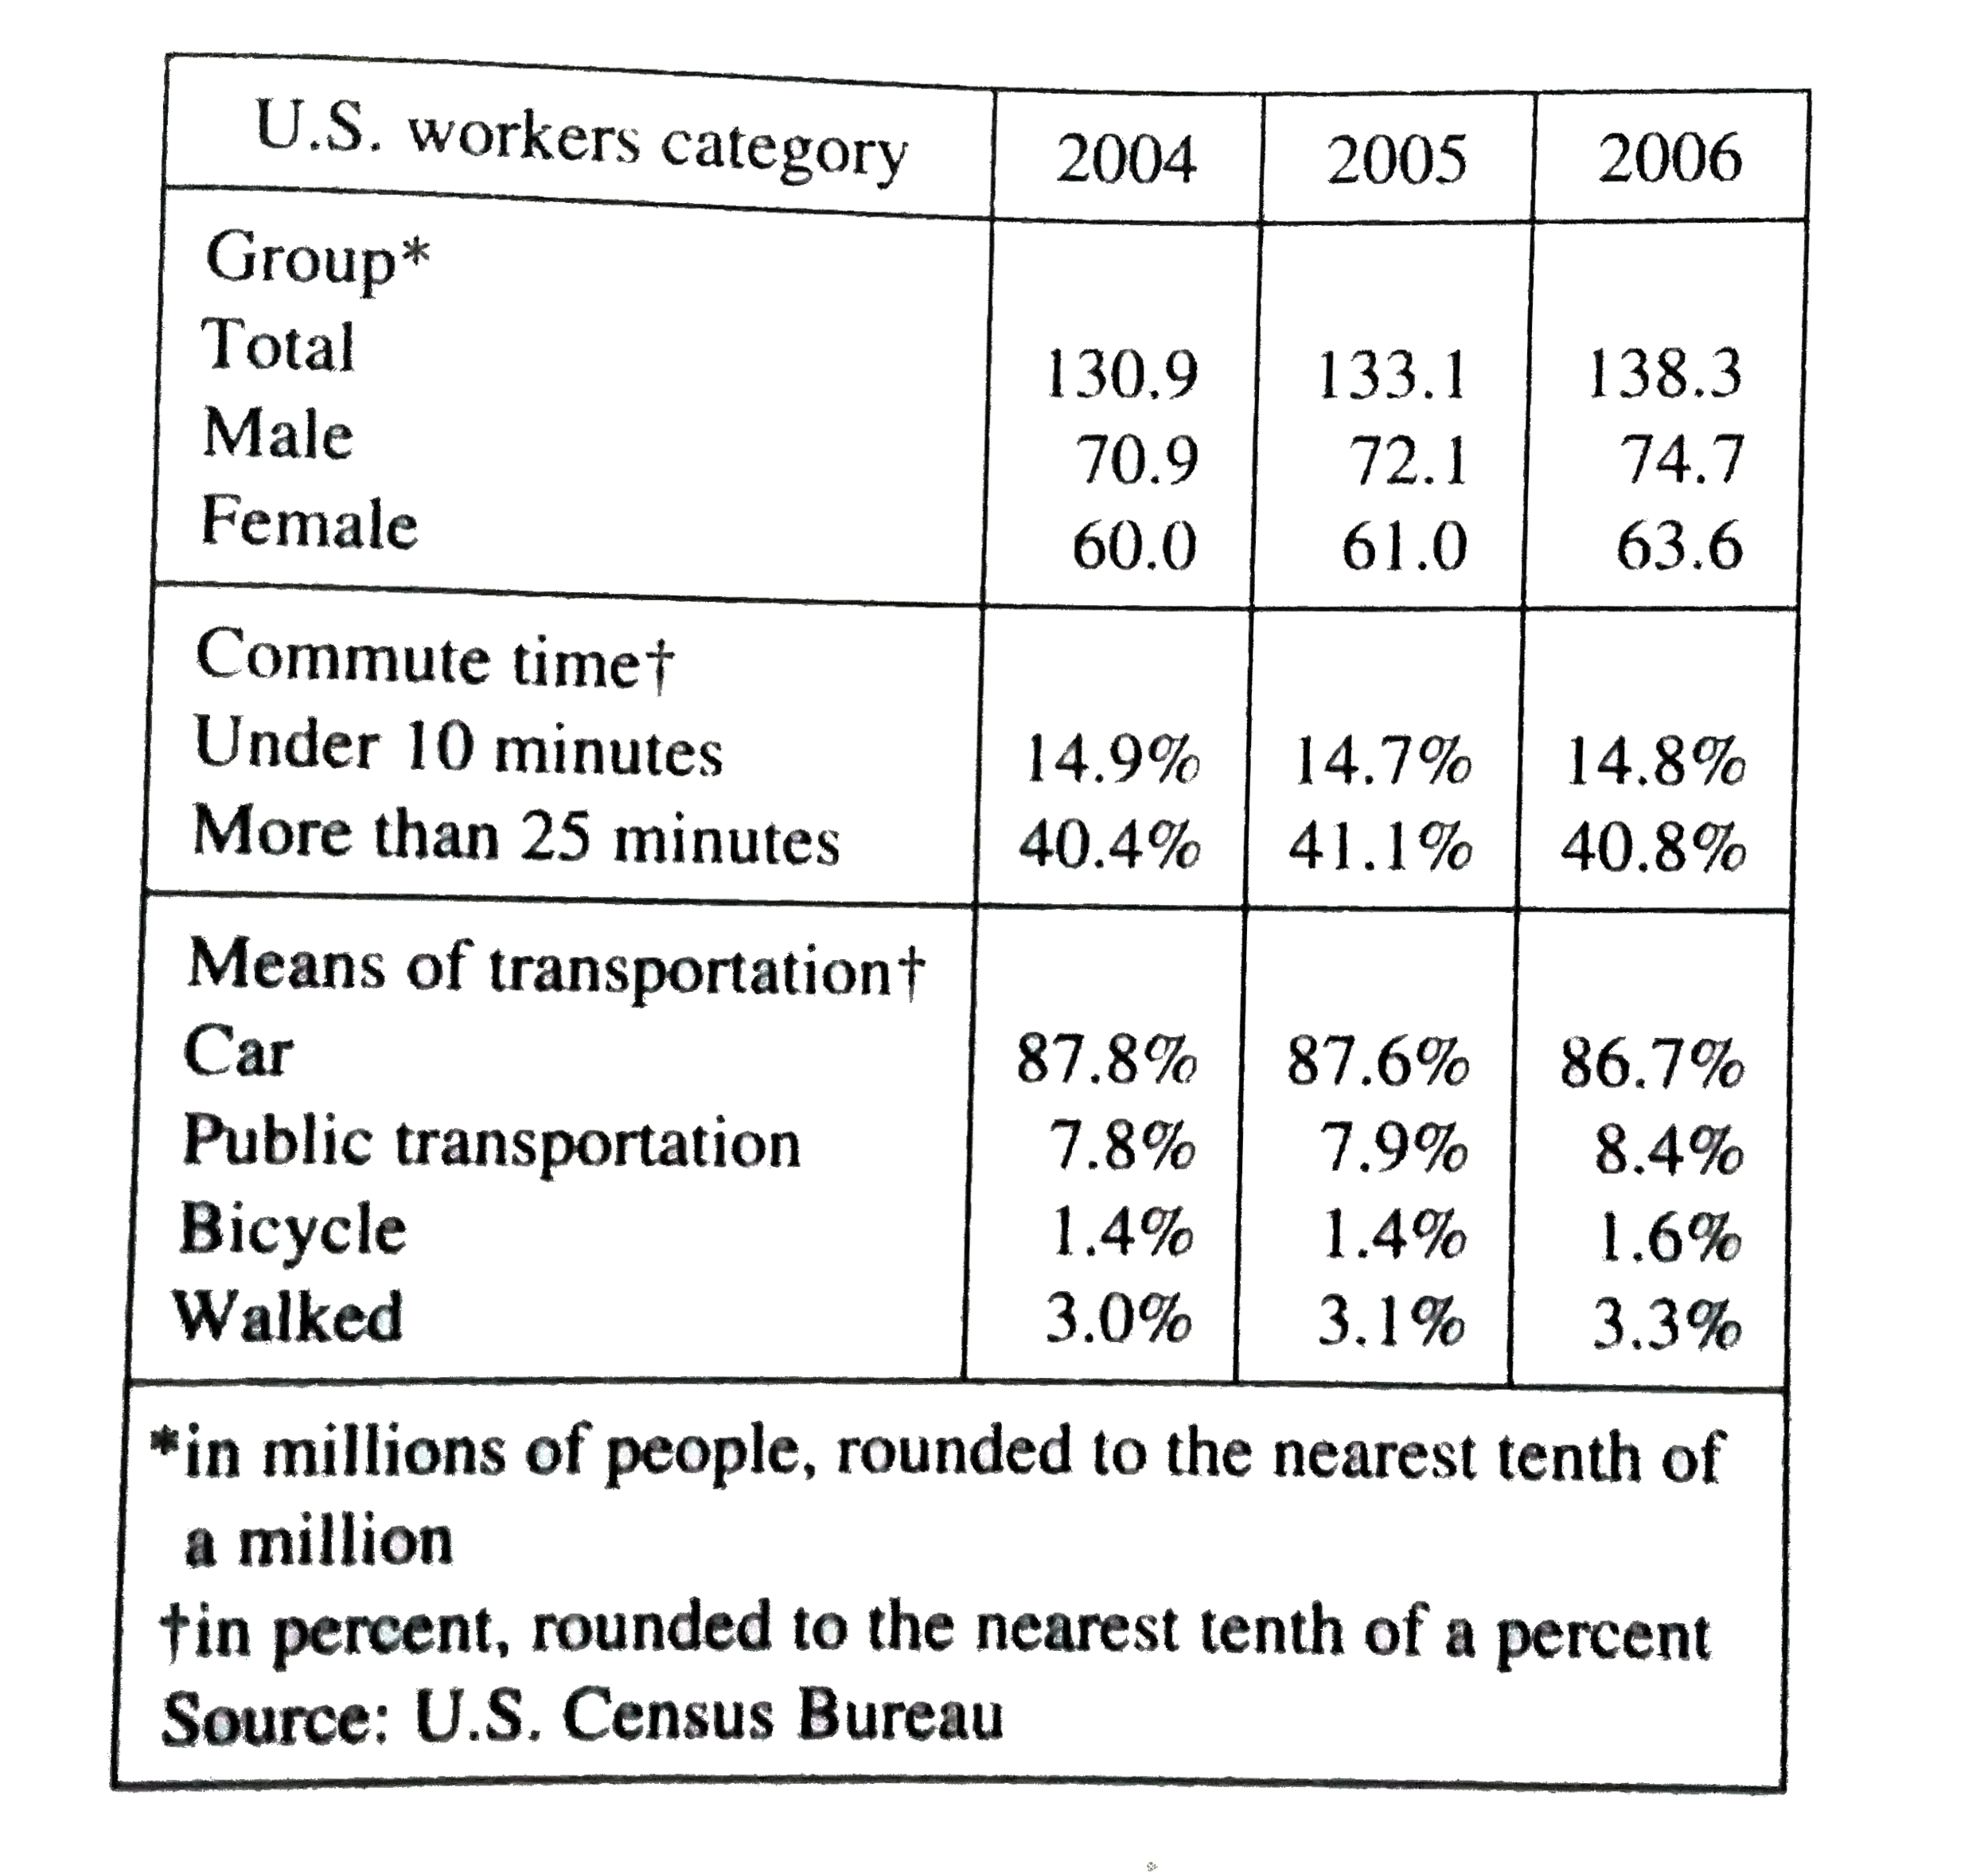
Expressed in millions of people , what was the average growth per year for female U.S workers age 16 or over from 2004 to 2006 , rounded to the nearest 0.1 million ?A0.5B0.9C1.3D1.8What is the sum of students passed from university B in the years 2003, 2005 and 2006 together?
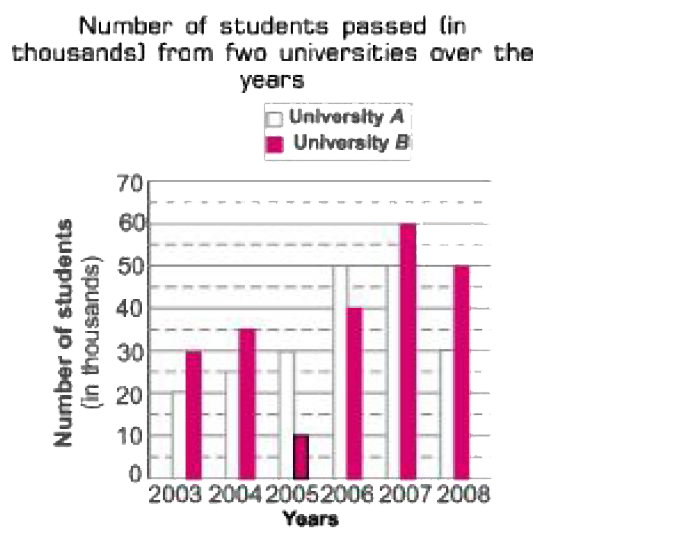 A80000B8000C800000D75000
The following table gives the average temperatures, during the year 2006 and 2007. Draw a double bar graph for the given data.

View SolutionThe ratio of the total expenditure for the years 2000 and 2006 is 5:8. The cost of living index of 2006, taking 2000 as the base year, is ____
View SolutionObserve the graph below and answer the following question.
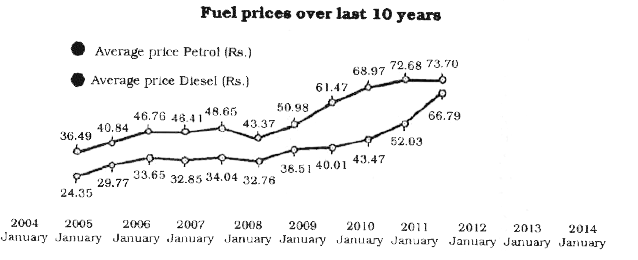
What is the average of diesel prices over the years 2006-2012?
View SolutionThe United Nations declared 2006 as the International Year of
View Solution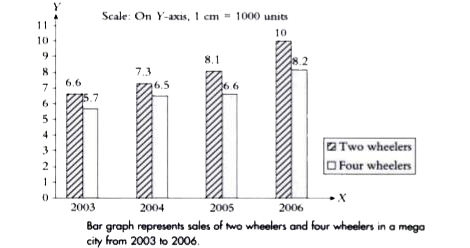
Find the ratio between number of vehicles sold in the year 2004 and in the year 2006.
View Solution


