The correct graph which shows the variation of paramagnetic susceptibility S with temperature T is
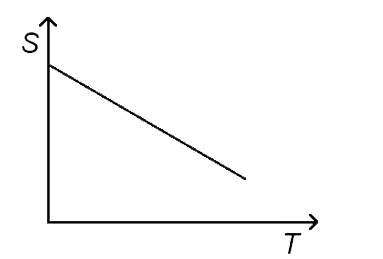
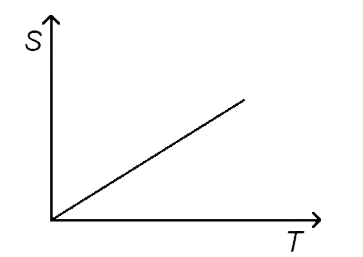
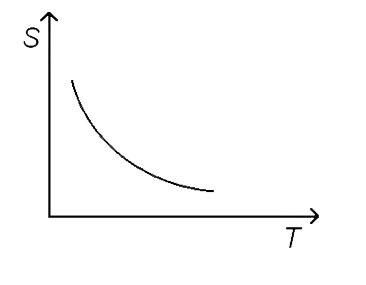
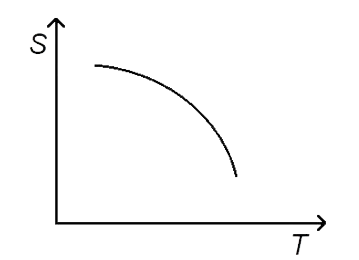
The correct Answer is:C
To solve the problem of determining the correct graph that shows the variation of paramagnetic susceptibility S with temperature T, we can follow these steps:
1. Understand the Relationship: According to the Curie law, the paramagnetic susceptibility S is inversely proportional to the temperature T. This can be mathematically expressed as:
S∝1T
2. Express the Relationship Mathematically: We can write the relationship as:
S=CT
where C is the Curie constant.
3. Identify the Type of Graph: The equation S=CT can be rearranged to show that as T increases, S decreases. This indicates a hyperbolic relationship.
4. Graph Characteristics: The graph of S versus T will show a downward curve, starting from a higher value of S when T is low and approaching zero as T increases.
5. Select the Correct Option: Among the given options, we need to identify the graph that depicts this inverse relationship. The correct graph will show a hyperbolic decline of S with increasing T.
6. Conclusion: After analyzing the options, we find that the graph corresponding to the equation S=CT is the one that correctly represents the variation of paramagnetic susceptibility with temperature.
Final Answer:
The correct graph showing the variation of paramagnetic susceptibility S with temperature T is Option 3.
S∝1T
S=CT
where C is the Curie constant.
The correct graph showing the variation of paramagnetic susceptibility S with temperature T is Option 3.
Similar Questions
Knowledge Check
Which one is the correct graph which gives the variation of magnetic susceptibility (x) with tempperature for a diamagnetic substacne?
A B
B C
C D
D
The graph which represents the variation of mean kinetic energy of moleules with temperature ∘C is ?
A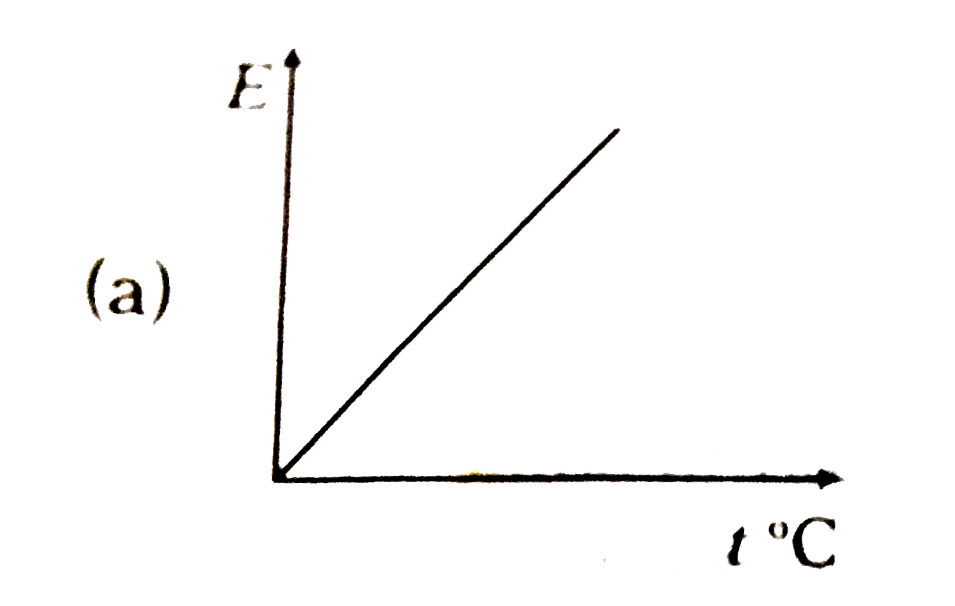 B
B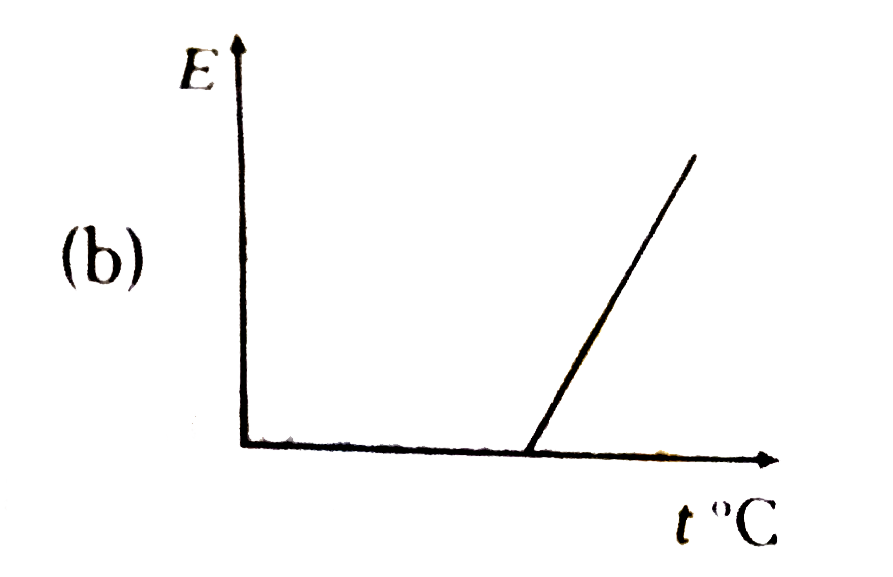 C
C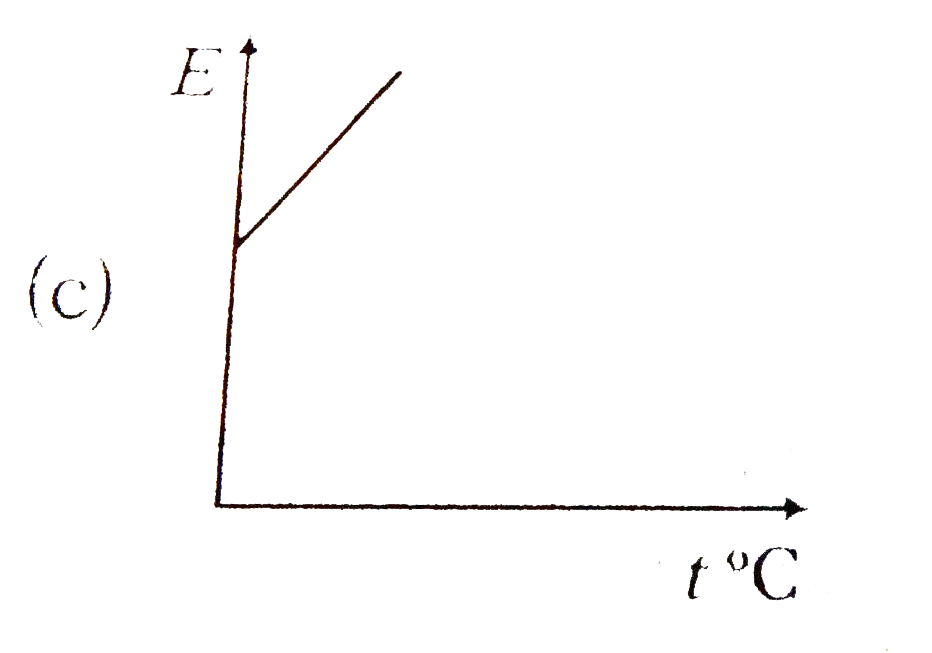 D
D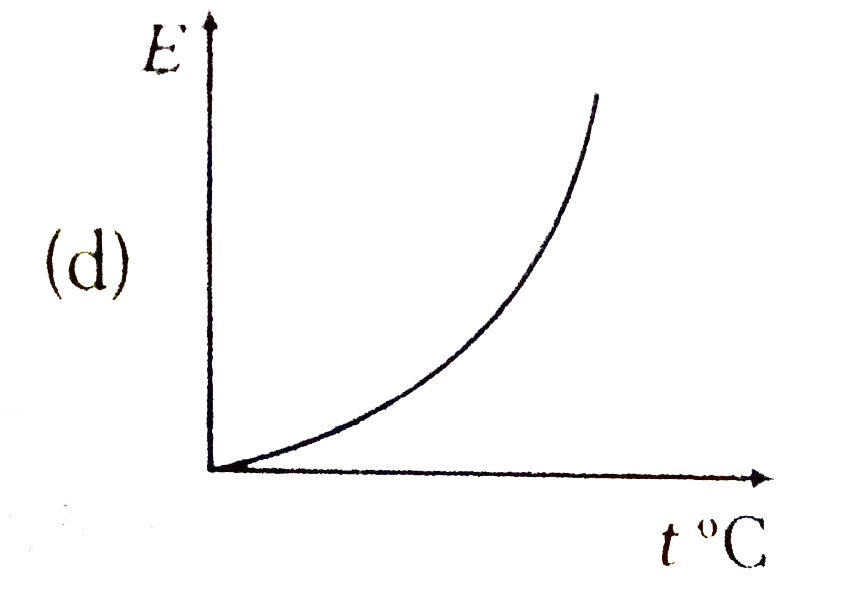
The variation of magnetic susceptibility (x) with temperature (T) for a diamagnetic material is best represented by
A B
B C
C D
D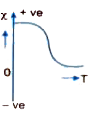
The variation of magnetic susceptibility (χ) with absolute temperature T for a ferromagnetic material is
View Solutionwhich of the following graph represents the variation of resistivity (ρ) with temperature (T) for copper?
View SolutionThe variation of magnetic susceptibility (χ) with temperature for a diamagnetic substance is best represented by
View SolutionThe variation of magnetic susceptibility (χ) with temperature for dimagnetic substance is represented by
View SolutionThe variation of magnetic susceptibility (χ) with temperature for a diamagnetic substance is best represented by
View Solution

