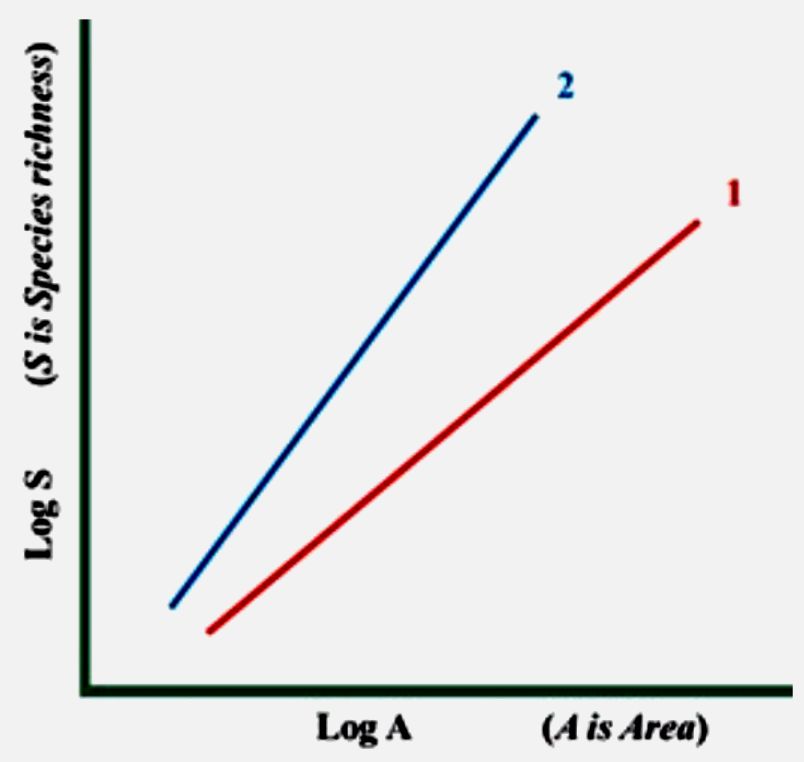
Observe the graph of area versus species richness and select the options that explain lines 1 and 2.

1 - Molluscs in New York State and 2 - plants in Britain
1 - plants in Britain and 2 - birds in California
1 - frugivorous birds and mammals in the tropical forests of different continents and 2 - plants in Britain
1 Molluscs in New York state and 2 frugivorous birds and mammals in the tropical forests of different continents
The correct Answer is:D
Step by step video & image solution for Observe the graph of area versus species richness and select the options that explain lines 1 and 2. by Biology experts to help you in doubts & scoring excellent marks in Class 12 exams.
Updated on:21/07/2023Similar Questions
Which of the two graphs will be a straight line at constant temperature ? P versus V or P versus 1/V ? Explain.
View SolutionWhich of the two graphs will be a straight line at constant temperature P versus V or P versus 1/V Explain.
View SolutionThe graph between logk versus 1/T is a straight line.
View SolutionRelationship between species richness (S) and area (A) represent in the following graph is described by the equation
View SolutionObserve the graph of area versus species richness and select the options that explain lines 1 and 2.
View SolutionWhich of these examples will have the steepest curve when log of species richness and log of area are plotted on a graph?
View SolutionWho observed that within a region, species richness increased with increasing explored area but only upto a limit?
View SolutionWho observed that within a region, species richness increased with increasing explored area but only up to a limit?
View Solution
