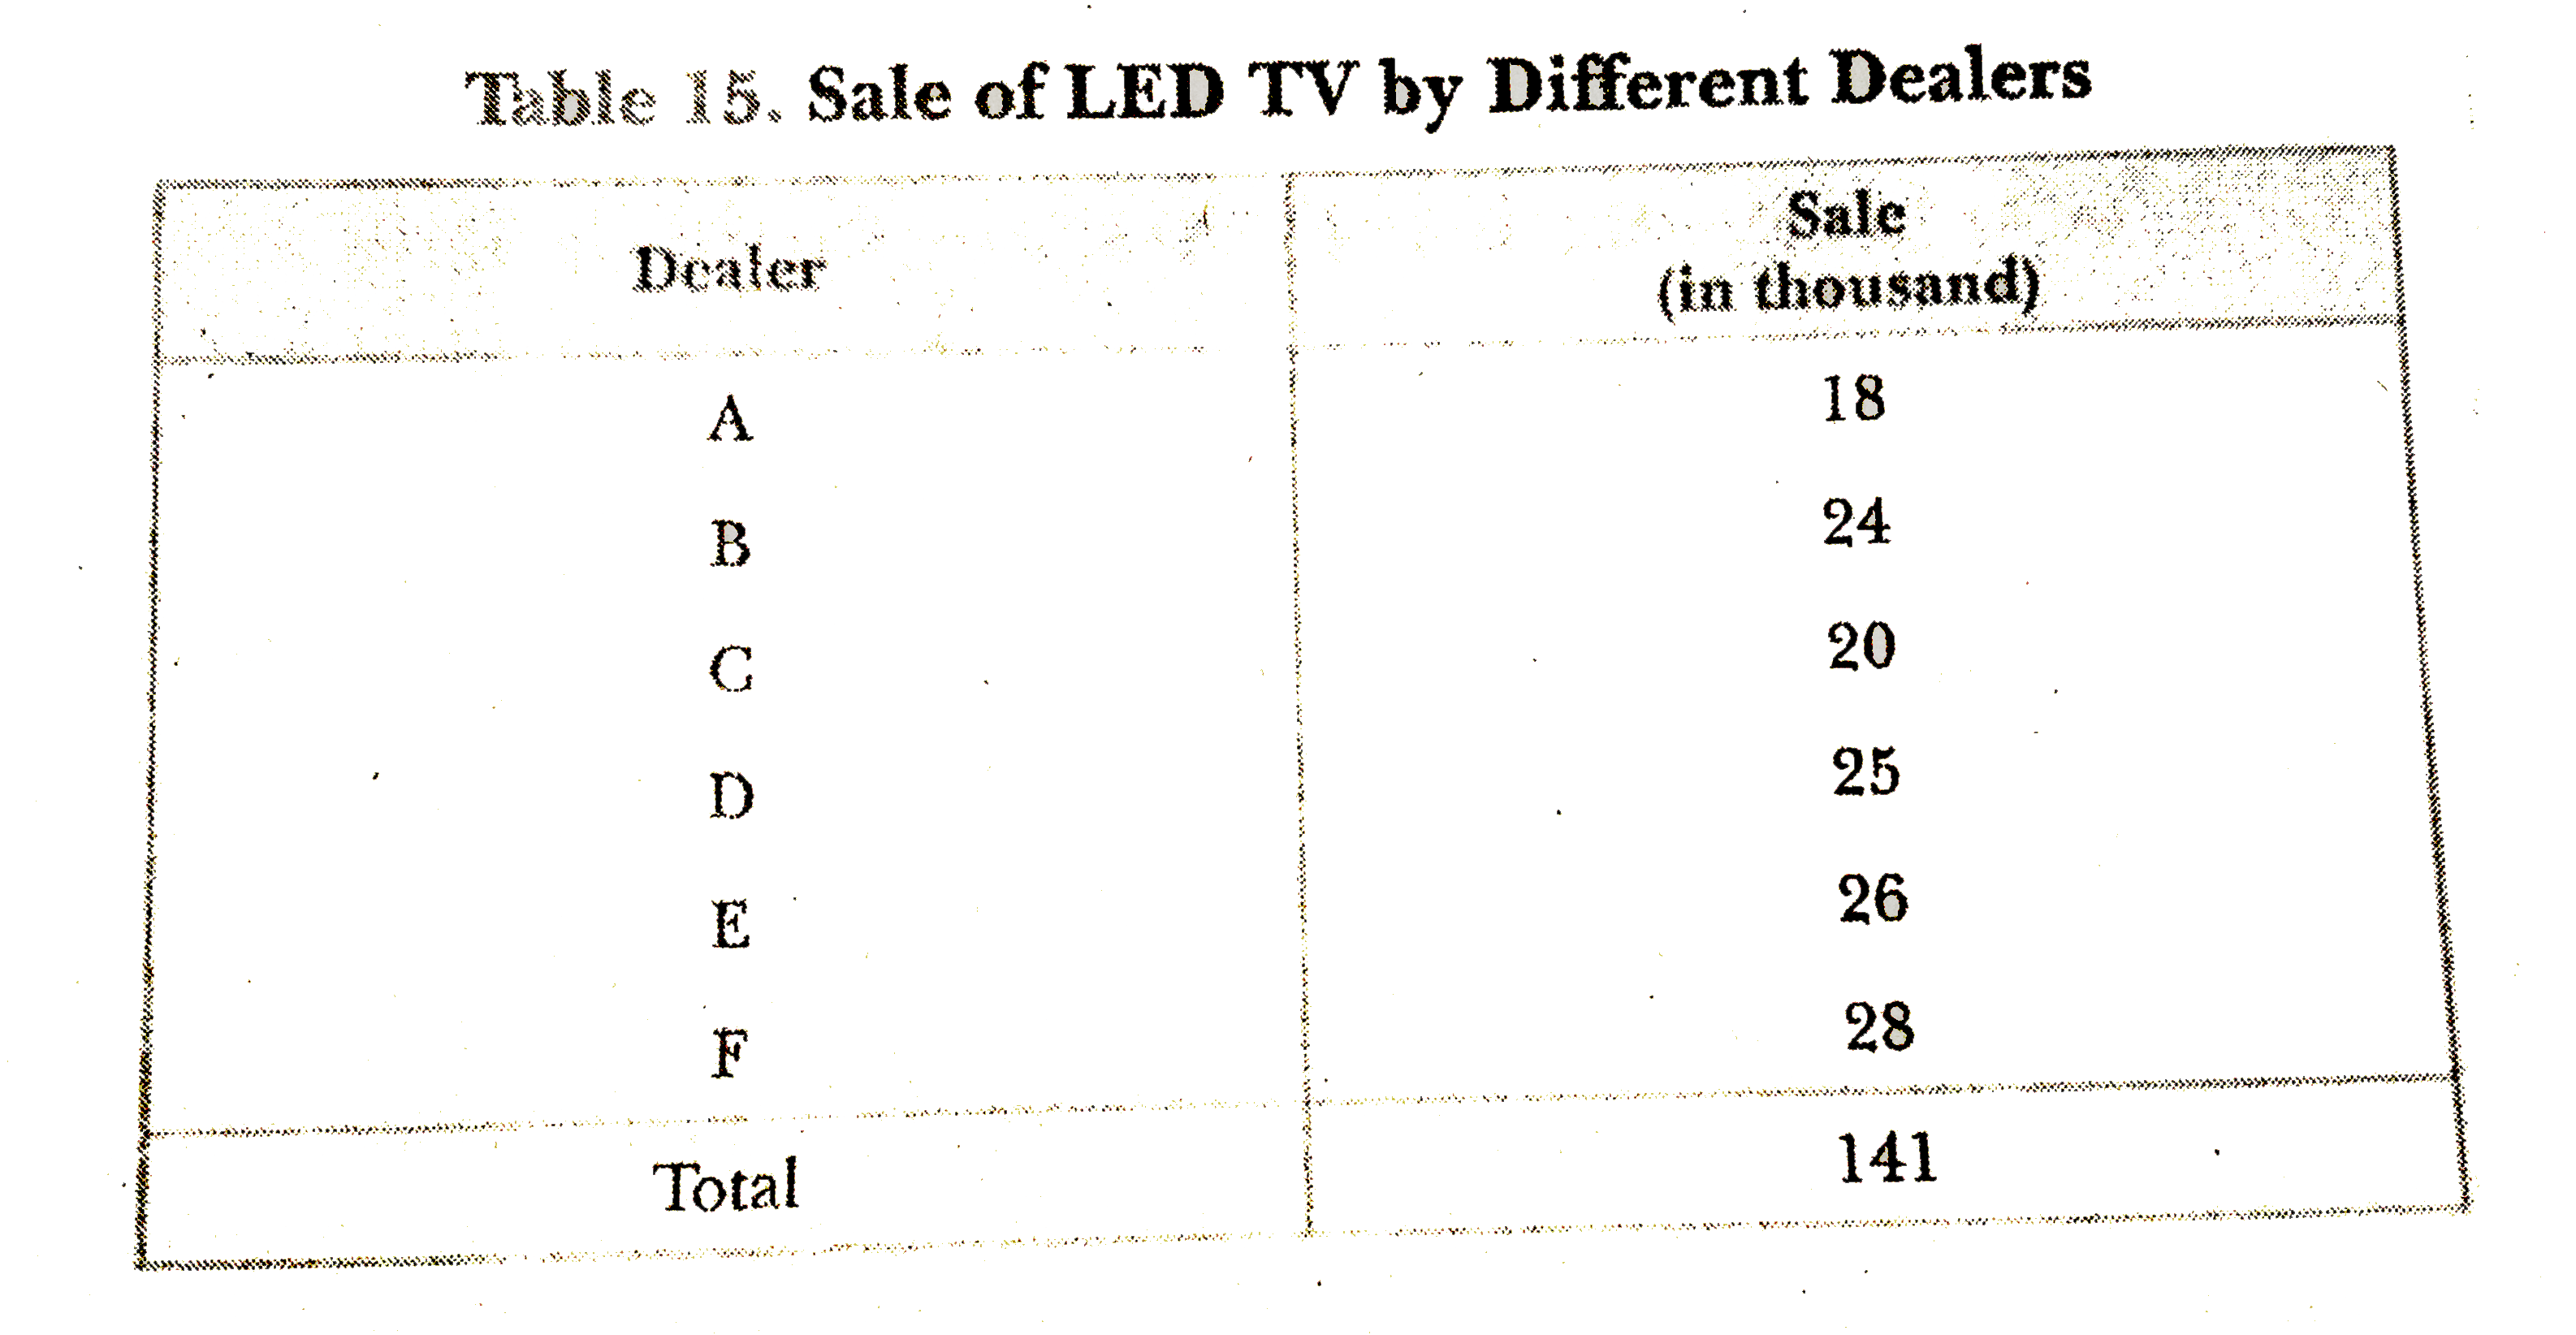
Given the following data, draw a table showing the sale if LED TV by different dealers.

The correct Answer is:N/a
Similar Questions
Direction: The following table shows the data of people of five different cities. Study the following table and answer the following questions.
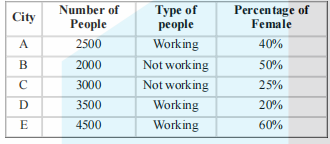
The total number of males who are working out of five cities is-
View SolutionPresent the following data by a devidation bar diagram showning the difference between sale proceeds and cost of a firm

View Solution
Knowledge Check
Directions for questions : These questions are based on the following data. Read the following bar graph and answer the following.
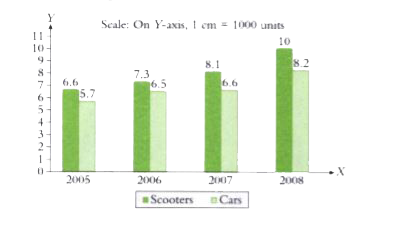
Find the maximum difference between sales of scooters and that of cars, in any year, in the given period.A1500B1700C1800D2000Directions for questions : These questions are based on the following data. Read the following bar graph and answer the following.
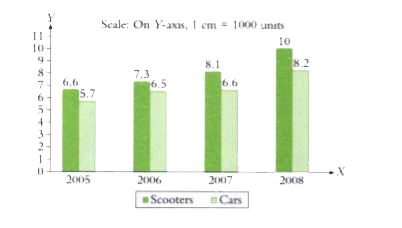
In which year is the difference between the sales of the scooters and the sales of cars the least?A2005B2006C2007D2008
The following table shows the interest of students of a school in different games :

Represent the data by using a simple bar diagram.
View SolutionThe daily sale of 100 vegetable vendors is given in the following table. Find the mean of the sale by direct method.

View SolutionThe following table shows the percentage of buyers of four different brands of bathing soaps.

Represent the above data by a pie chart.
View SolutionThe following table shows the number of students in different classes of a high school. Draw a histogram to represent the given data.
ClassesVIVIIVIIIIXXNumber of students3742355048
View SolutionDirections for questions : These questions are based on the following data. Read the following bar graph and answer the questions.
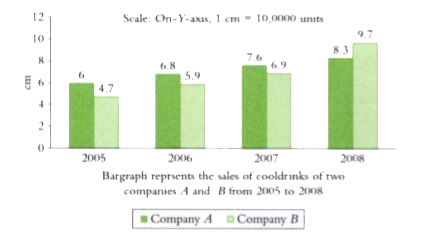
Find the maximum difference between the sales of A and sales of B in any year in the given period.
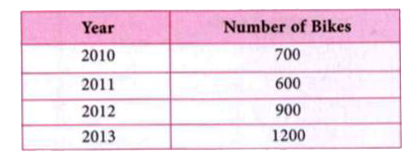
View SolutionDraw a bar graph using the data given in the following table, which shows the number of bikes manufactured in a factory during the years 2010 to 2013.
View Solution


