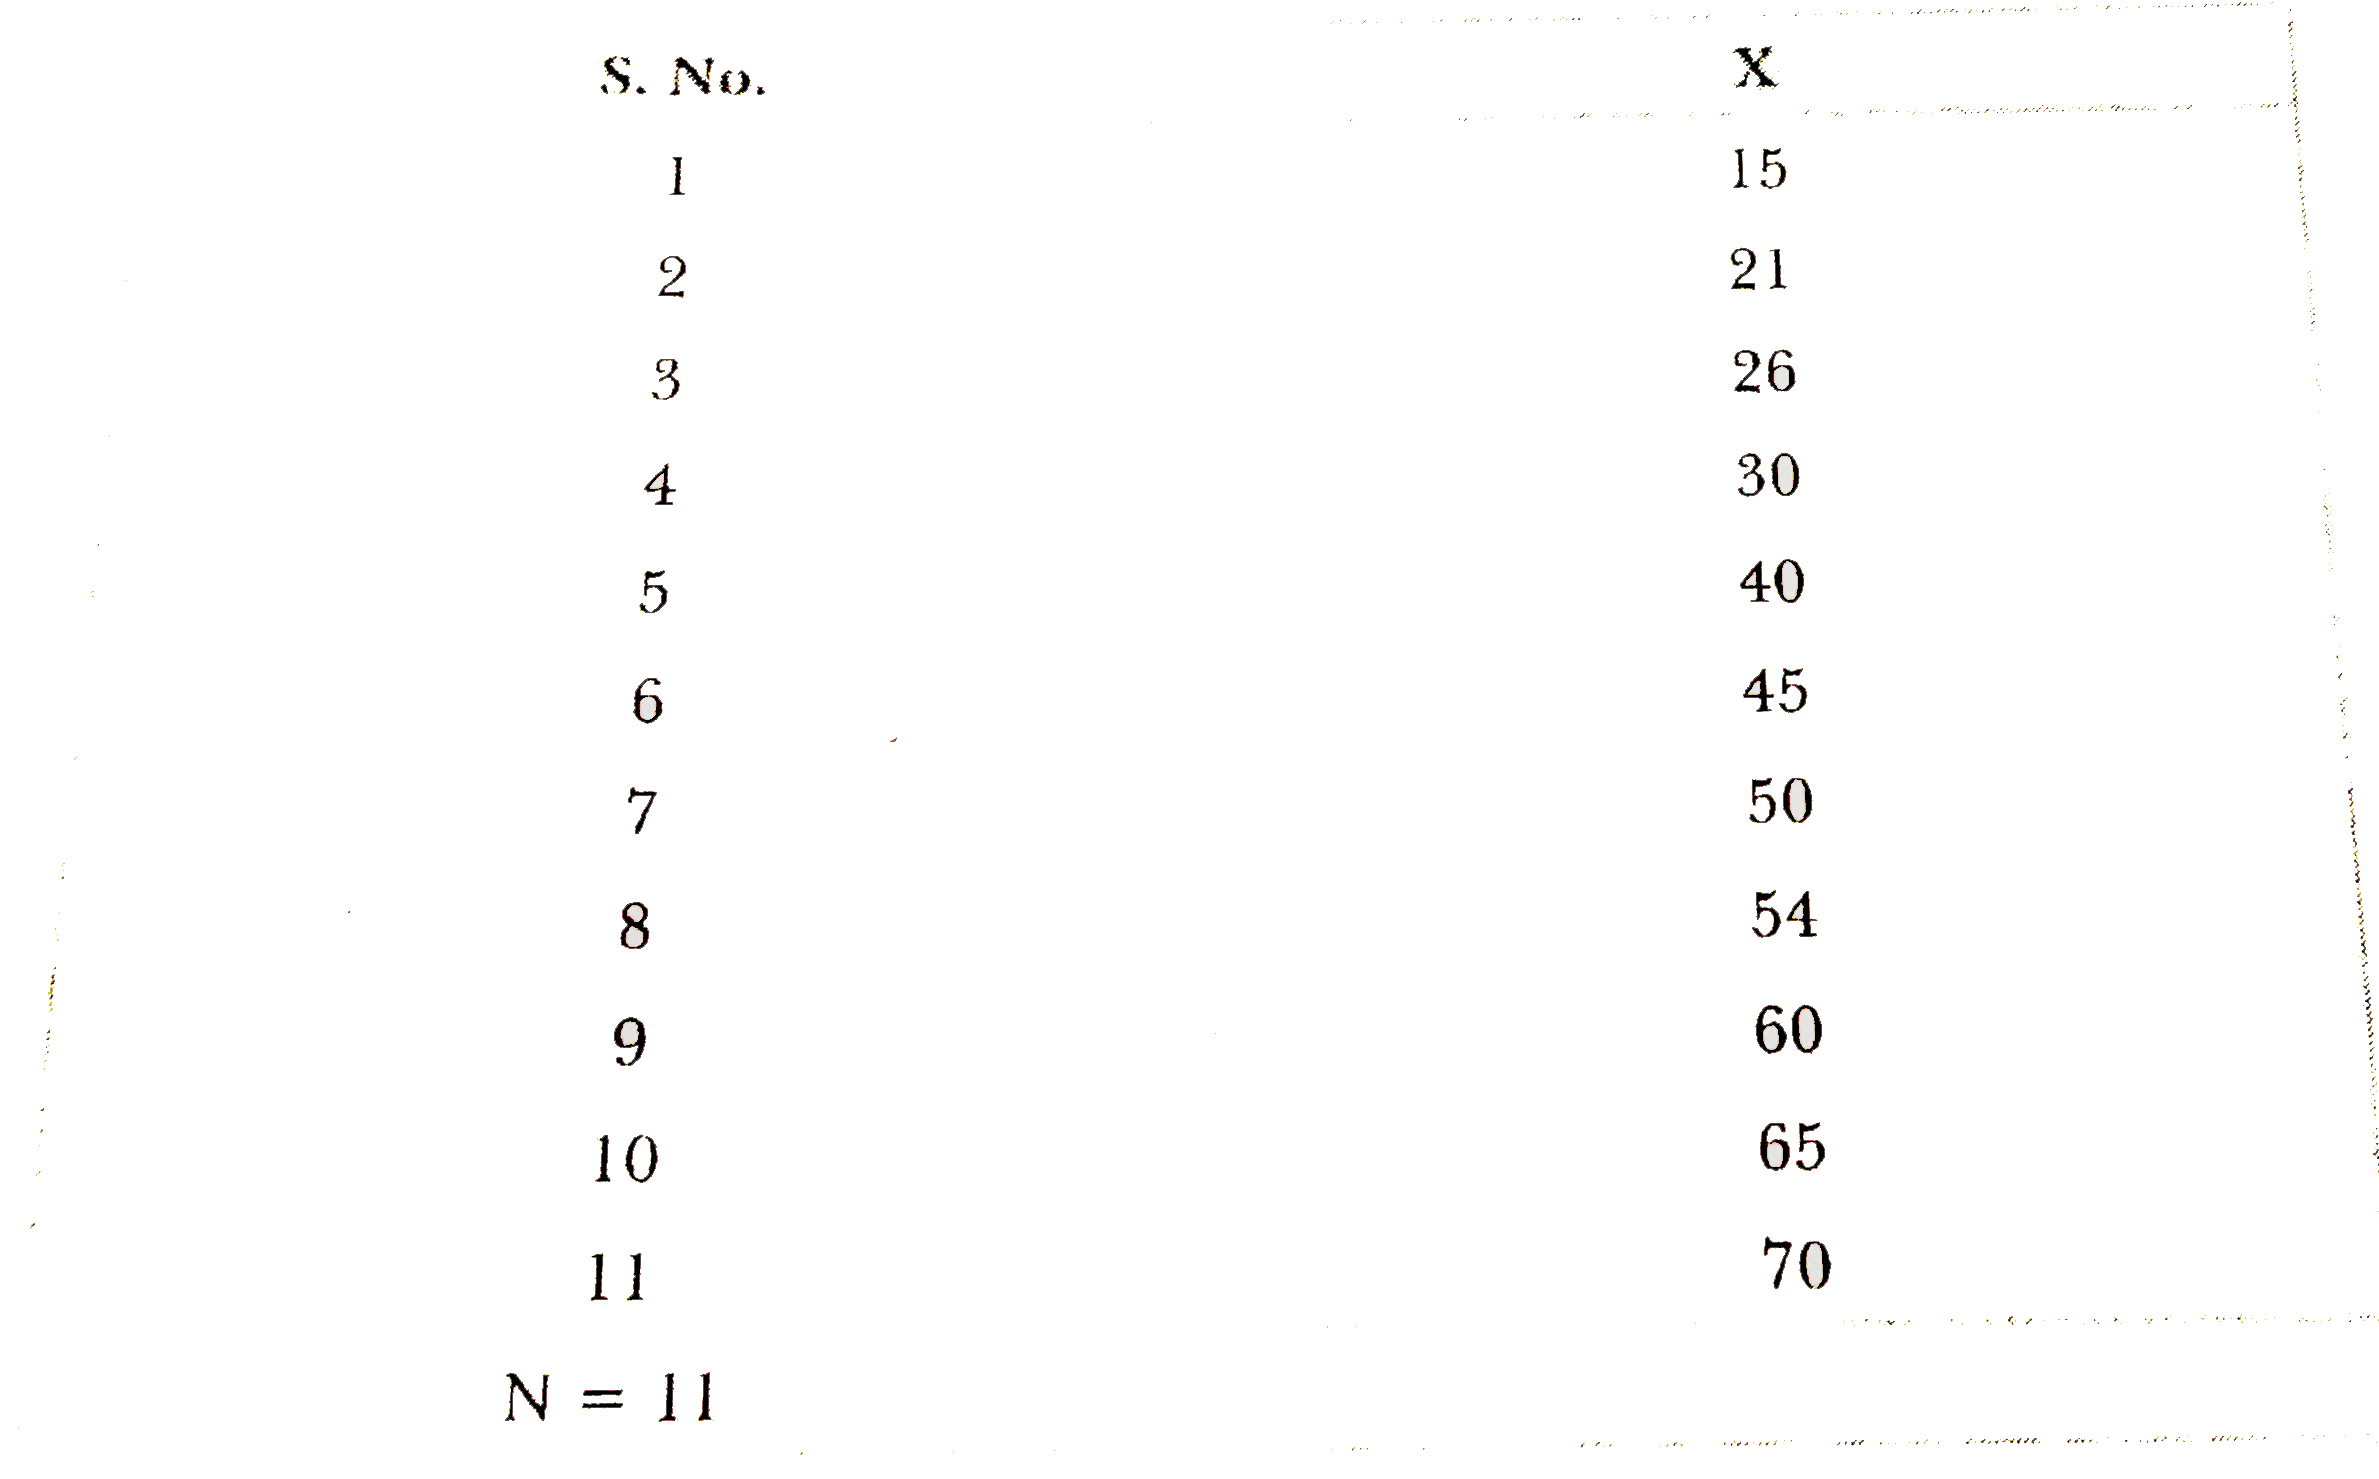
From the following data , calculate Q1,Q3,D5andP25.
S.No.2115403026455054606570
The data is first arranged in ascending order :

Q1 = Size of (N+14) th item
= Size of (11+14) th item
= Size of 3rd item =26
Q3= Size of 3(N+14)th item
= Size of 3 (11+14)th item
= Size of 9th item =60
D5 = Size of 5(N+110) th item
= Size of 5(11+110) th item
= Size of 6 th item =45
P25 = Size of 25(N+1100) th item
Size of 25(11+1100) th item
= Size of 3rd item =26
Thus ,Q1=26,Q3=60,D5=45,P25=26.
Similar Questions
Knowledge Check
For the following data the value of Q1+Q3−Q2, is
Age in years:20304050607080No. of members:361132153140513AQ1BQ2CQ3D2Q2
Calculate Q1,Q3,D7andP89 from the following data :
Size1234567891011Frequency581522364428171293
View SolutionCalcilation Q1,Q3,D6andP85 from the following data :
Size101112131415161718Frequency34512107521
View Solution50 students of economics , secured the following marks in an examination :
Marks20−2525−3030−3535−4040−4545−5050−5555−6060−6565−70Students 6 3 7 4 6 4 2 8 3 7
Caculate median.
View SolutionGiven the following data , find out median :
Age20−2525−3030−3535−4040−4545−5050−5555−60Number of Students 50 70 100 180 150 120 70 60
View SolutionEstimate the mode of the following data from the histogram.
Class Interval0−1010−2020−3030−4040−5050−6060−7070−80Frequency810151620131412
View SolutionCalculate the median from the following data - set :
Size10−1515−17.517.5−2020−3030−3535−4040−50Frequency 10 15 17 25 28 30 40
View SolutionFind the median of the following data: class : 0−10,equency:5, 10−20,3, 20−30,4, 30−40,3, 40−50,3,50-60 , 4,60-70 , 7, 70-80 , 9,80-90 , 7,90-100 , 8,
View Solution
