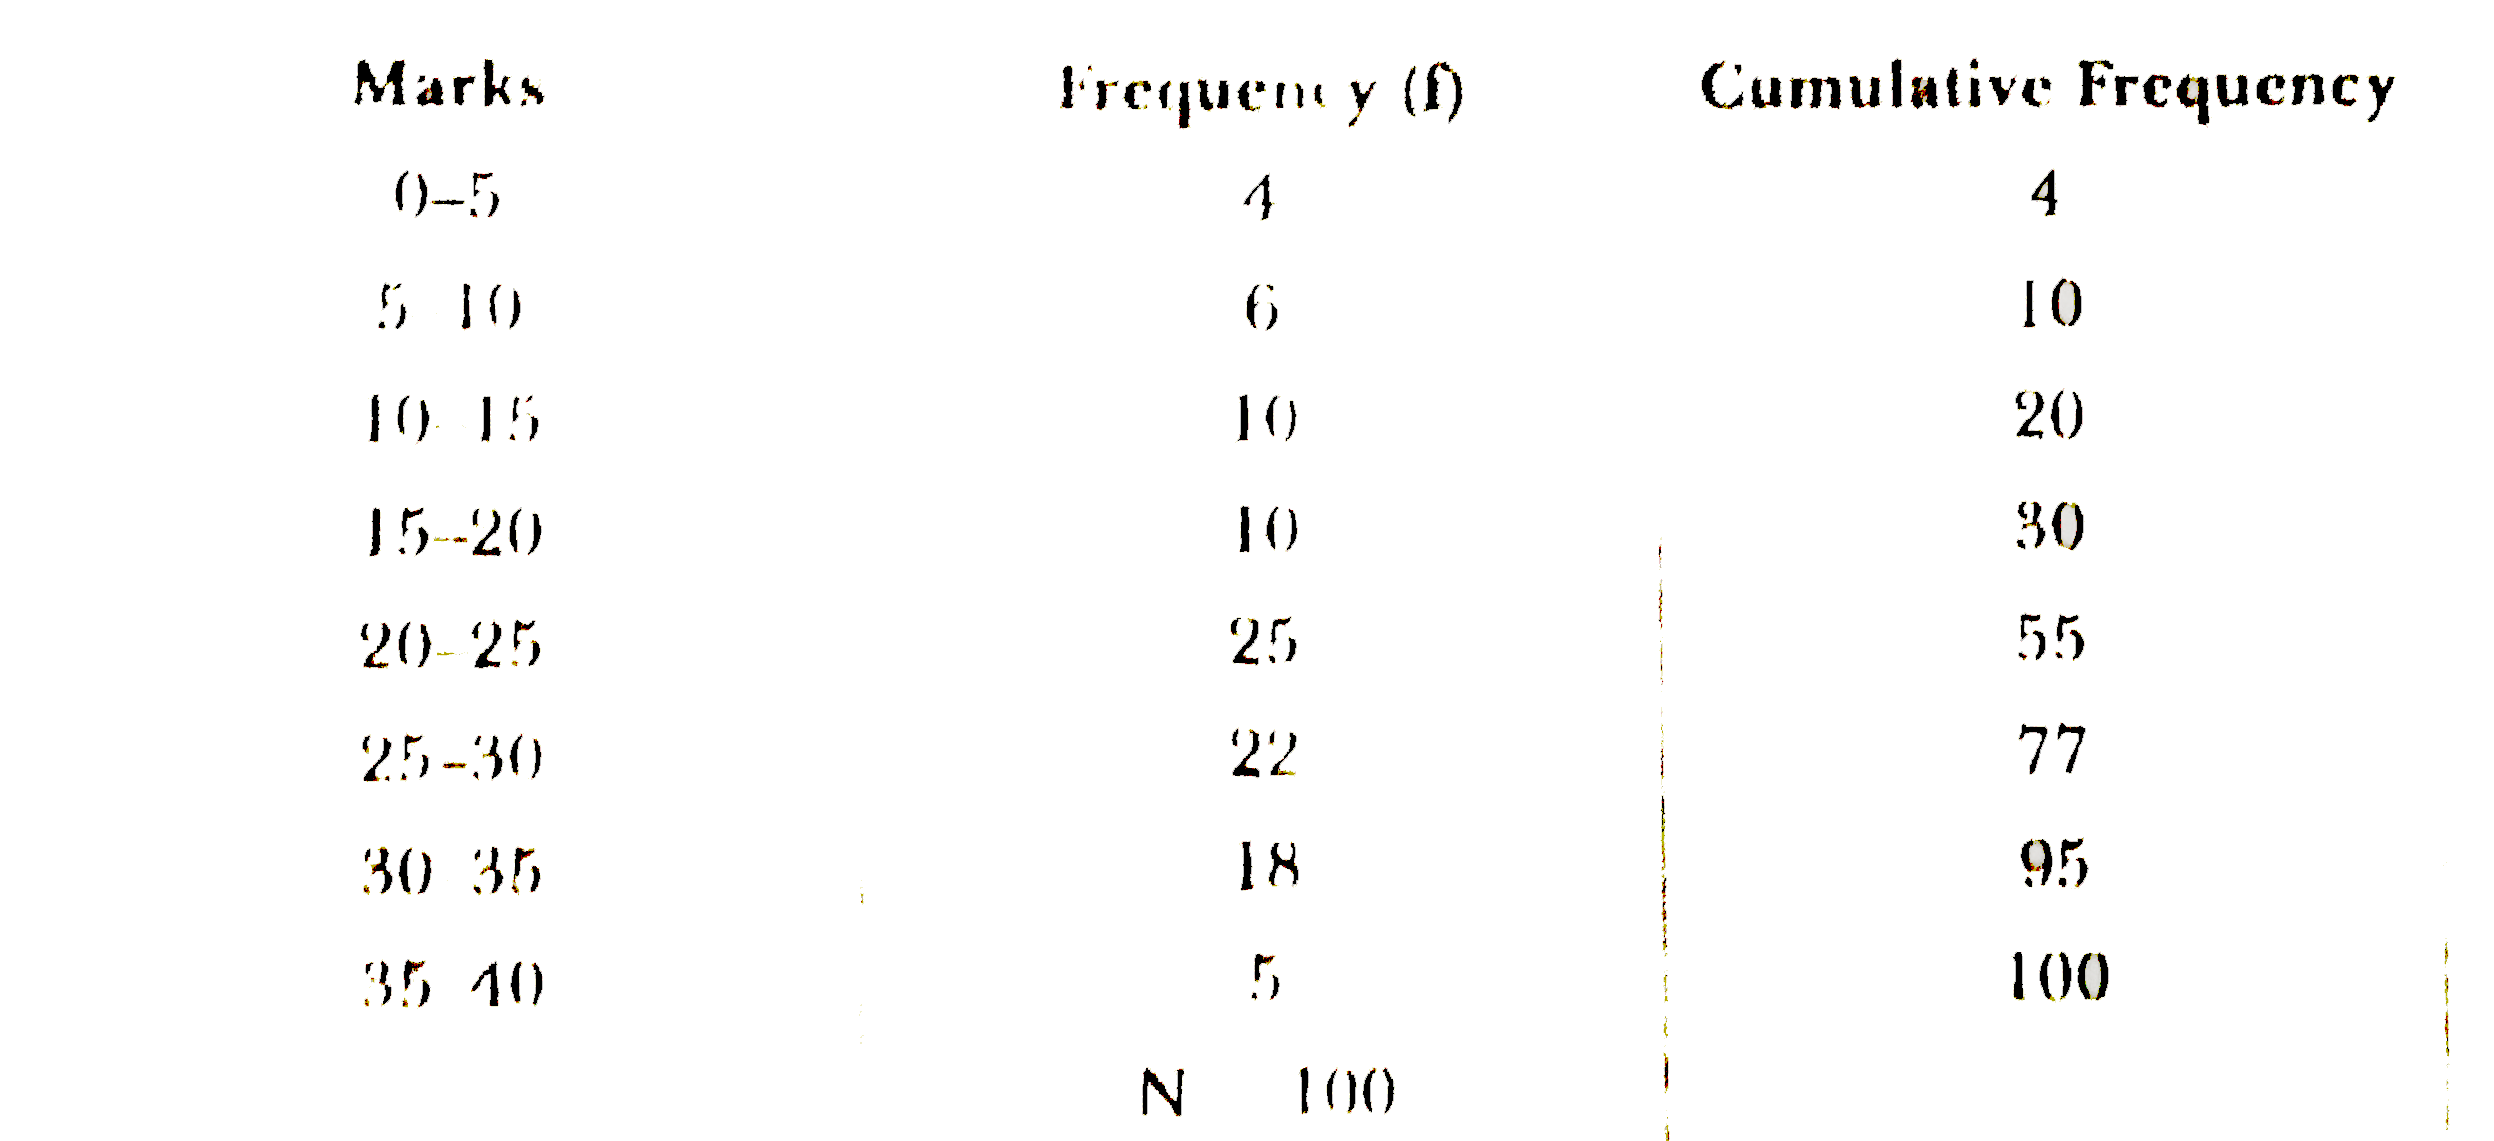
The marks obtained by 100 students of a school are given below.
Marks0−55−1010−1515−2020−2525−3030−3535−40No . of Students 4 6 10 10 25 22 18 5
Find out Q1,Q3,D6andP95.

Q1 = Size of (N4) th item
= Size of (1004) th item
= Size of 25th item
25th item lies in the calss intervals 15-20.
Q1=l1N4−c.f.f×i
=15+1004−2010×5
=15+25−2010×5=15+510×5
=15+2.5
=17.5
Q3 = Size of 3(N4)th item
= Size of 3(1004) th item = Size of 75th item
75th item lies in the class interval 25-30.
Q3=l1+3(N4)−c.f.f×i
=25+3(1004)−c.f.22×55
=25+75−5522×5=25+2022×5
=25+4.55=29.55
D6 Size of 6(N10) th item = Size of 6(10010)th item = Size of 60th item
60 th item lies in the class interval 25-30.
D6=l1+6(N10)−c.f.f×i
=25+6(10010)−5522×5
=25+60=5522×5=25+522×5
=25+1.14=26.14
P95 = Size of 95 (N100) th item
= Size of (100100)th item
= Size of 95 th item
95th item lies in the class interval 30-35.
P95=l1+95(N100)−c.f.f×i
=30+95(100100)−7718×5
=30+95−7718×5=30+1818×5
=30+5=35
Q1=17.5,Q3=29.55,D6=26.14,P95=35.
Topper's Solved these Questions
Similar Questions
Determine median value of the following series using graphic method :
Marks0−55−1010−1515−2020−2525−3030−3535−40Number of students 4 6 10 10 22 25 18 5
View SolutionThe following table gives the marks obtained by some students.
Calculate the median marks obtained by the students.
Marks0−55−1010−1515−2020−2525−3030−3535−4040−45Number of Students 6 12 17 30 10 10 8 5 2
View Solution
Knowledge Check
The value of Q3 for the following distribution is
Marks group:5−1010−1515−2020−2525−3030−3535−4040−45No of Student:5615105421A15B21.5C25D25.5
Find out mode from the following data :
Class Interval5−1010−1515−2020−2525−3030−3535−40Number of Childern 4 5 3 2 6 7 3
View SolutionCaculate the mode from the following data :
Wages (Rs.)0−55−1010−1515−2020−2525−3030−35Number of Workers 3 7 15 30 20 10 5
View SolutionDistribution of marks obtained by 100 student of a class is given below . Find out the median marks
Marks051015202530354045Number of Students46155812281435
View SolutionCalculate mode of the following sercies :
Class Interval0−55−1010−1515−2020−2525−3030−35Frequency 1 2 10 4 10 9 2
View SolutionCalculate the mean marks from the following data:
Marks20−2525−3030−3535−4040−4545−5050−55No. of Students 10 12 8 20 11 4 5
View SolutionCalculate the mean marks from the following data:
Marks20−2525−3030−3535−4040−4545−5050−55No. of Students 10 12 8 20 11 4 5
View SolutionCaculate mode of the following data :
Marks0−55−1010−2020−4040−6060−8080−9090−100Number of Students 5 7 9 25 30 24 8 6
View Solution
