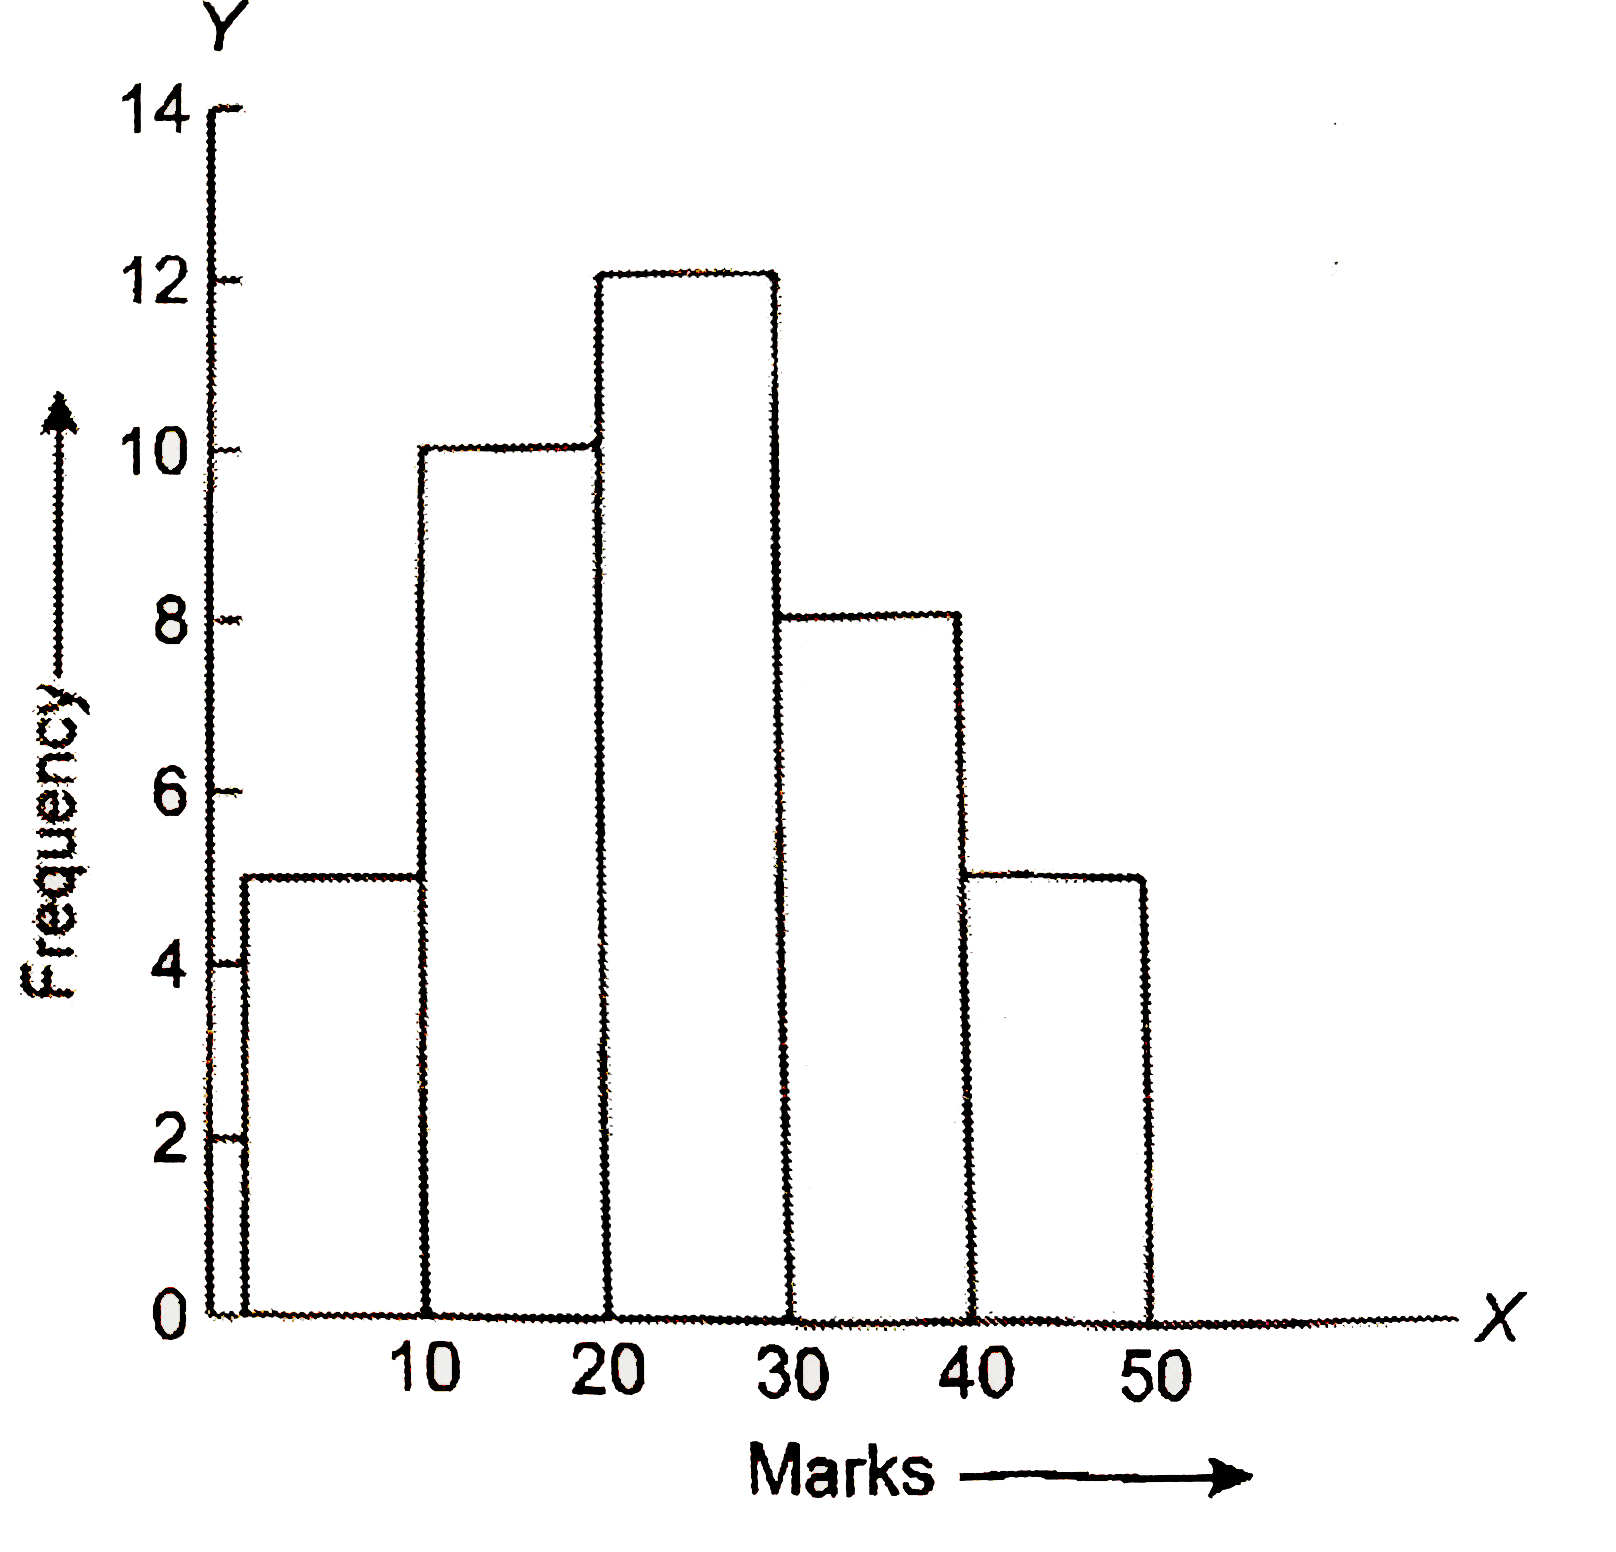
In a class of 40 students, the marks obtained (out of 50) are as given below:

Draw a histogram to represent the given data.
1. Taking suitable scales, mark the class intervals (marks) on the X-axis and frequency (the no. of students) on Y-axis.
2. Construct rectangles with class intervals as bases and the corresponding frequencies as heights.

Topper's Solved these Questions
- STATISTICSBook:NAGEEN PRAKASHANChapter:STATISTICSExercise:Problems From NCERT/exemplar
Explore 22 Videos
- STATISTICSBook:NAGEEN PRAKASHANChapter:STATISTICSExercise:Exercise 14a
Explore 10 Videos
- QUADRILATERALSBook:NAGEEN PRAKASHANChapter:QUADRILATERALSExercise:Revision Exercise (long Answer Questions)
Explore 5 Videos
- SURFACE AREA AND VOLUMEBook:NAGEEN PRAKASHANChapter:SURFACE AREA AND VOLUMEExercise:Revision Exercise (long Answer Questions)
Explore 10 Videos
Similar Questions
Draw a histogram to represent the following data.

View SolutionDraw the histogram to represent the following data.

View SolutionDraw a pictograph to represent the data given below :

View SolutionThe marks obtained (out of 100) by a class of 80 students are given below:

Construct a histogram to represent the data above
View SolutionThe ages (in years) of 360 patients treated in a hospital on a particular day are given below:

Draw a histogram for the given data.
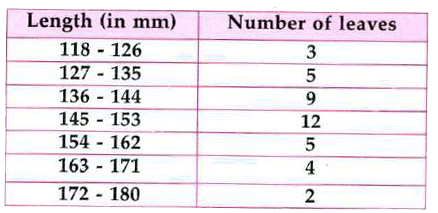
View SolutionThe length of 40 leaves of a plant are measured correct to nearest millimetres. The data obtained is as follows :

Draw histogram to represent the given data.
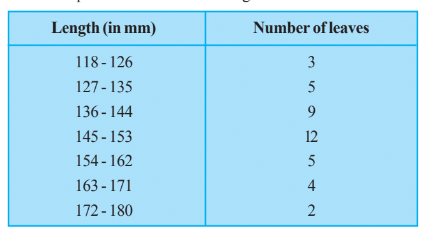
View SolutionThe length of 40 leaves of a plant are measured correct to one millimetre, and the obtained data is represented in the following table:

Draw a histogram to represent the given data. [Hint: First make the class intervals continuous]
View SolutionThe length of 40 leaves of a plant are measured correct to one millimeter, and the obtained data is represented in the following table:

(i) Draw a histogram to represent the given data.
(ii) Is there any other suitable graphical representation for the same data?
(iii) Is it correct to conclude that the maximum number of leaves are 153 mm long?Why?
View SolutionThe length of 40 leaves of a plant measured correct to one millimetre and the obtained data is represented in the following table:

(i) Draw a histogram to represent the given data.
(ii) Is there any other suitable graphical representation for the same data?
(iii) Is it correct to conclude that the maximum number of leaves 153 mm long and why?
View SolutionThe marks scored by students in Mathematics in a certain examinations are given below:

Draw histogram for the above data.
View Solution
