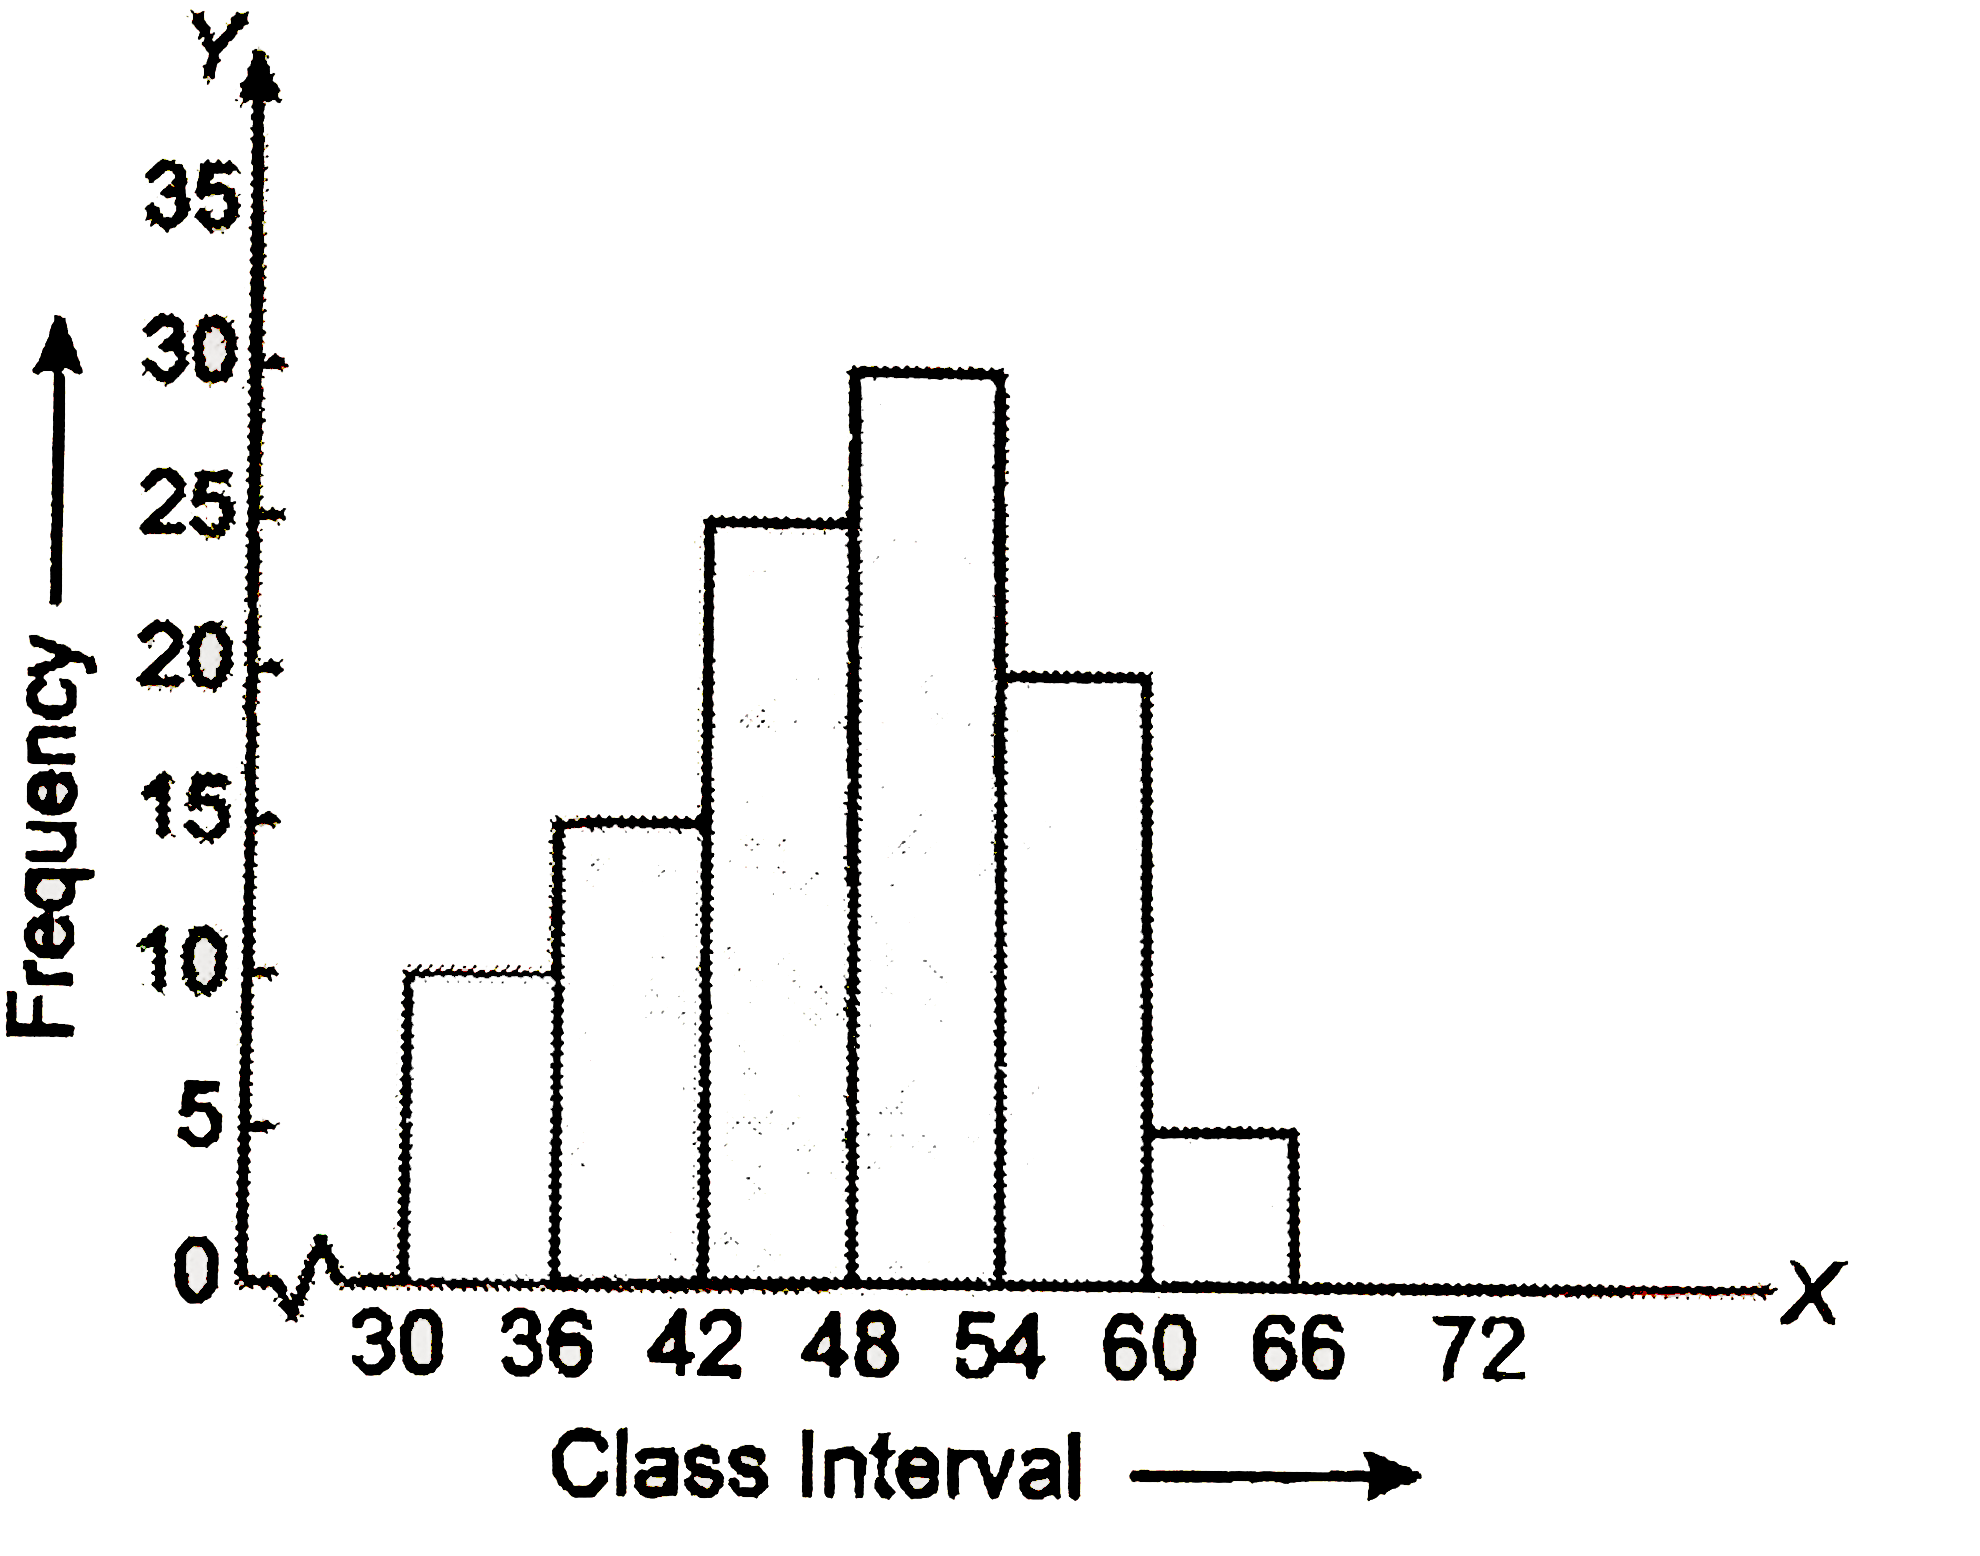
Draw a histogram to represent the following:

Scale:
Let 1 cm = 6 units on X-axis
1 cm = 5 units on Y-axis
Here, the class intervals starts from 30, a zig-zag curve is shown from 0 to 30

Topper's Solved these Questions
- STATISTICSBook:NAGEEN PRAKASHANChapter:STATISTICSExercise:Problems From NCERT/exemplar
Explore 22 Videos
- STATISTICSBook:NAGEEN PRAKASHANChapter:STATISTICSExercise:Exercise 14a
Explore 10 Videos
- QUADRILATERALSBook:NAGEEN PRAKASHANChapter:QUADRILATERALSExercise:Revision Exercise (long Answer Questions)
Explore 5 Videos
- SURFACE AREA AND VOLUMEBook:NAGEEN PRAKASHANChapter:SURFACE AREA AND VOLUMEExercise:Revision Exercise (long Answer Questions)
Explore 10 Videos
Similar Questions
The distance (in km) of 40 engineers from their residence to their place of work were found as follows.

Construct a grouped frequency distribution table with calss- size 5 for the data given above taking the first interval as 0-5 (5 not included). What main features do you observe from this tabular representation?
View SolutionStatistical Data : Primary Data and Secondary Data.
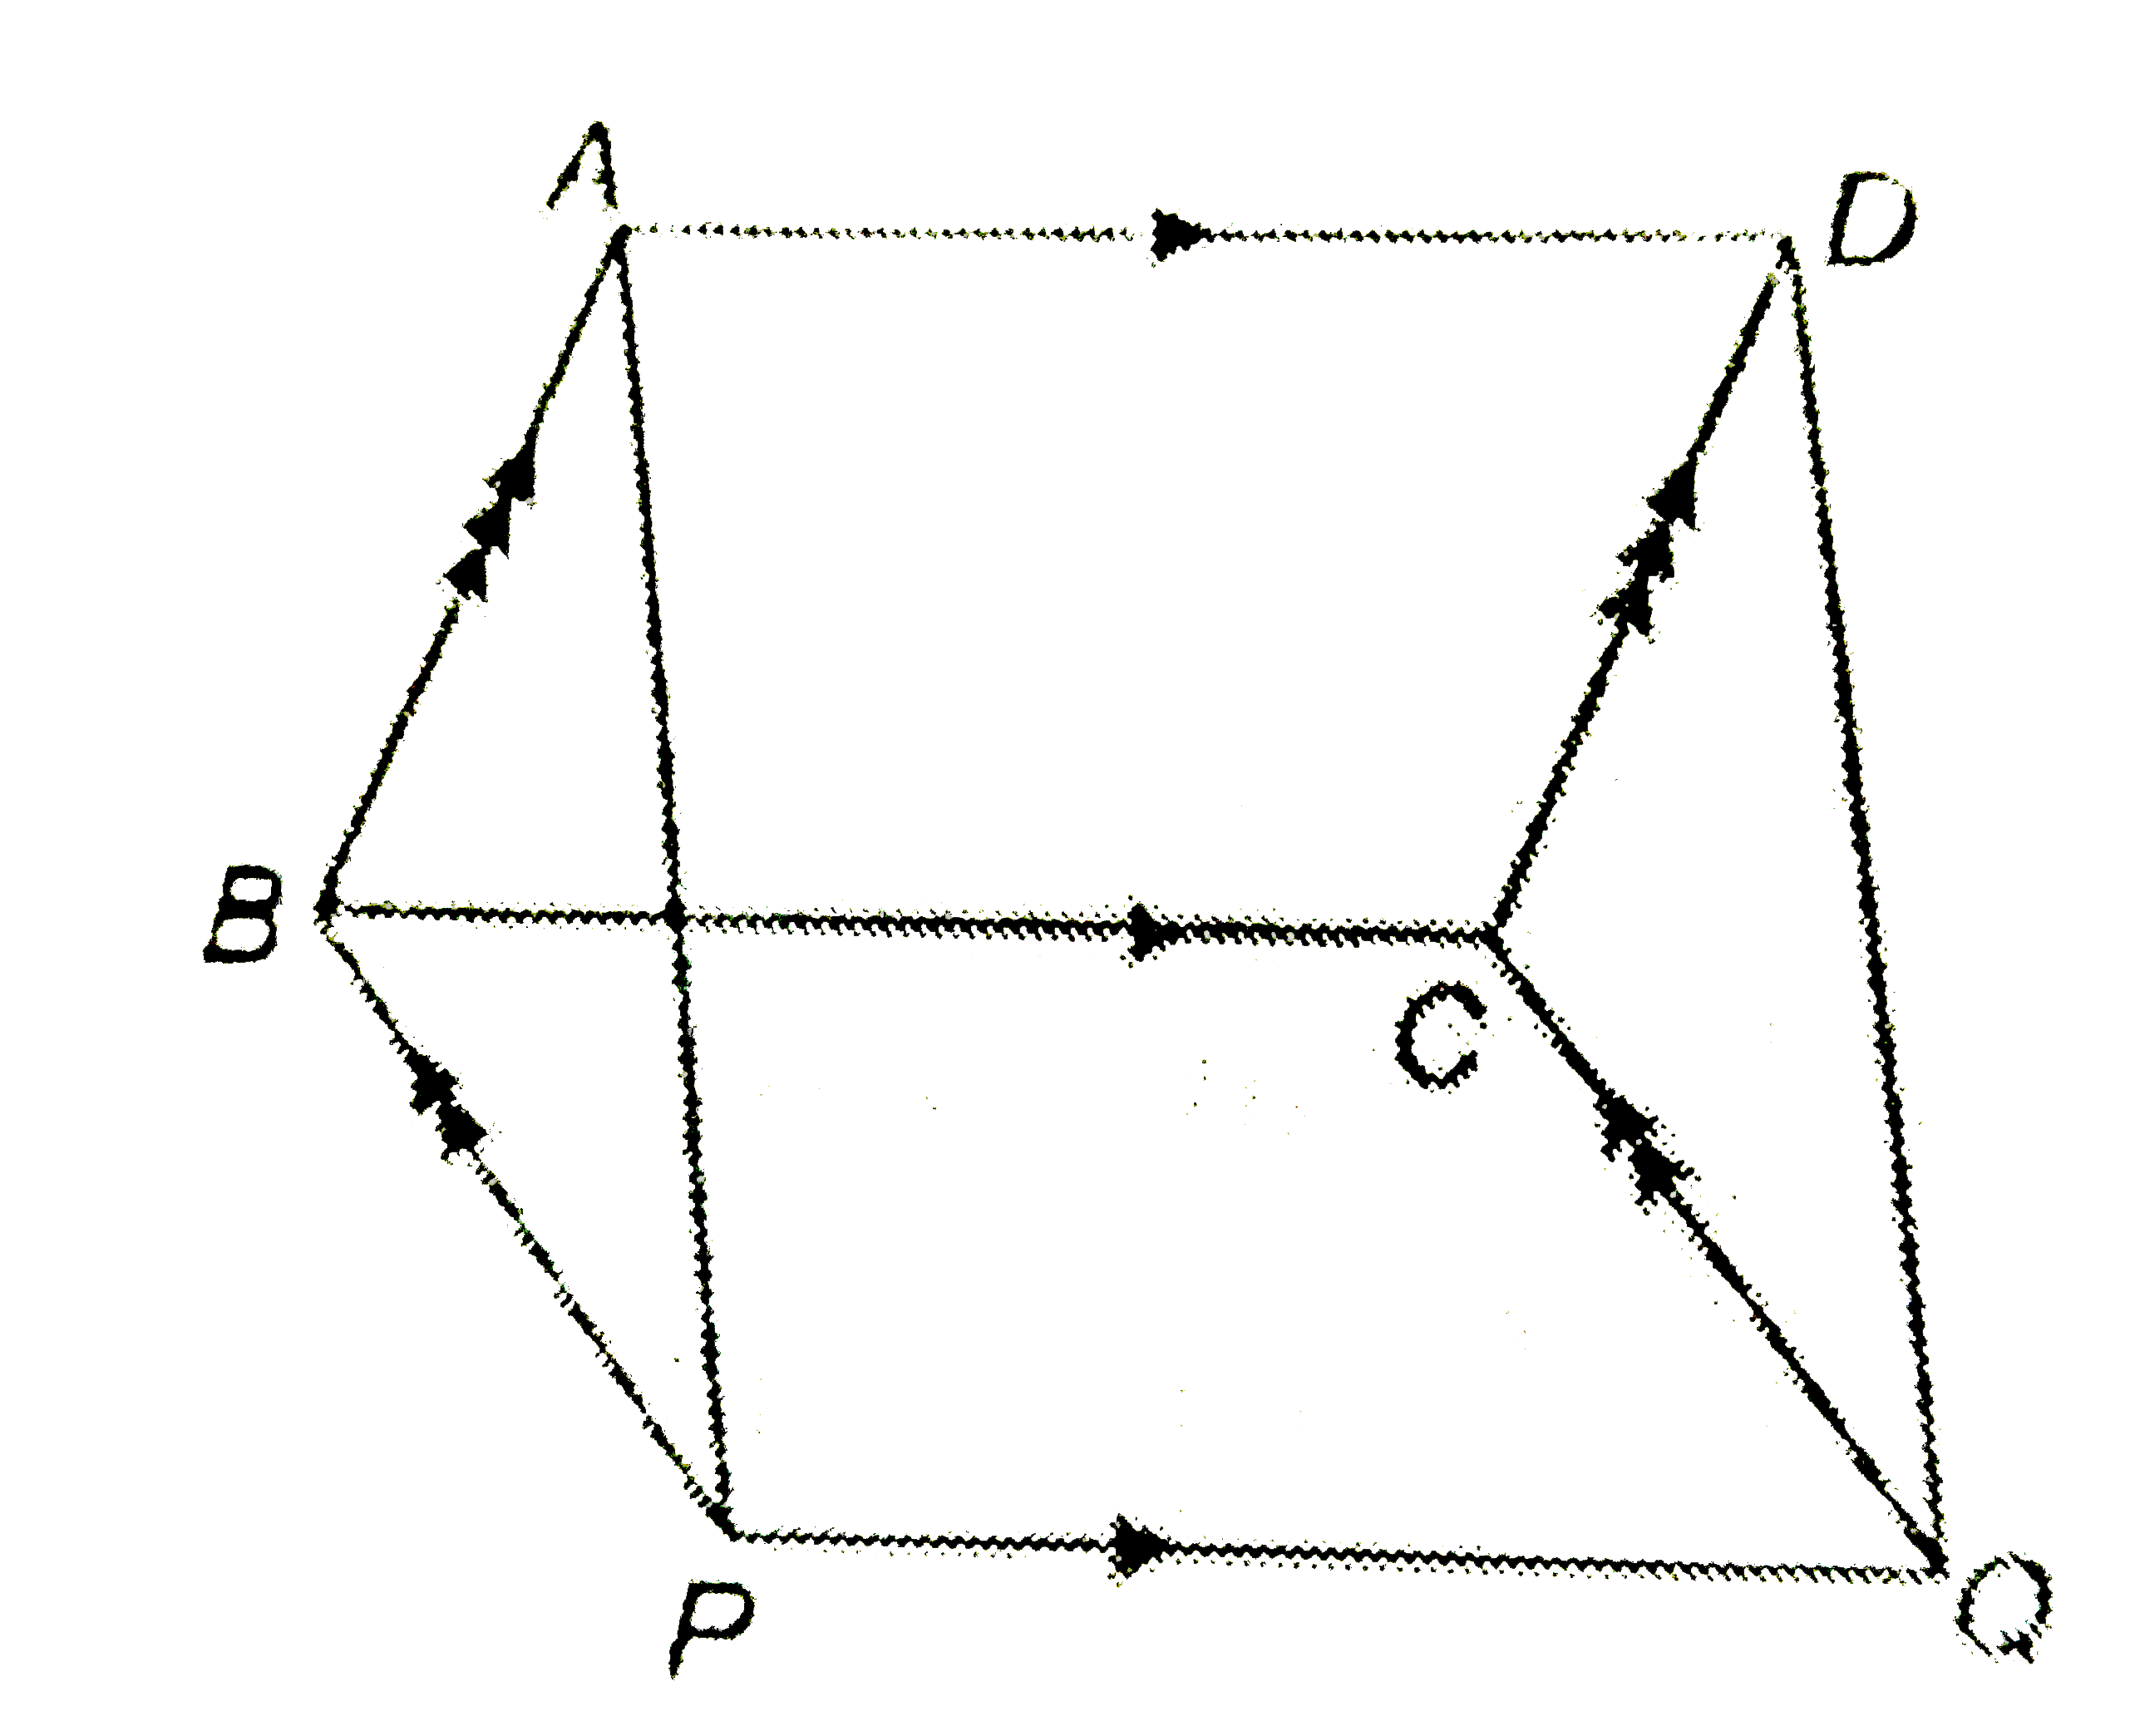
View SolutionIn the adjoining figure, ABCD and PBCQ are paralelograms. Prove that
ΔABP≅ΔDCQ

View SolutionHow many cubic metres of earth must be dug out to sink a well 14 m deep and having a radius of 4 m. If the earth taken out is spread over a plot of dimension (25m×16m). What is the height of the plateform so formed?
View SolutionMatch the following lists:

View SolutionHow many lines of symmetry does the above figure have ?
View SolutionWhich of the following are correct chain isomers of butane ? (i)
View SolutionDetermine the point of symmetry of a regular hexagon.
View SolutionDtermine the images of the following figure about the given line :
View SolutionDraw the bisector of ∠AOB=58∘
ltimg src="https://d10lpgp6xz60nq.cloudfront.net/physics_images/PS_MATH_VII_C05_S01_009_Q01.png" width="80%"gt
View SolutionMatch the following Column A to Column B

View SolutionMatch the following Column A to Column B

View SolutionMatch the following Column A to Column B

View SolutionThe inequation represented by the graph given below is :
View SolutionThe inequation that best describes the graph given below is _________
View SolutionThe inequation that best describes the following graph is _________
View Solution
