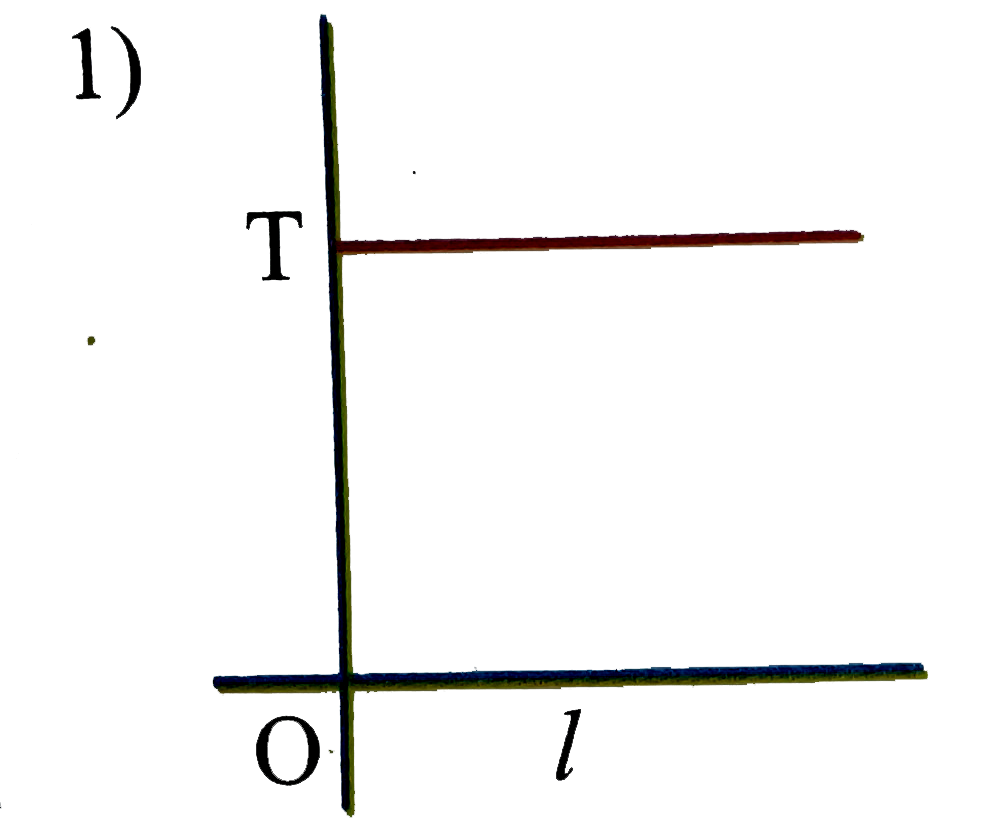
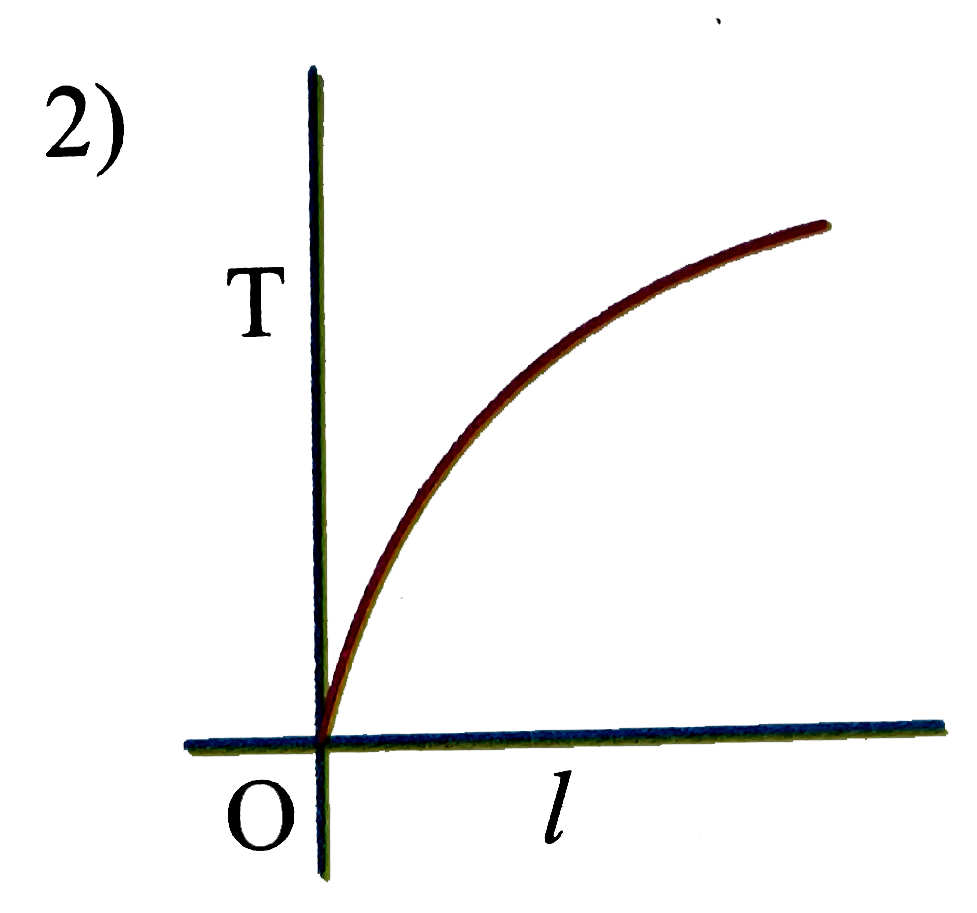
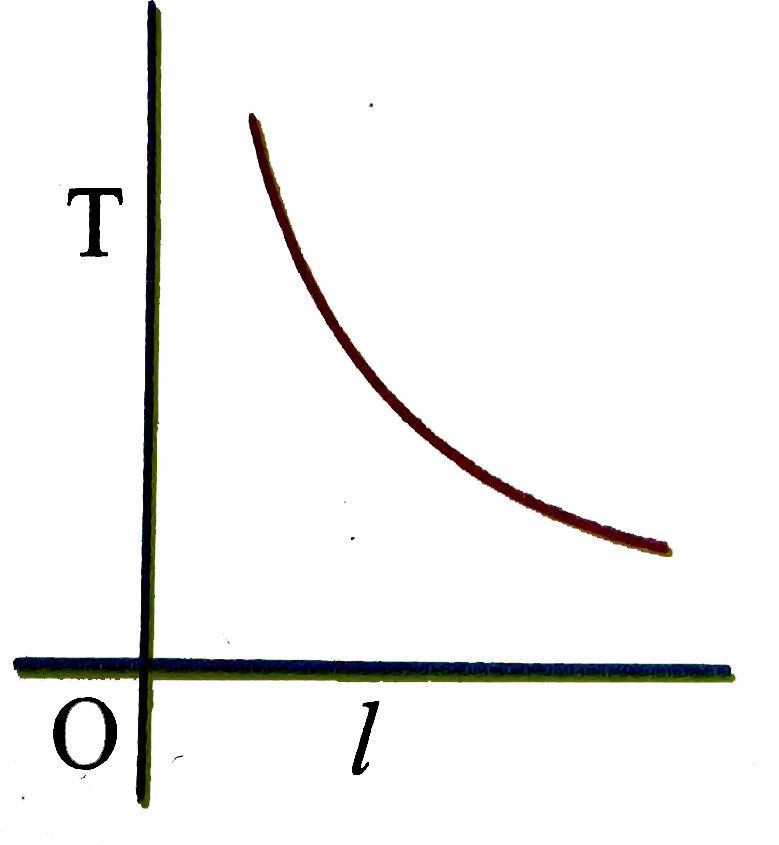
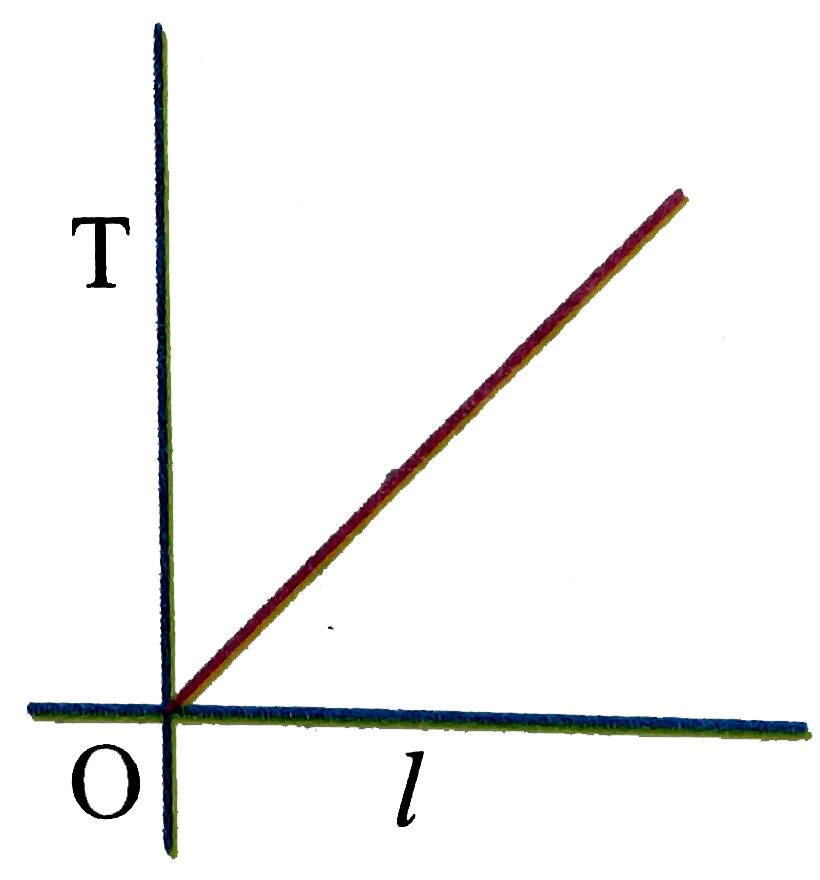
The graph between the time period and the length of a simple pendulum is a:
A
Straight line
B
Curve
C
Ellipse
D
Parabola
Text Solution
The correct Answer is:D
For a simple pendulum,
T∝√l
T2∝l
Graph between T and l will be a parabola symmetic about T-axis.
|
Similar Questions
Knowledge Check
The graph between time period (T) and length (l) of a simple pendulum is
A B
B C
C D
D
Time period of simple pendulum is
AT=2π√lgBT=2π√glCT=√2πlgDT=12π√glThe graph between the length and square of the period of a simple pendulum is a
AcircleBparabolaCstraight lineDhyperbola
Find the relationship between the time period of the pendulum and the length of the pendulum.
View SolutionWhat is a simple pendulum? Find an expression for the time period and frequency of a simple pendulum.
View SolutionWhat is a simple pendulum? Find an expression for the time period and frequency of a simple pendulum.
View SolutionThe time period of a simple pendulum in a satellite is
View SolutionThe time period of a simple pendulum of length 9.8 m is
View Solution

