The mode of a frequency distribution is obtained graphically from
Video Solution
Text Solution
The correct Answer is:Histogram
|
Answer
Step by step video, text & image solution for The mode of a frequency distribution is obtained graphically from by Maths experts to help you in doubts & scoring excellent marks in Class 10 exams.
Updated on:21/07/2023Topper's Solved these Questions
Similar Questions
Knowledge Check
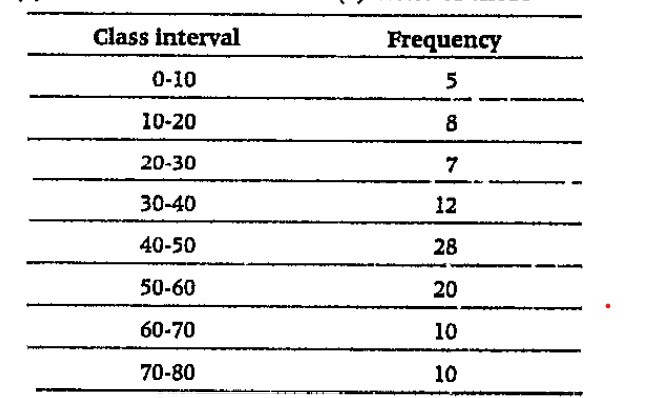
The mode of the following distribution is
 A46B6.66C46.67DNone of these
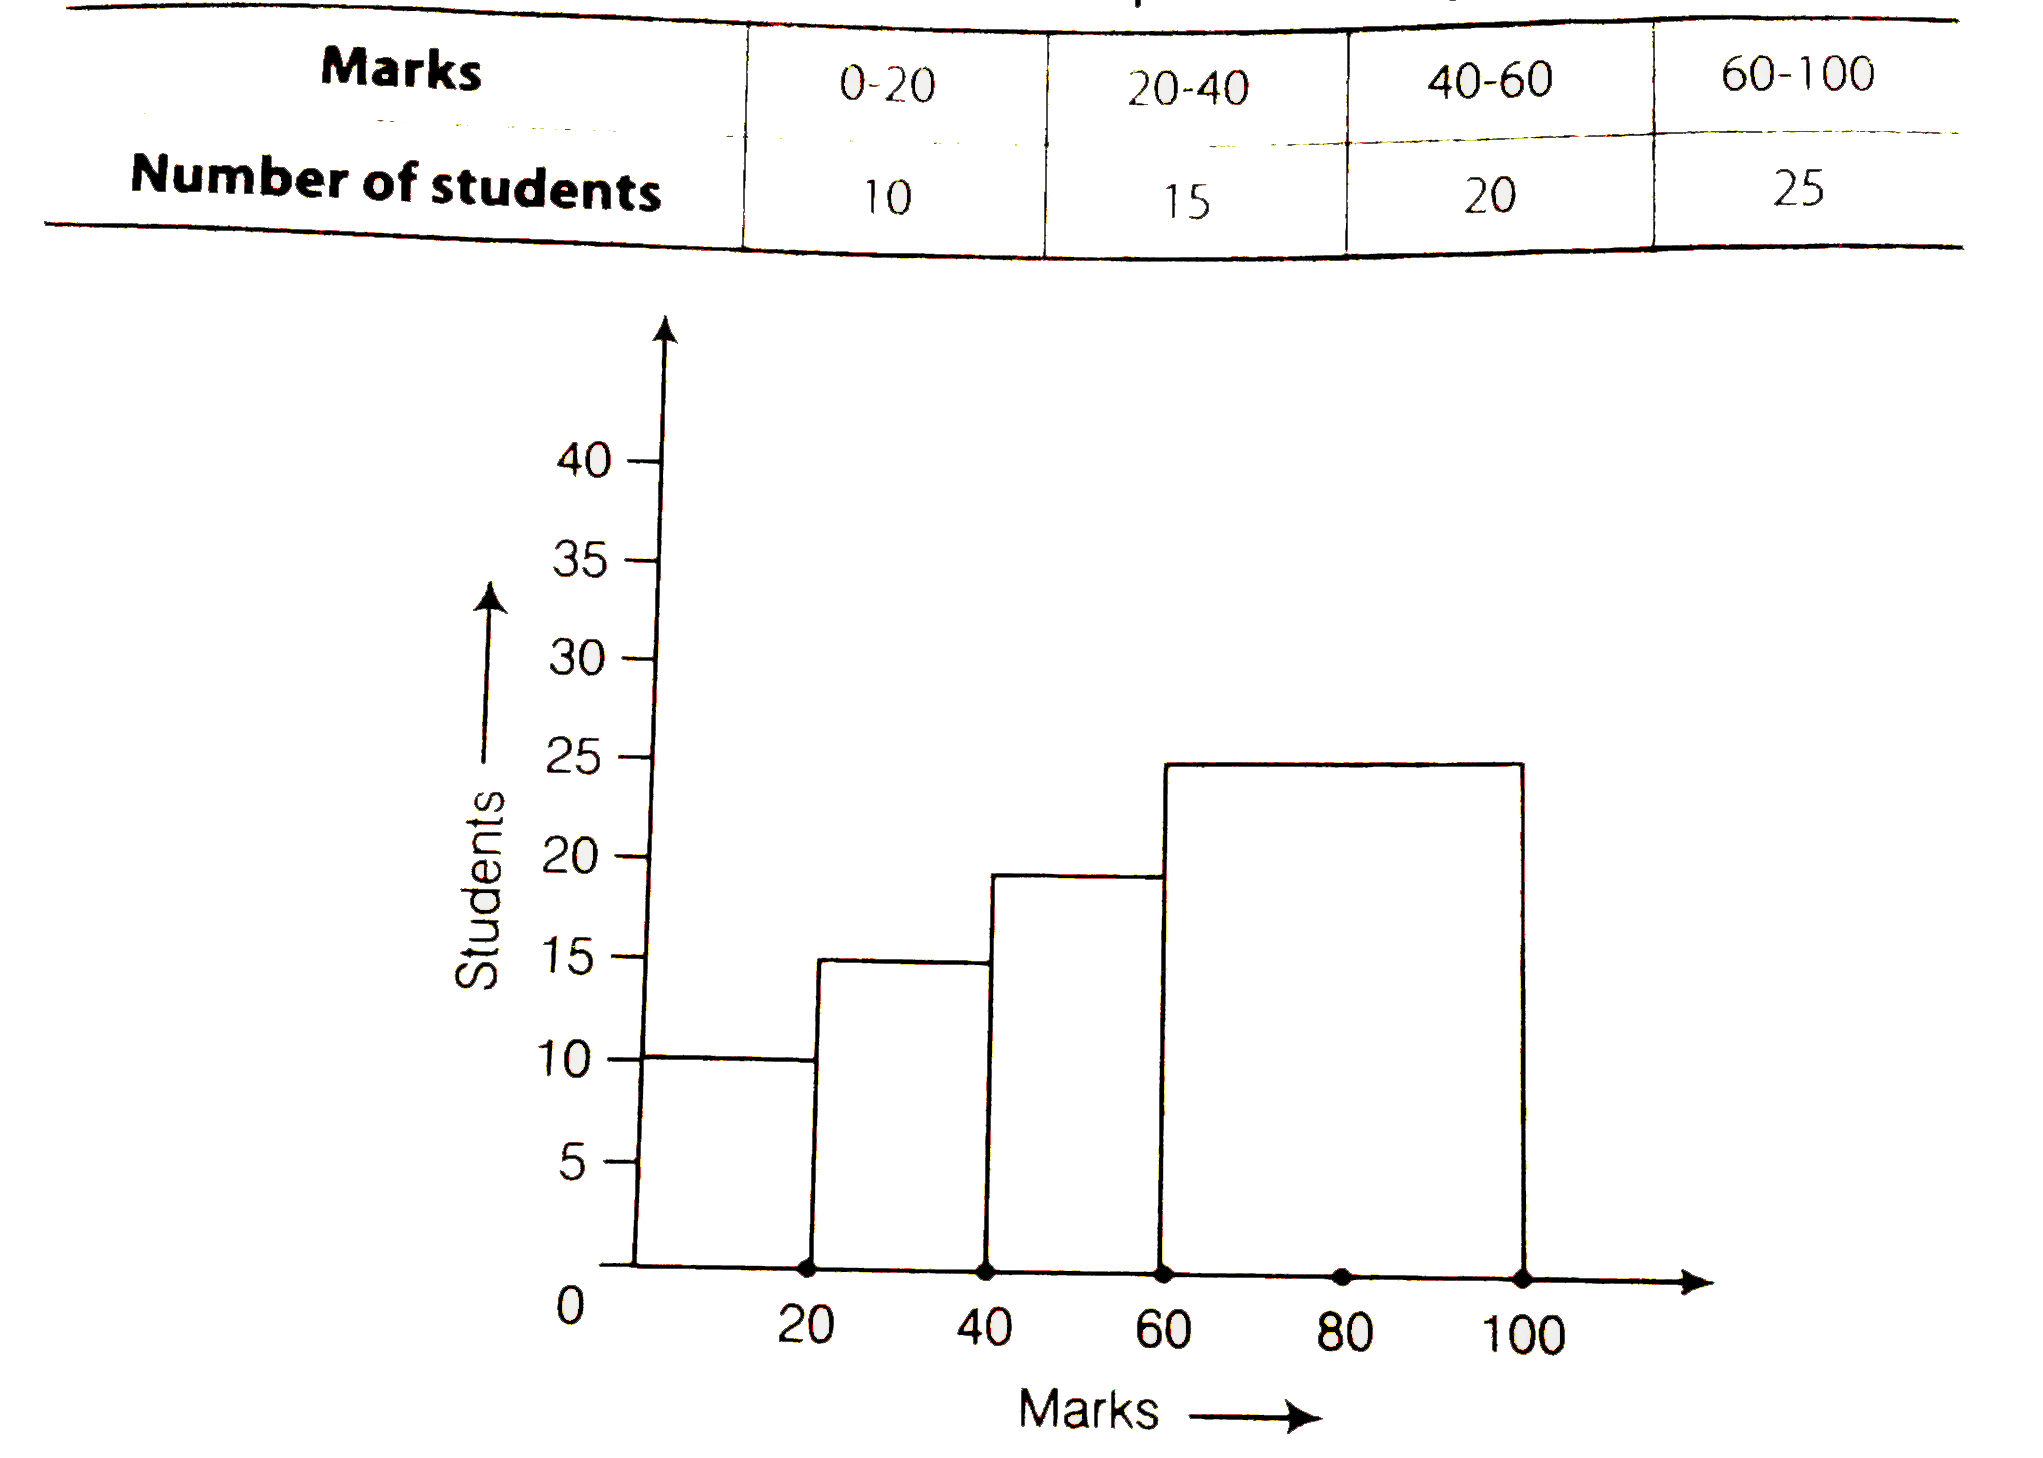
The frequency distributions been represented graphically as follows.

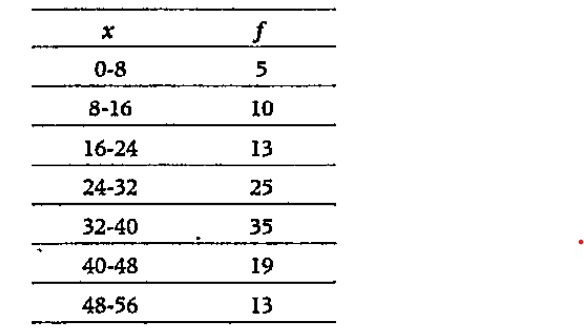
Is this representation correct?AYesBNoCcannot sayDNoneThe mode for the following distribution is
 A33.07B36.04C37.05DNone of these
The median of a frequency distribution is found graphically with the help of
View SolutionFor the frequency distribution

View SolutionThe median of a given frequency distribution is found graphically with the help of (a) Histogram (b) Frequency curve (c) Frequency polygon (d) Ogive
View SolutionMode of a frequency distribution can be known graphically with the help of histogram. (true/false)
View SolutionThe mode of following frequency distribution is 36 . Find the missing frequency (f) .

View Solution

