Marks in Statistics of the students of Class XI are given below.
Find out arithmetic mean.
MarksNumber of StudentsLess than 10 5Less than 20 17Less than 30 31Less than 40 41Less than 50 49
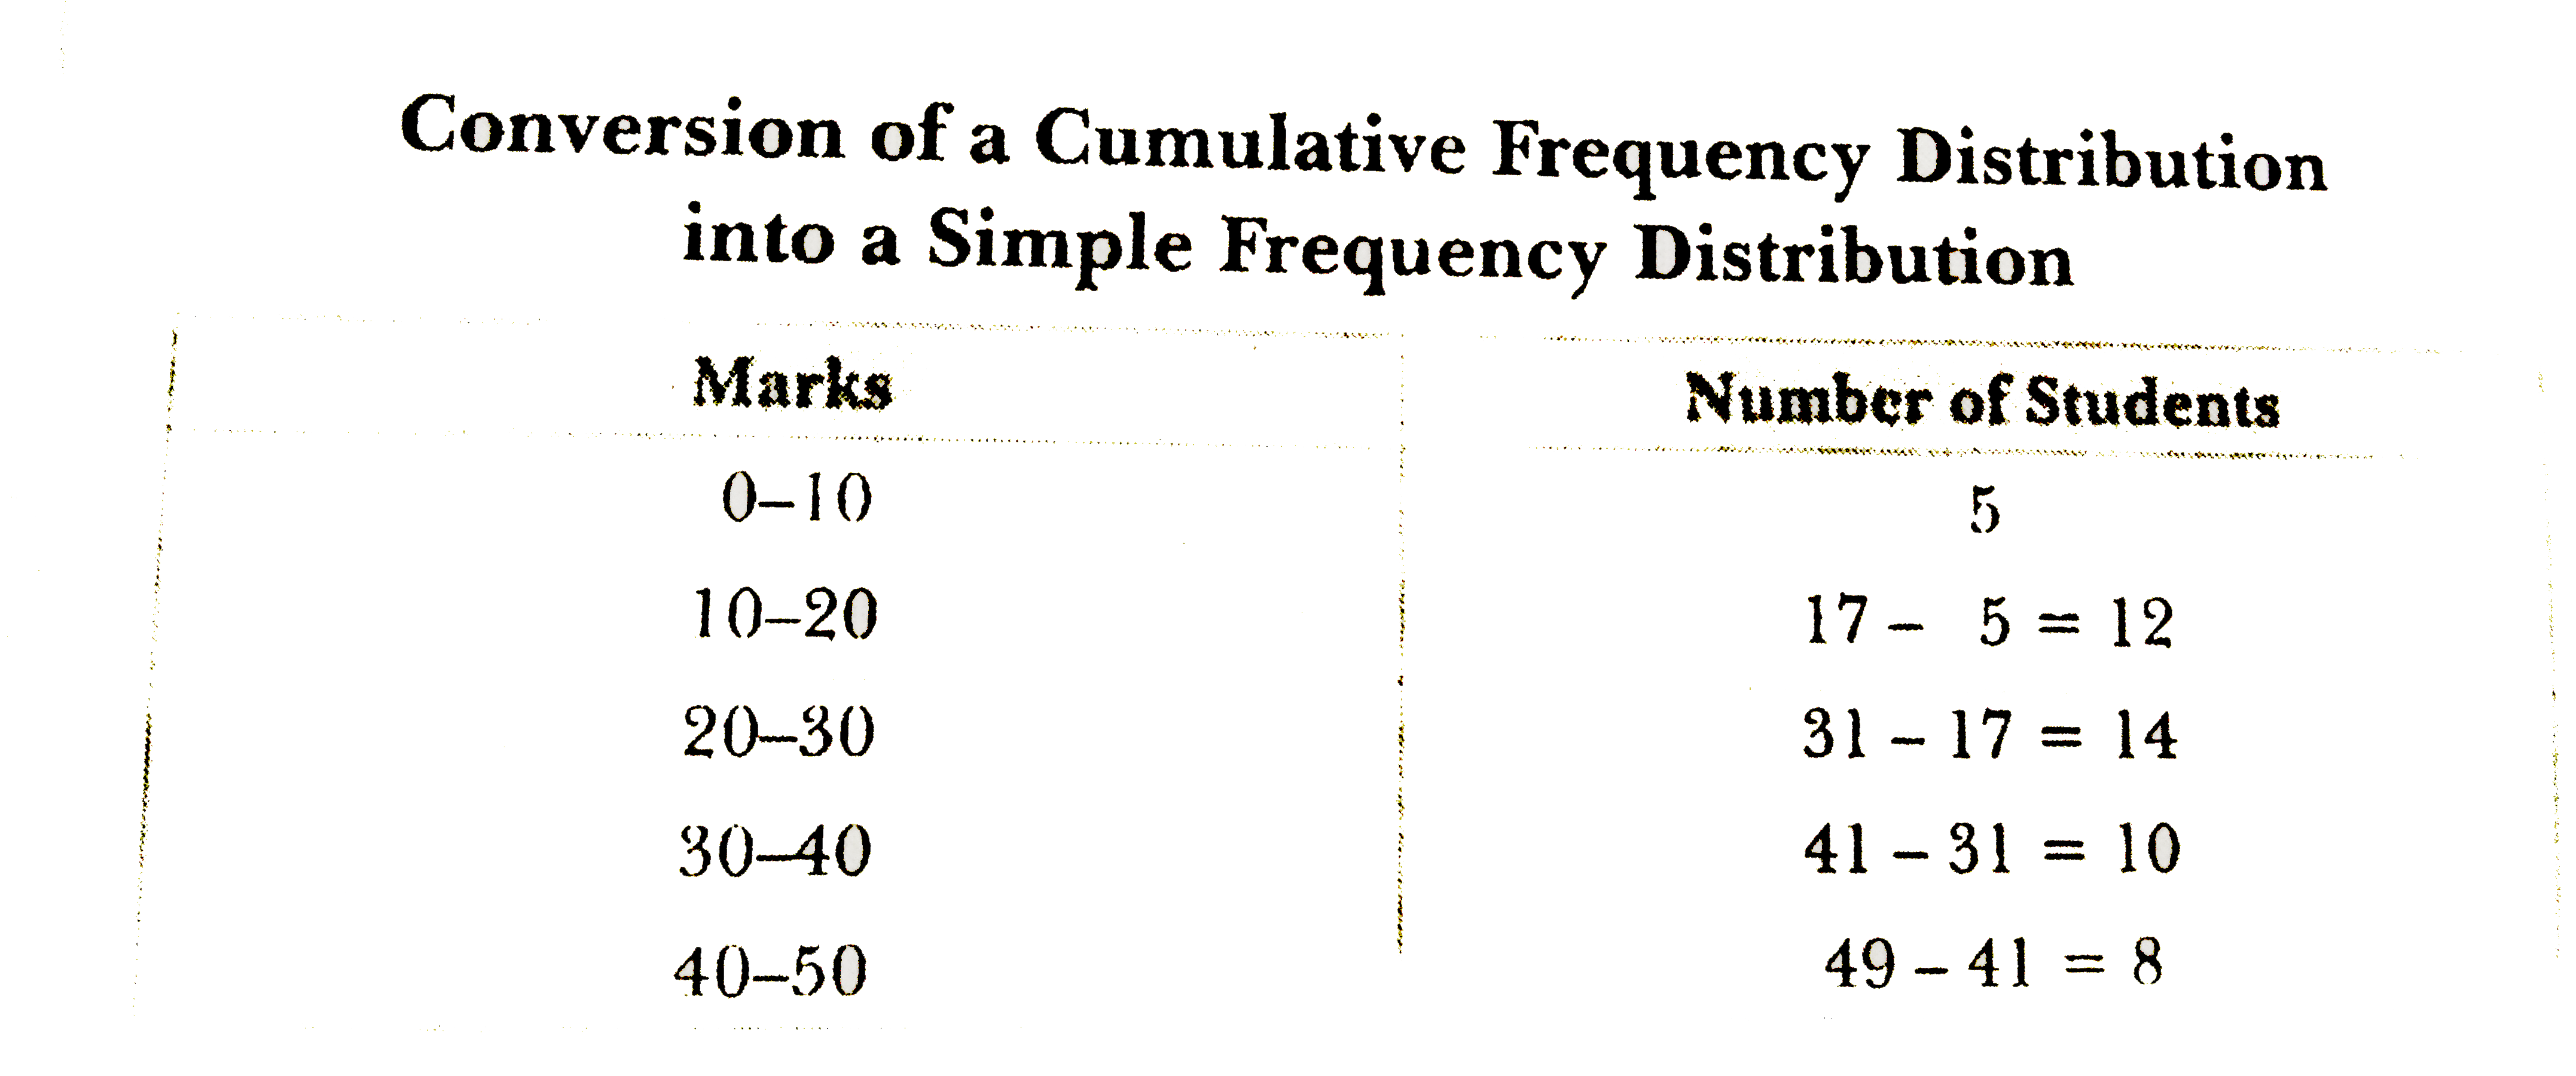
A Cumulative Frequency Distribution should first be converted into a Simple Frequency Distribution, as under:

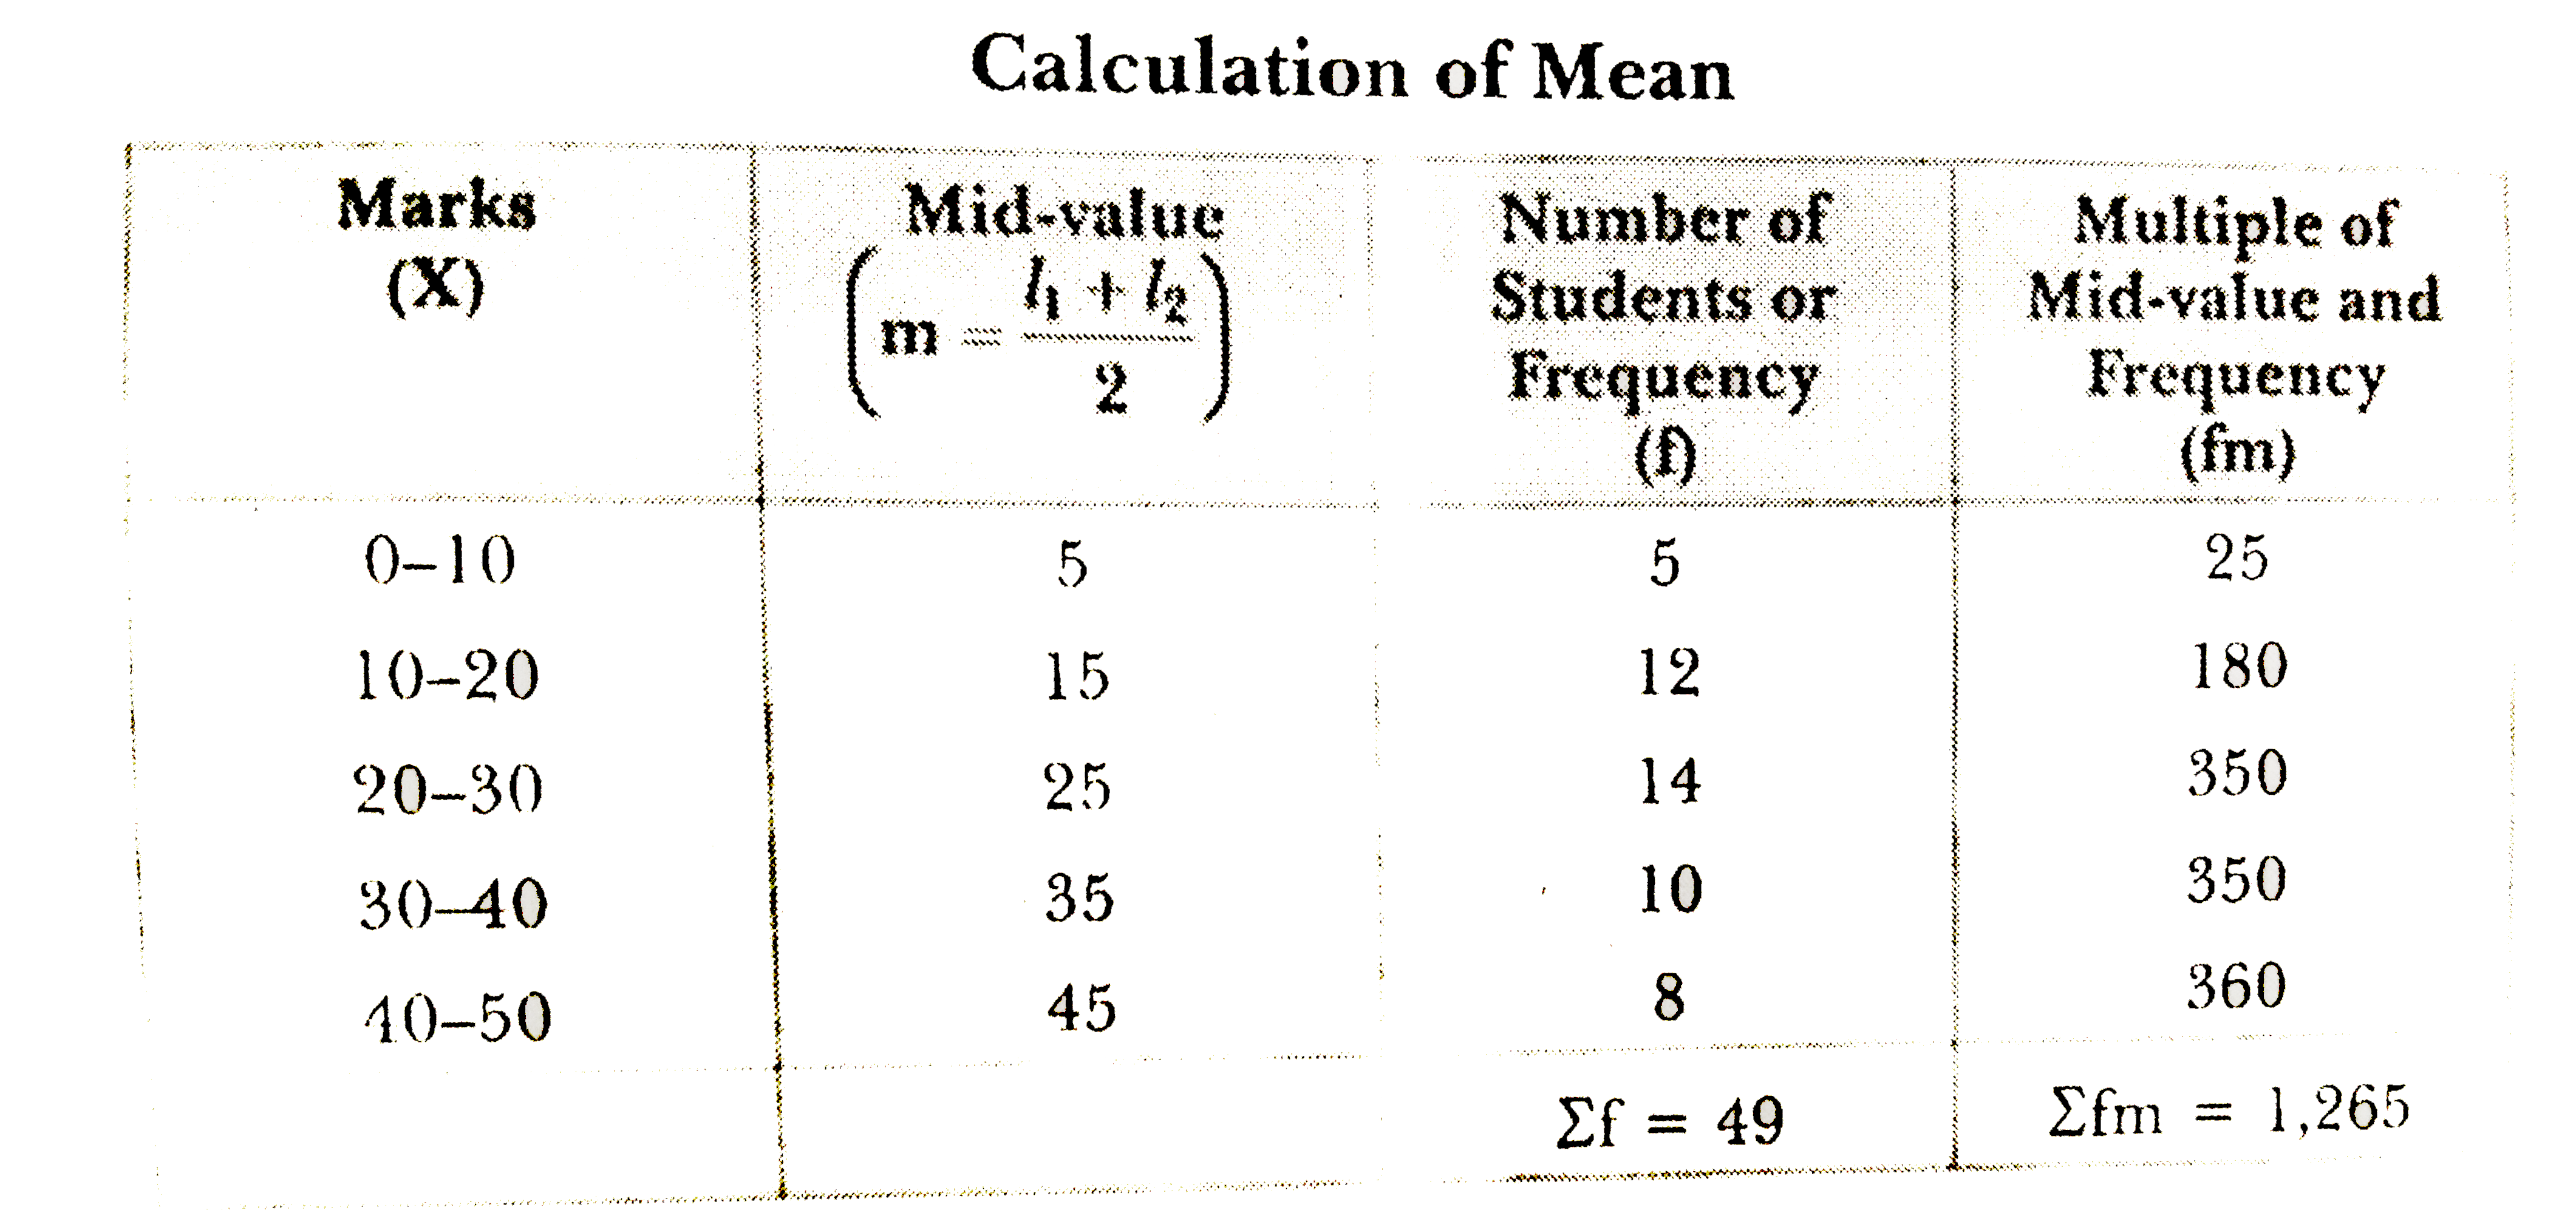
Now, mean value of the data is obtained using Direct Method as under:

¯¯¯X=∑fm∑f=1,26549=25.82
Arithmetic Mean = 25.82 marks.
Topper's Solved these Questions
Similar Questions
The following table shows marks in economics of the students of a class. Calculate arithmetic mean.
MarksNumber of StudentsMore than 0 30More than 2 28More than 4 24More than 6 18More than 8 10
View SolutionThe following table shows marks in economics of the students of a class. Calculate arithmetic mean.
MarksNumber of StudentsMore than 0 30More than 2 28More than 4 24More than 6 18More than 8 10
View Solution
Knowledge Check
The following table shows the number of marks secured by the students of a class in a 50 marks exam.
ScoreNumber of studentsLess than or equal to 10 marks 2More than 10 marks and less then or equal to 20 marks5More than 20 marks and less then or equal to 30 marks9More than 30 marks and less then or equal to 40 marks14More than 40 marks and less then or equal to 50 marks10
How many students secured less then or equal to 30 marks in that exam ?A9B14C23D16
Calculate arithmetic mean , median and mode of the following series :
MarksNumber of StudentsLess than 10 12Less than 20 26Less than 30 40Less than 40 58Less than 50 80Less than 60 110Less than 70 138Less than 80 150
View SolutionCalculate mode from the following data :
Wages (Rs.)Number of WorkersLess than 10 15Less than 20 35Less than 30 60Less than 40 84Less than 50 96Less than 60 127Less than 70 198Less than 80 250
View SolutionConstruct a frequency table from the following data
MarksNo of studentsless than106less than2015less than3030less than4039less than5053les than6070
View SolutionThe median of the following data is
Marks obtained No. of students less than 200less than 304less than 4016less than 5030less than 6046less than 7066less than 8082less than 9092less than 100100
View SolutionDraw an ogive for each of the following distributions
Marks obtained less than 10 less than 20 less than 30 less than 40 less than 50 No. of students 8 25 38 50 67
View SolutionMarks obtained by 90 students of class IX in a test are given below:

Out of these students, one is chosen at random. Find the probability that the chosen student obtains
less than 20% marks
View SolutionFind out the arithmetic mean from the following data:
Marks (less than) 51015202530Number of Students223102330546980
View Solution

