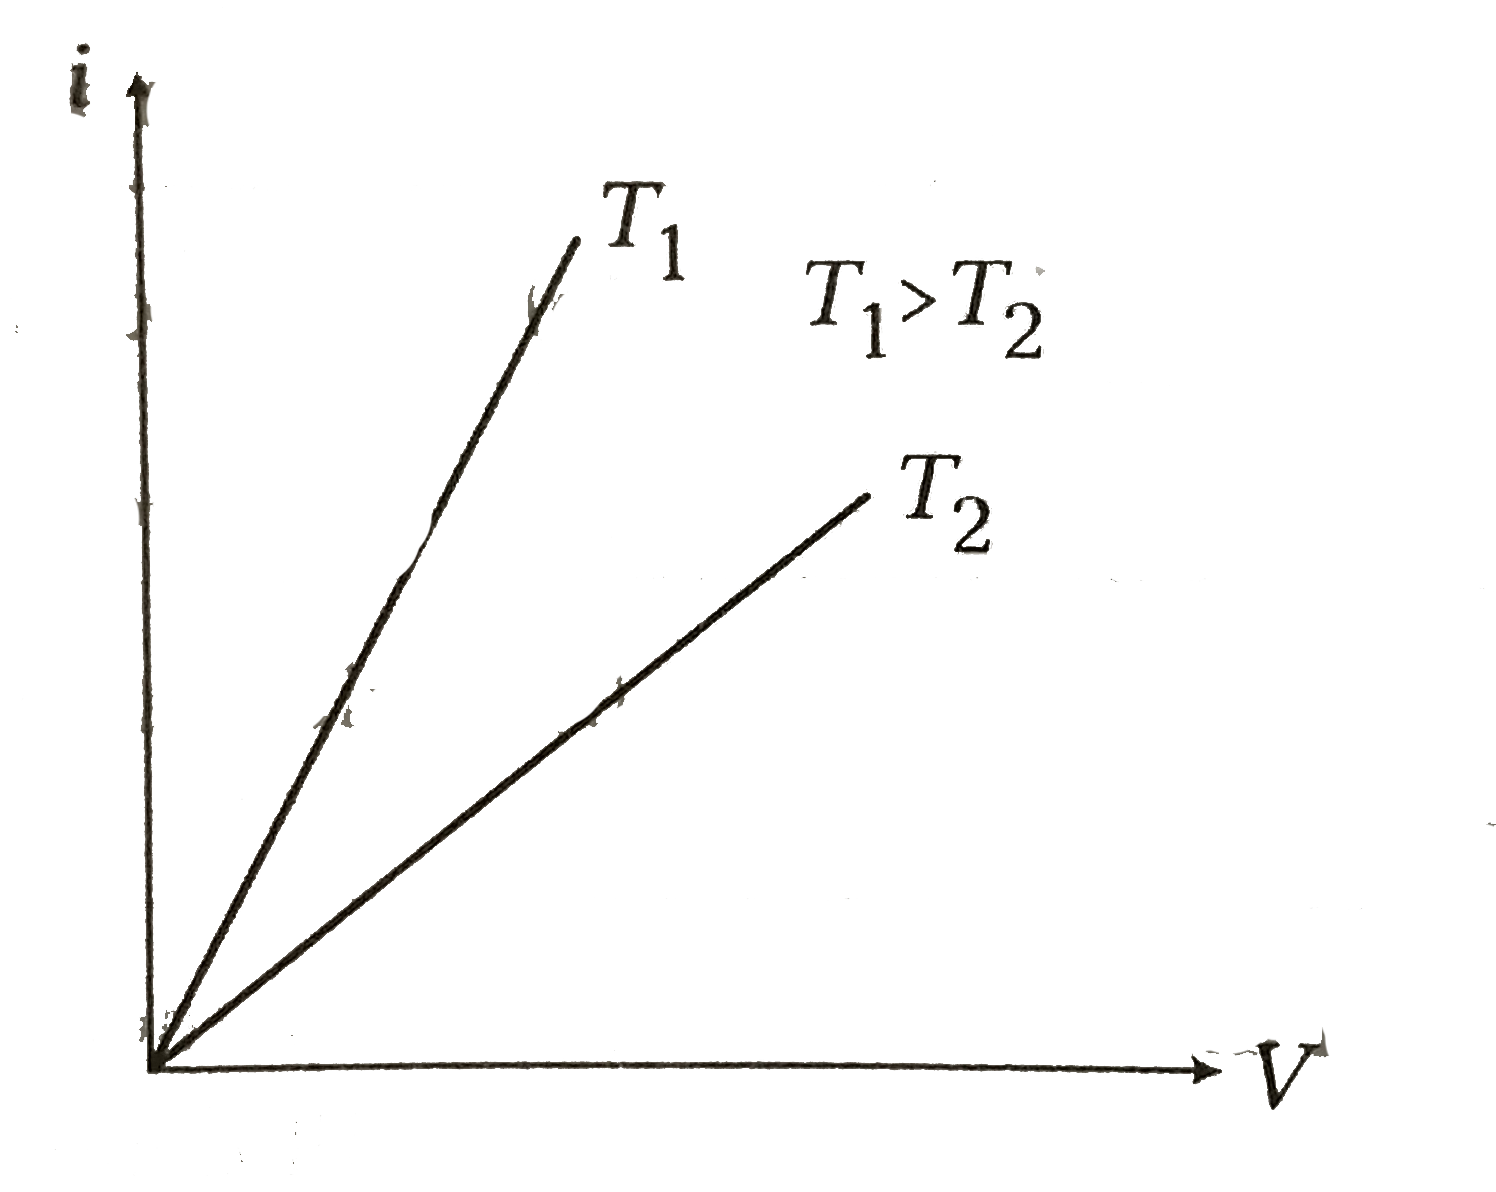
Assertion : Current versus potential difference (i-V) graph for a conductor at two different temperatures T1 and T2 is shown in figure. Hence T1>T2.

Reason : Resistance of a conductor increases with rise in temperature.
T1>T2
T1=T2
nothing can be said about T1 and T2
T1<T2
The correct Answer is:4
Step by step video, text & image solution for Assertion : Current versus potential difference (i-V) graph for a conductor at two different temperatures T_(1) and T_(2) is shown in figure. Hence T_(1)gt T_(2). Reason : Resistance of a conductor increases with rise in temperature. by Physics experts to help you in doubts & scoring excellent marks in Class 12 exams.
Updated on:21/07/2023Similar Questions
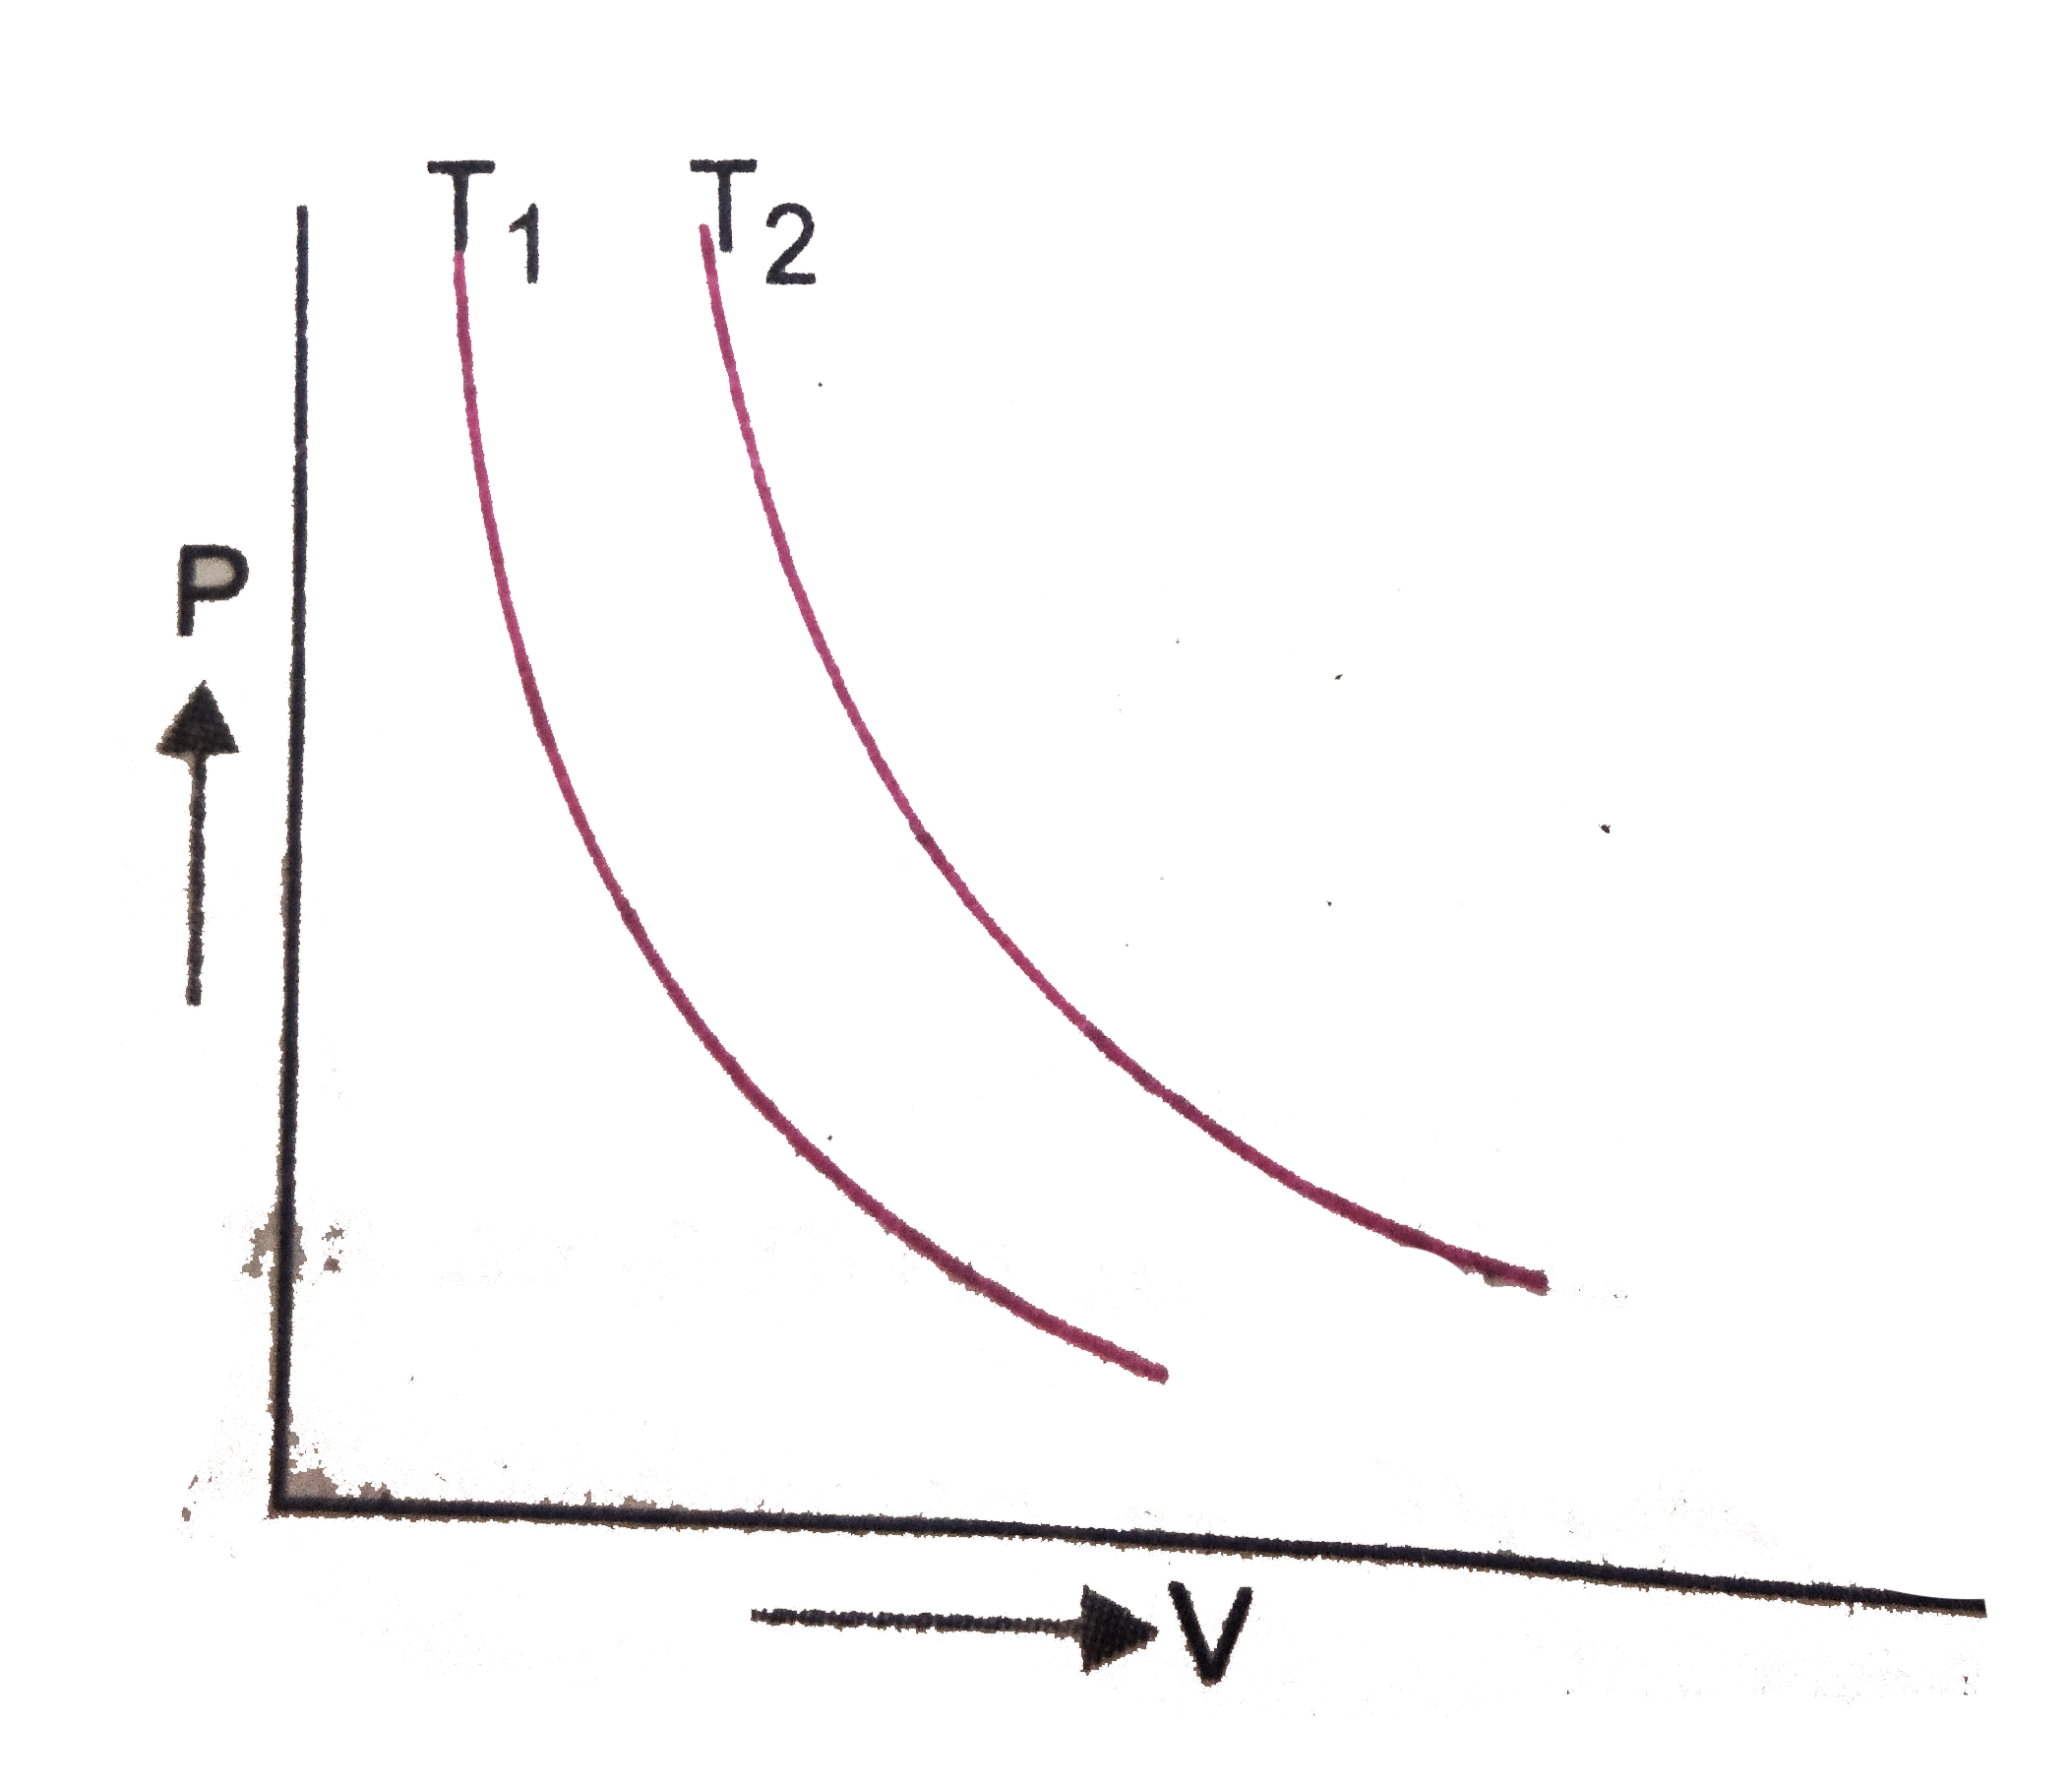
Isothermal curves for a given mass of gas are shown at two different temperture T1andT2 in Fig. State whether T1>T2orT2>T1. Justify your answer.

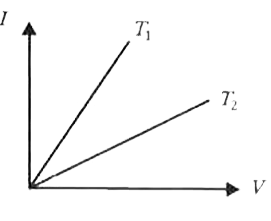
View SolutionThe current-voltage graph for a given metallic conductor at two different temperature T1andT2 are as shown in the figure. Then

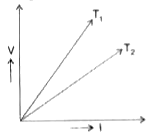
View SolutionThe voltage V and current I graphs for a conductor at two different tempratures T_(1) and T_(2) are shown in the figure .The relation between T_(1) and T_(2) is
View SolutionThe voltage-current (V-I) graph of a metallic conductor at two different temperatures T1 and T2 is shown below. At which temperature is the resistance higher ?

View SolutionThe voltage V and current I v graphs for a conductor at two different temperatures T1andT2 are shown in the figure. The relation between T1andT2 is

View SolutionThe V - i graph for a conductor at temperature T_(1) and T_(2) are as shown in the figure. ( T_(2) - T_(1)) is proportional to
View SolutionV - I graph of a conductor at temperature T_(1) and T_(2) are shown in the figure (T_(2)-T_(1)) is proportional to
View SolutionAssertion : Current versus potential difference (i-V) graph for a conductor at two different temperatures T_(1) and T_(2) is shown in figure. Hence T_(1)gt T_(2) . Reason : Resistance of a conductor increases with rise in temperature.
View Solution
