The curve of pressure volume (PV) against pressure (P) of the gas at a particular temperature is as shown, according to the graph which of the following is incorrect (in the low pressure region):

H2 and He shows +ve deviation from ideal gas equation.
CO,CH4 and O2 show negative deviation from ideal gas equation.
H2 and He show negative deviation while CO,CH4 and O2 show positive deviation.
H2 and He are less compressible than that of an ideal gas while CO,CH4 and O2 more compressible than that of ideal gas.
The correct Answer is:C
If Z>1 positive deviation
Z<1 negative deviation
Similar Questions
Knowledge Check
The curve of pressure volume (PV) against pressure (P) of the gas at a particular temperature is as shown, according to the graph which of the following is/are incorrect (in low pressure region):
 AH2 and He show positive deviation from ideal gas equationBCO, CH4 and O2 show negative deviation from ideal gas equationCH2 and He show negative deviation while CO2,CH4 and O2 show positive deviationDH2 and He are less compressible than that of an ideal gas while CO2,CH4 and O2 more compressible than that of ideal gas.
For the given graph which of the following is correct : (n = mole of gas and P = Pressure)
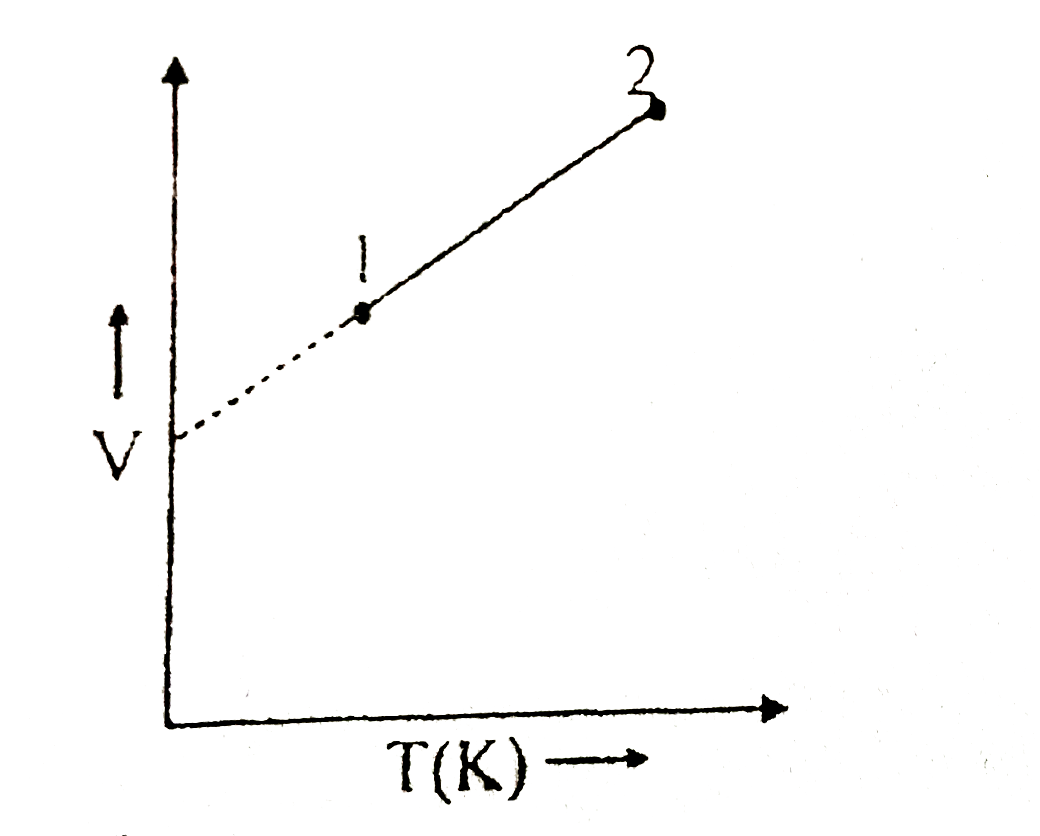 AP2>P1 with n is constantBP2<P1 with n is constantCP2=P1 with n is constantDcan't compare P1 and P2
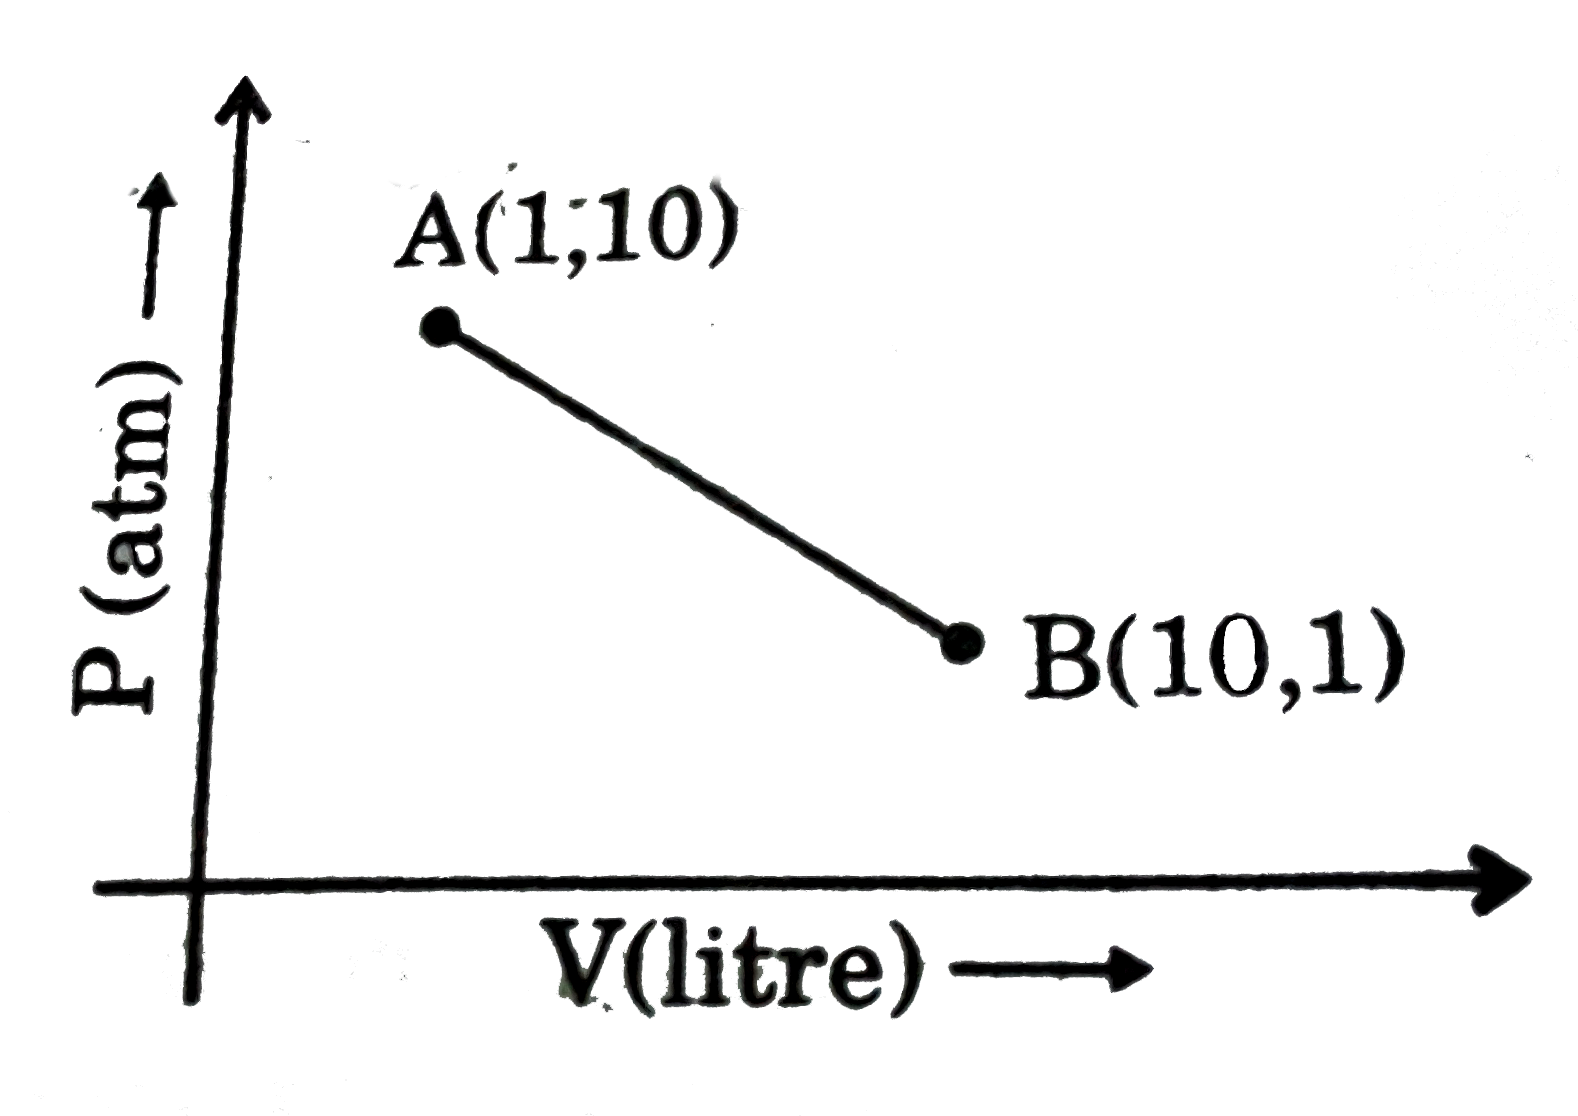
For 1 mole of an ideal gas, a graph of pressure vs volume is plotted as shown. Which of the following options is correct ?
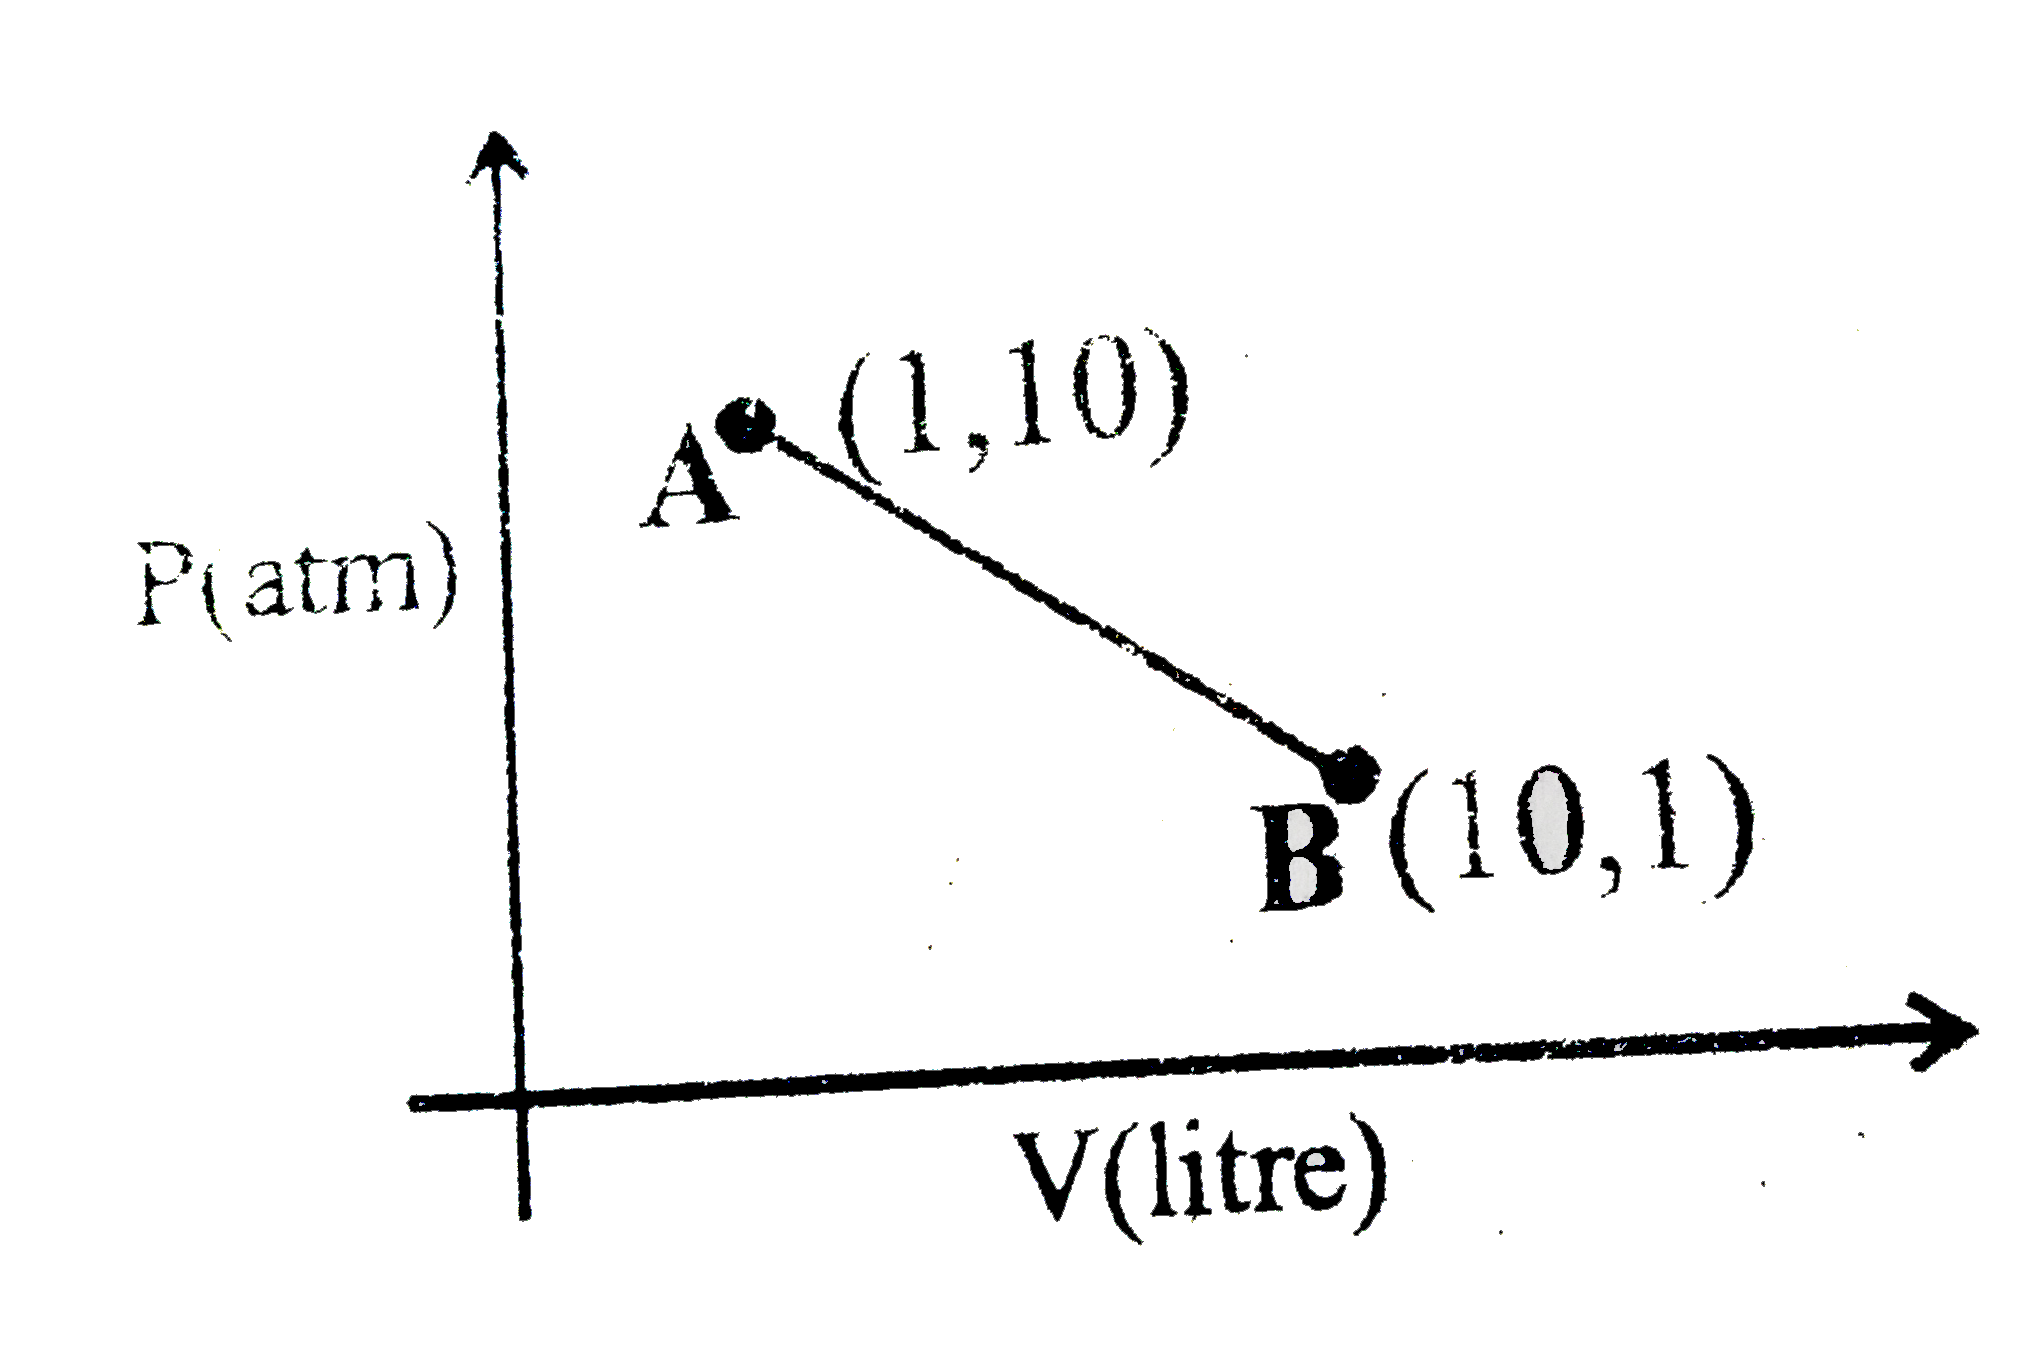 AAB process is isothermalBMaximum temperature of the gas can be 100.0821KCMinimum temperature of the gas can be 114×0.0821KDNone of these
What is the nature of graph between pressure (P) and volume(V)for a given mass of a gas at a fixed temperature ?
View SolutionName the gas law which relates volume and pressure of gas at constant temperature.
View SolutionThe variation of pressure with volume of the gas at different temperatures can be graphically represented as shown in figure. On the basis of this graph answer the following questions.
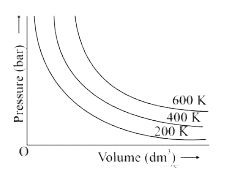
How will the volume of a gas change if its pressure is increased at constant temperature?
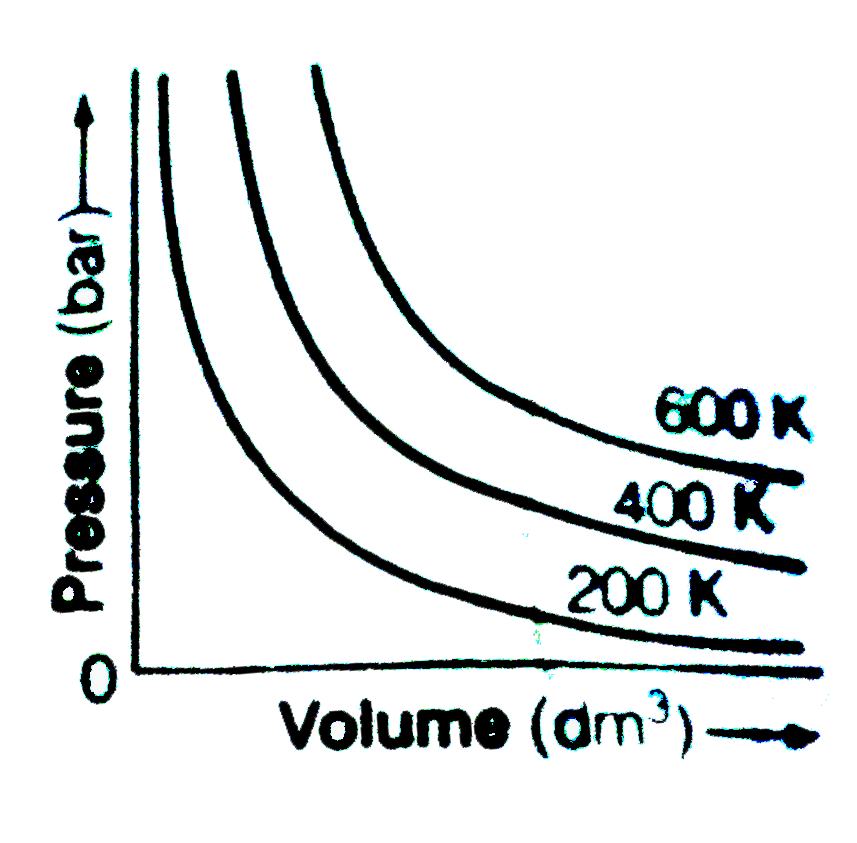
View SolutionThe variation of pressure with volume of the gas at different temperatures can be graphically represented as shown in figure. On the basis of this graph answer the following question.
(i) How will the volume of a gas change if its pressure is increased at constant temperature ?
(ii) At a constant pressure, how will the volume of a gas change if the temperature is increased from 200 K to 400 K ?
View SolutionFor 1 mole of an ideal gas, a graph of pressure vs volume is plotted as shown. Which of the following option is correct ?
View Solution

