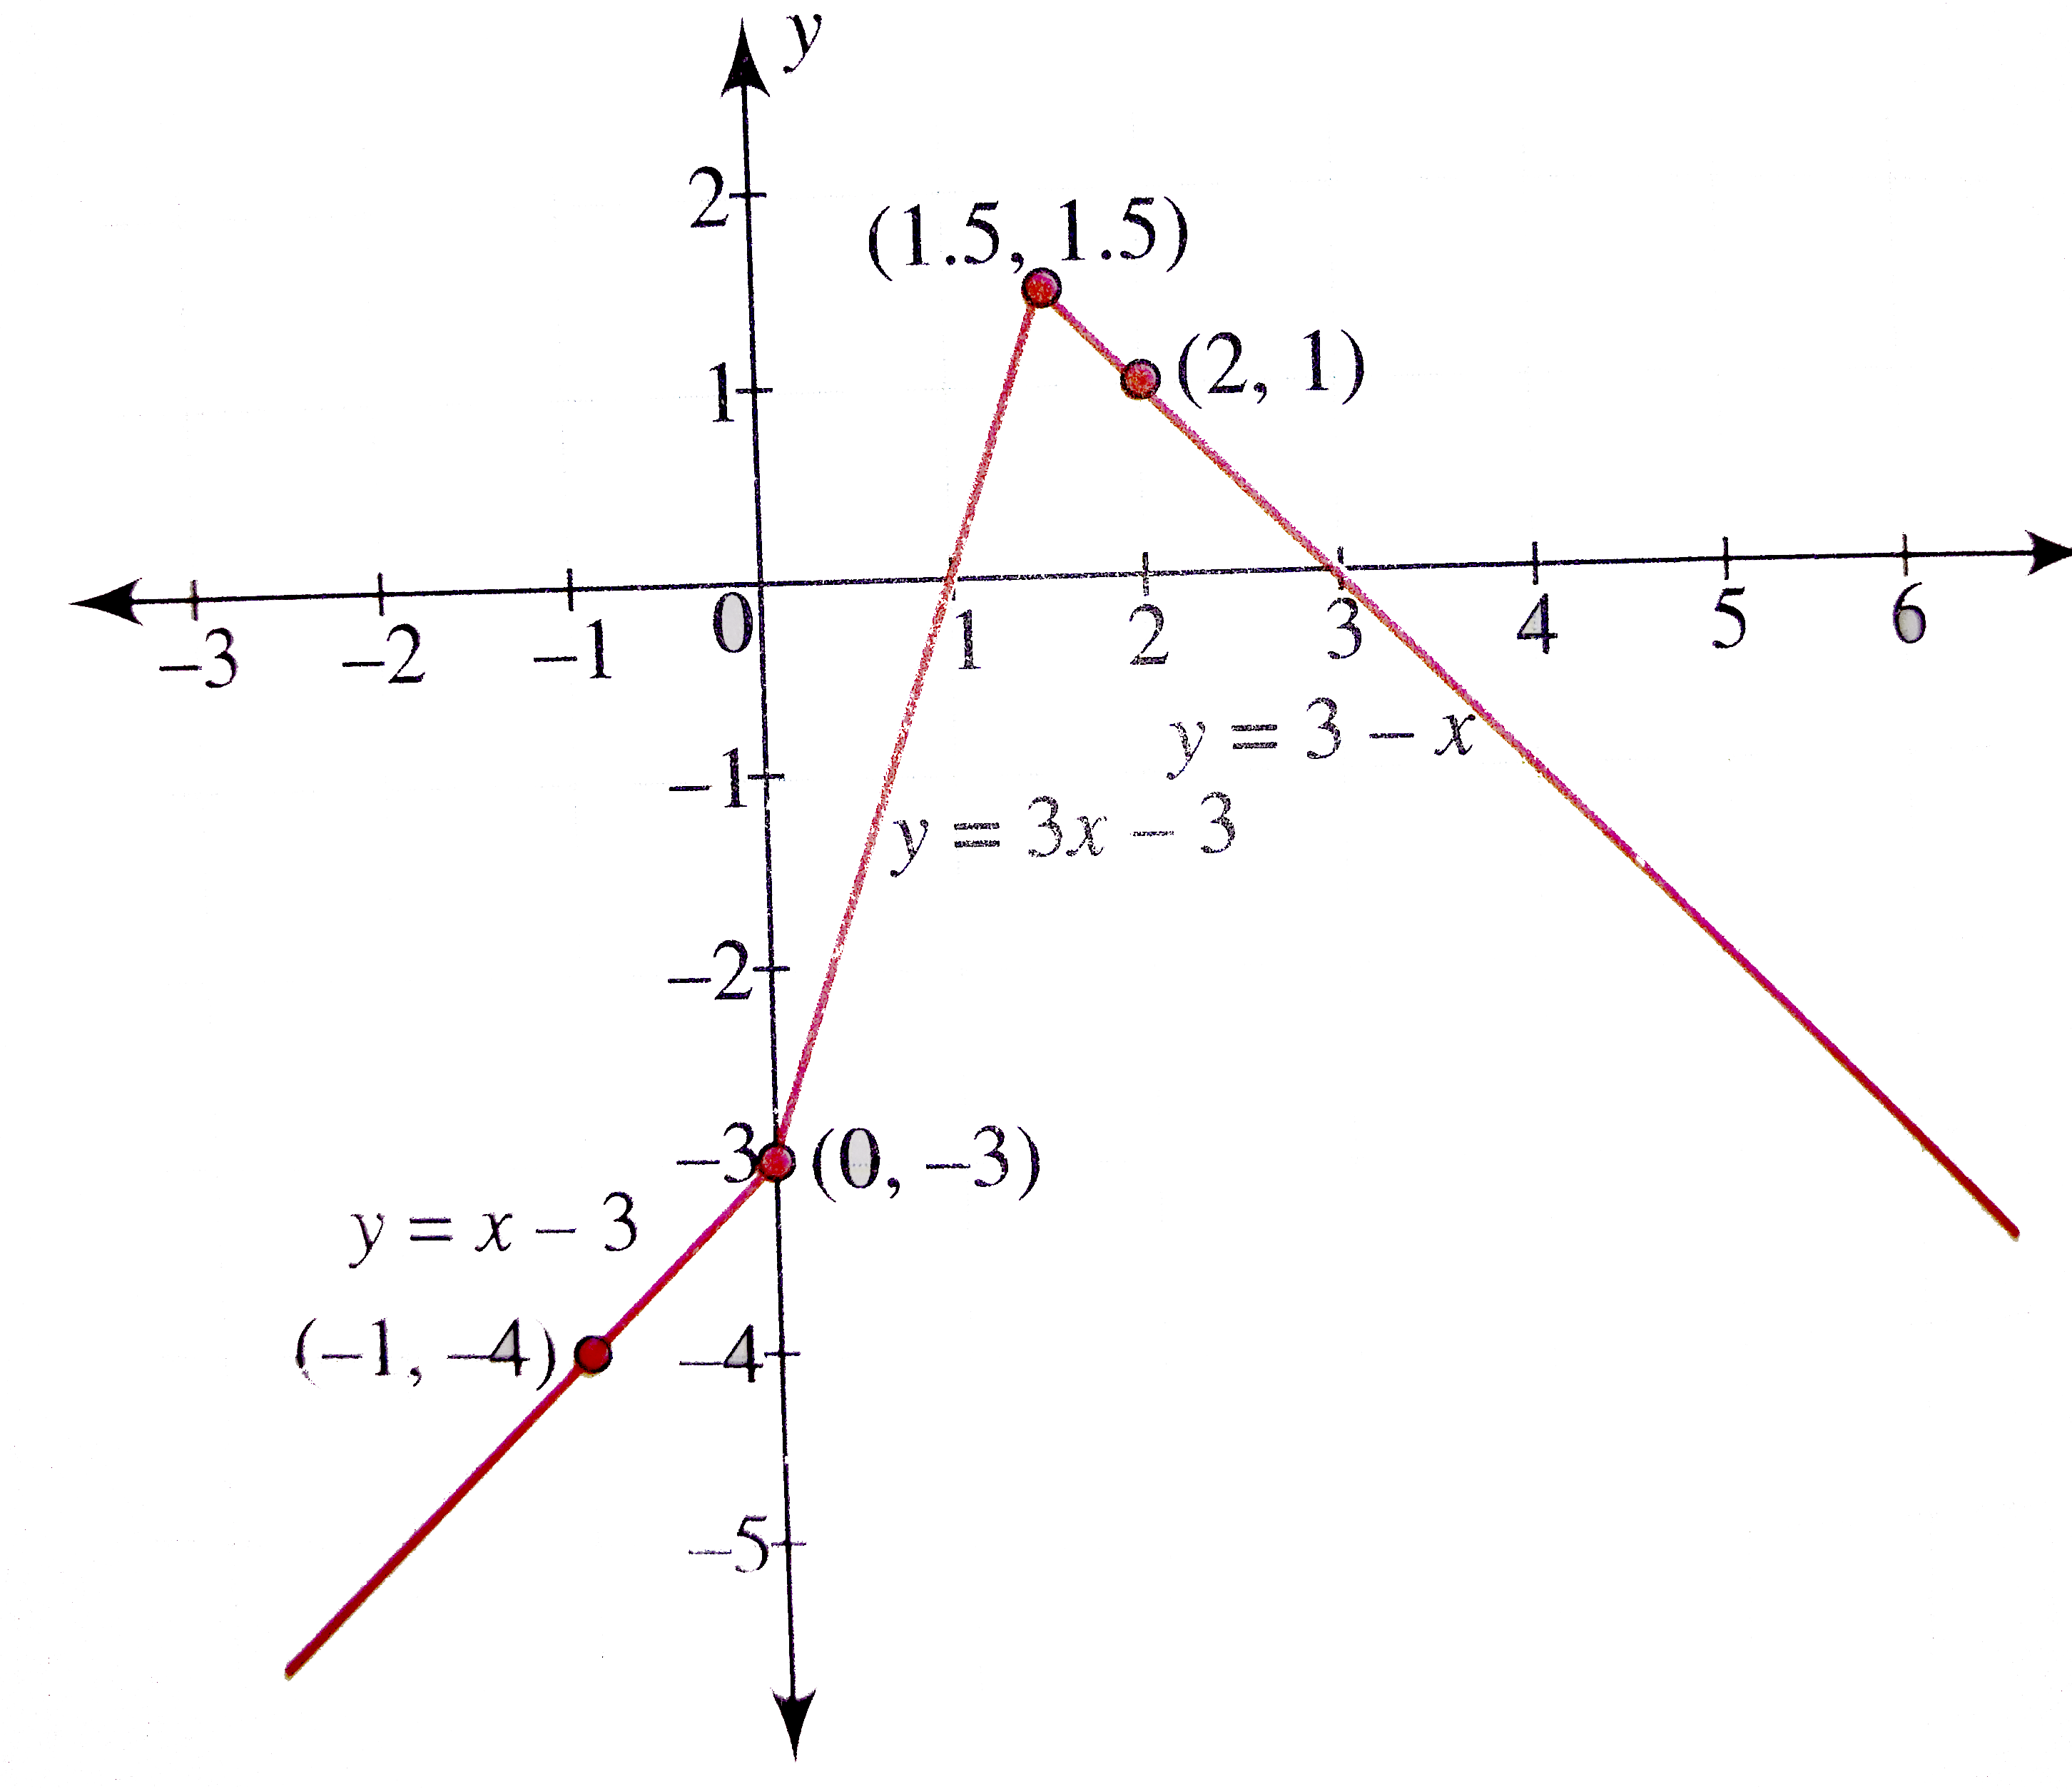
Draw the graph of f(x)=|x|−|2x−3|. Find the range of the function.
Video Solution
Text Solution
For f(x)=|x|−|2x−3|, the function changes definition at x=0andx=3/2.
Since the graph of the function is a straight line in each region (−∞,0),(0,3/2)and(3/2,∞), we need to check the values at some particular values of x to draw the graphs.
f(−1)=1−5=−4
f(0)=0−3=−3
f(3/2)=1.5
f(2)=2−1=1
Thus, we plot the points (−1,−4),(0,−3),(3/2,1/2)and(2,1).
Plotting these points and connecting with the straight line, we have the following graph.

From the graph, the range of the function is (−∞,1.5].
|
Similar Questions
Knowledge Check
If the sum is 240 and average is 40, find the number of quantities.
A5B2C3D6
Find the range of the function f(x)=|x|.
View SolutionDraw the graph of f(x)=x2−3
View SolutionFind the range of the function, f(x)=x|x|
View SolutionDraw the graph of f(x)=(x−1)|(x−2)(x−3)|.
View SolutionDraw the graph of:
y=f(x)=3sin(2x−1).
View SolutionDraw the graph of f(x)=loge(√1−x2).Find the range of the function .Also find the values of k if (x) has two distinct real roots.
View SolutionFind the range of function f(x)=1+3cos2x
View Solution
