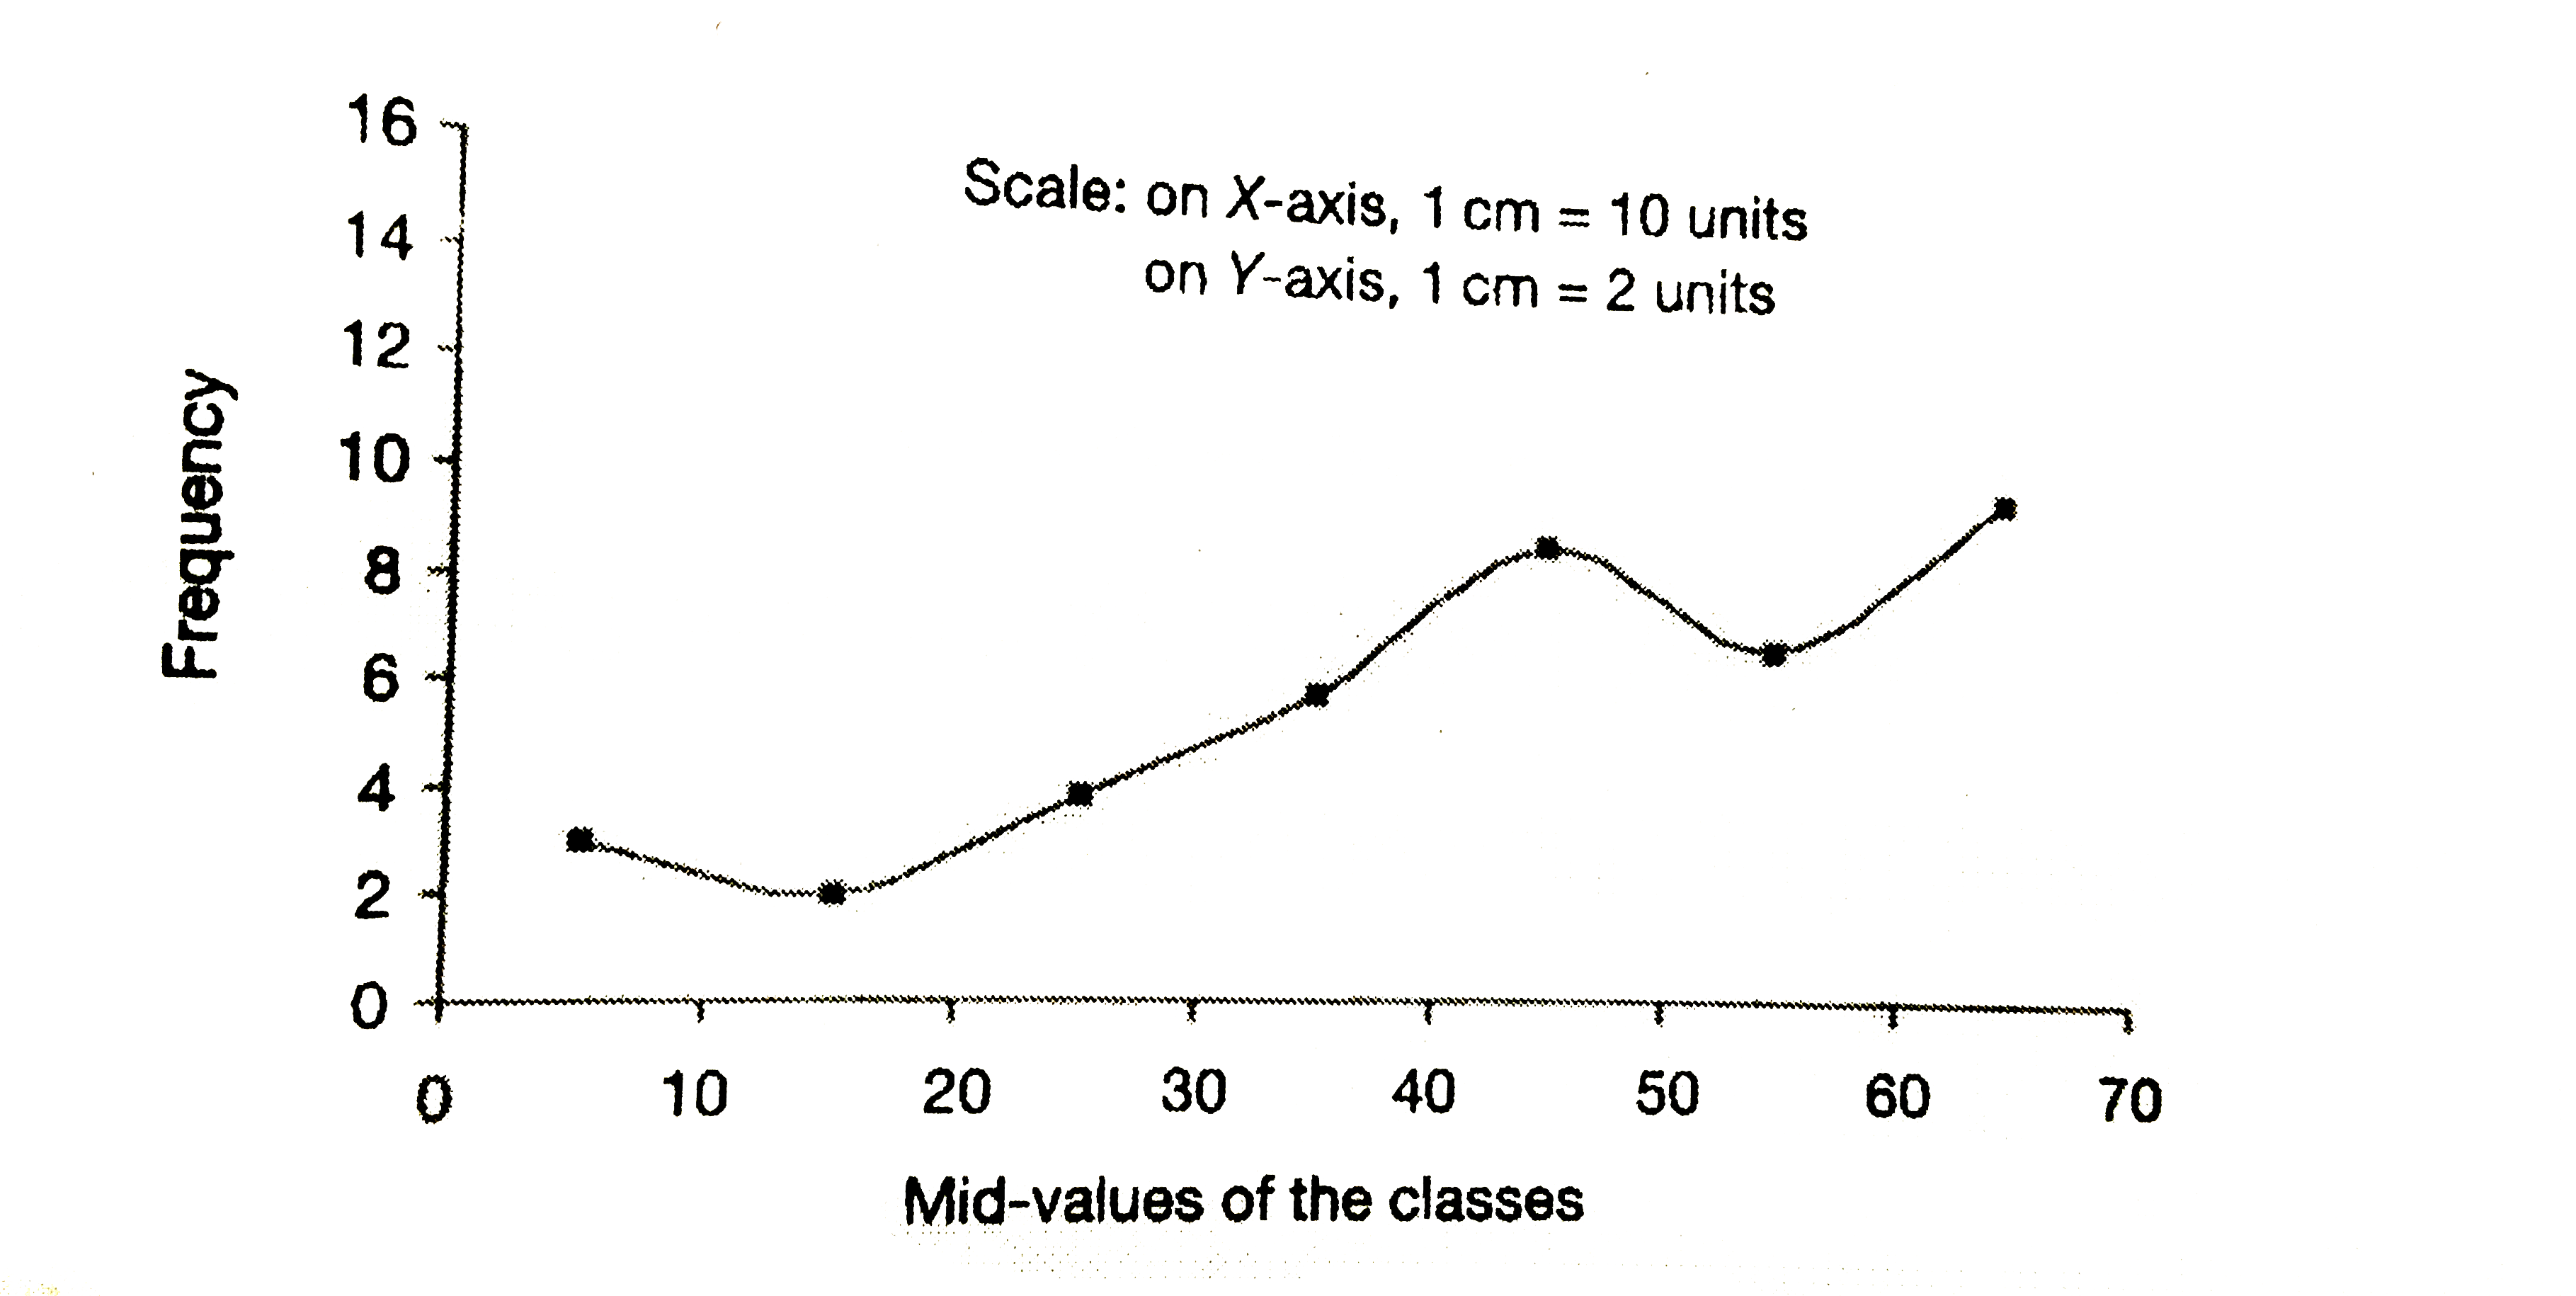
Draw a frequency curve for the data given below:
Class Interval0−1010−2020−3030−4040−5050−6060−70Frequency32469710
Following table shows the mid-values of classes and corresponding frequencies for the given data:
Class IntervalMid-valueFrequency 0−10 5 3 10−20 15 2 20−30 25 4 30−40 35 6 40−50 45 9 50−60 55 7 60−70 65 10
Now, taking the mid-values of the classes along the X-axis and the corresponding frequencies along the Y-axis, we mark the points obtained from the above table in a graph sheet and join them with a smooth curve, which gives the frequency curve as shown in the Fig. 9.4.

Similar Questions
For the given distribution, draw the less than and greater than cumulative frequency curves.
Class Interval0−1010−2020−3030−4040−5050−6060−7070−80Frequency53721491510
View SolutionConstruct a histogram for the frequency distribution below:
Class Interval10−2020−3030−4040−5050−60Frequency63847
View Solution
Knowledge Check
The mode from given grouped data would be
Class Interval10−2020−3030−4040−5050−60Frequency57684A42B43C44D45Given data shows marks of 32 students in an examination. Mean of the marks will be
Class interval0−1010−2020−3030−4040−50Frequency126842A18.125B21.875C22.425D22.545
Estimate the mode of the following data from the histogram.
Class Interval0−1010−2020−3030−4040−5050−6060−7070−80Frequency810151620131412
View SolutionCalculate mode from the following data :
Class Interval0−1010−2020−3030−4040−50Frequency 2 5 7 5 2
View SolutionFind out the arithmetic mean by the Step-deviation Method of the following:
Class Interval0−1010−2020−3030−4040−5050−6060−7070−80Frequency 12 16 32 52 42 32 18 12
View SolutionFind out the arithmetic mean by the Step-deviation Method of the following:
Class Interval0−1010−2020−3030−4040−5050−6060−7070−80Frequency 12 16 32 52 42 32 18 12
View SolutionFor the following frequency distribution draw a cumulative frequency curve of 'more than type' and hence obtain the median value [Class0−1010−2020−3030−4040−5050−6060−70Frequency515202317119]
View SolutionFind the missing frequency of the group 20-30 when the median is 28.
Class Interval0−1010−2020−3030−4040−50Frequency 5 8 ? 16 6
View Solution