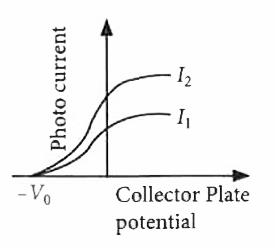
From the following graph of photo current against collector plate potential, for two different intensities of light I1 and I2, one can conclude
 Solution in Kannada
I1=I2
I1>I2
I1<I2
Comparison is not possible
The correct Answer is:C
For a given frequency of incident radiation, the photo current is directly proportional to the intensity of light i.e., I2>I1

Topper's Solved these Questions
Similar Questions
A proton beam enters a magnetic field of 10−4 Wb m−2 Wb normally. If the specific charge of the proton is 1011 C kg−1 and its velocity is 109 m s−1 then the radius of the circle described will be
View SolutionThe energy equivalent to a substance of mass 1 g is
View SolutionThe curves (a),(b),(c) and (d) show the variation between the applied potential difference (V) and the photoelectric current (i) , at two different intensities of light (I1>I2). In which figure is the correct variation shown ?
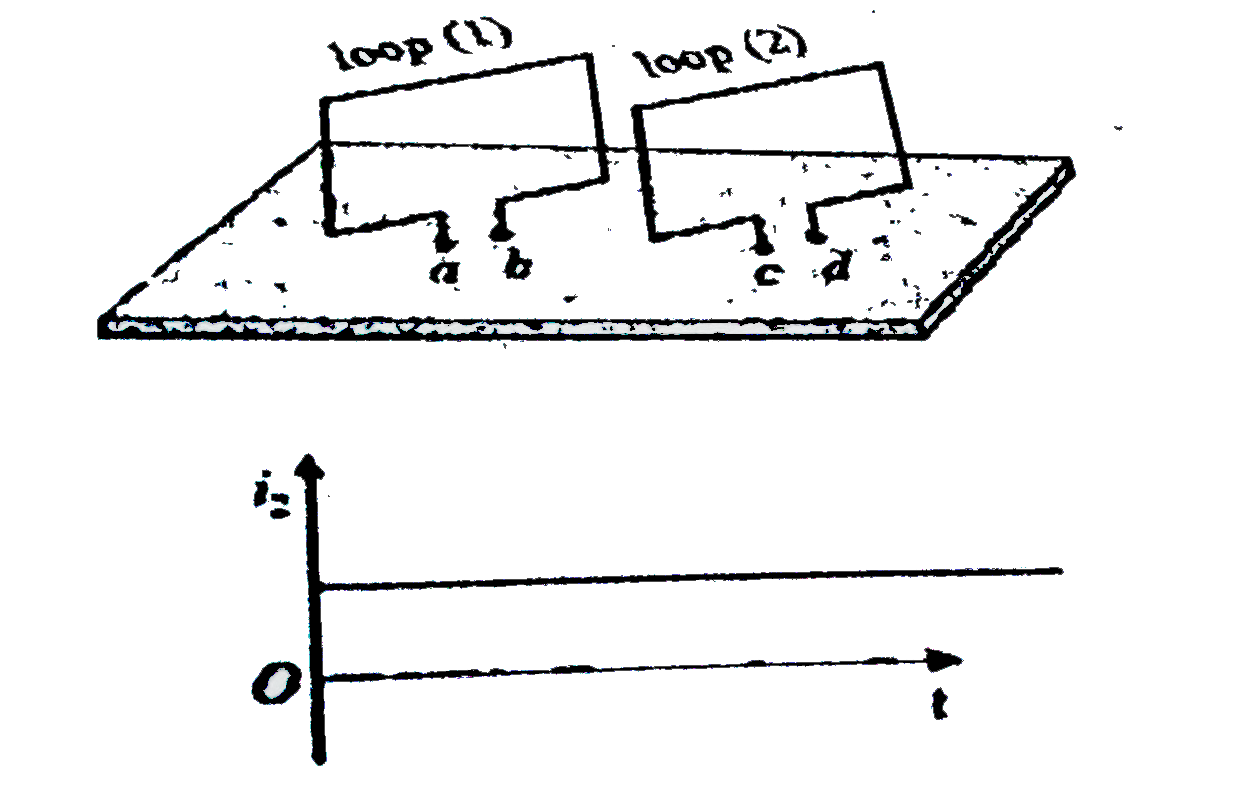
View SolutionAn electric current i_(1) can flow either direction through loop (1) and induced current i_(2) in loop (2). Positive i_(1) is when current is from 'a' to 'b' in loop (1) and positive i_(2) is when the current is from 'c' to 'd' in loop (2) In an experiment, the graph of i_(2) against time 't' is as shown below Which one(s) of the following graph could have caused i_(2) to behave as give above.
View SolutionAn electric current i1 can flow in either direction through loop-1 and induced current i2 in loop-2. Positive i2 is when current is from 'a' to 'b' in loop-1 and positive i2 is when the current is from 'c' to 'd' in loop-2. In an experiment, the graph of induced current i2 against time 'r' is shown in figure-5.291. which one of the following graphs options for current i1 could have caused i2 o behave as shown:

View SolutionA photoelectric experiment is performed at two different light intensities I1andI2(I2>I1). Choose the correct graph showing the variation of stopping potential versus frequency of light.
View SolutionPlota graph showing the variation of photo current vs collector potential for three difference intensities I1>I2>I3 two of which (I2 and I2) have the same frequency v and the third has frequency v1>v.
View SolutionFrom the following graph of photocurrent against collector plate potential for two different intensities of light I_1 and I_2 one can , conclude
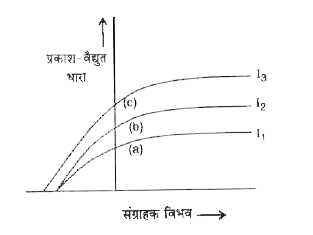
View Solutionचित्र में संग्राहक विभव एवं प्रकाश वैधुत धारा के मध्य तीन वक्र (a), (b) व (c) प्रदर्शित हैं | तीनों वक्रों के संगत प्रकाश की तीव्रताएँ क्रमशः I1,I2 व I3 हैं आवृत्तियाँ , क्रमशः v1,v2

व हैं | दो ऐसे वक्र चिन्हित कीजिए जिनकी आवृत्ति समान हो परन्तु तीव्रता भिन्न हो |
View SolutionFrom the following graph of photocurrent against collector plate potential, for two different intensities of light I_1 and I_2 one can conclude.
View SolutionDraw suitable graphs to show the variation of photoelectric current with collector plate potential for (i) a fixed frequency but different intensities I_(1) gt I_(2) gt I_(3) of radiation. (ii) a fixed intensity but different frequencies v_(1) gt v_(2) gt v_(3) of radiation.
View SolutionFrom the following graph of photo current against collector plate potential, for two different intensities of light I_1andI_2, one can conclude
View SolutionThe curves (a),(b),(c) and (d) show the variation between the applied potential difference (V) and the photoelectric current (i) , at two different intensities of light (I1>I2). In which figure is the correct variation shown ?
View SolutionFrom the following graph of photocurrent against collector plate potential for two different intensities of light I_1 and I_2 one can , conclude
View SolutionThe curves (a), (b), (c) and (d) show the variation between the applied potential difference (V) and the photoelectric current (i), at two different intensities of light (I_(1) >I_(2)). In which figure is the correct variation shown
View Solution
