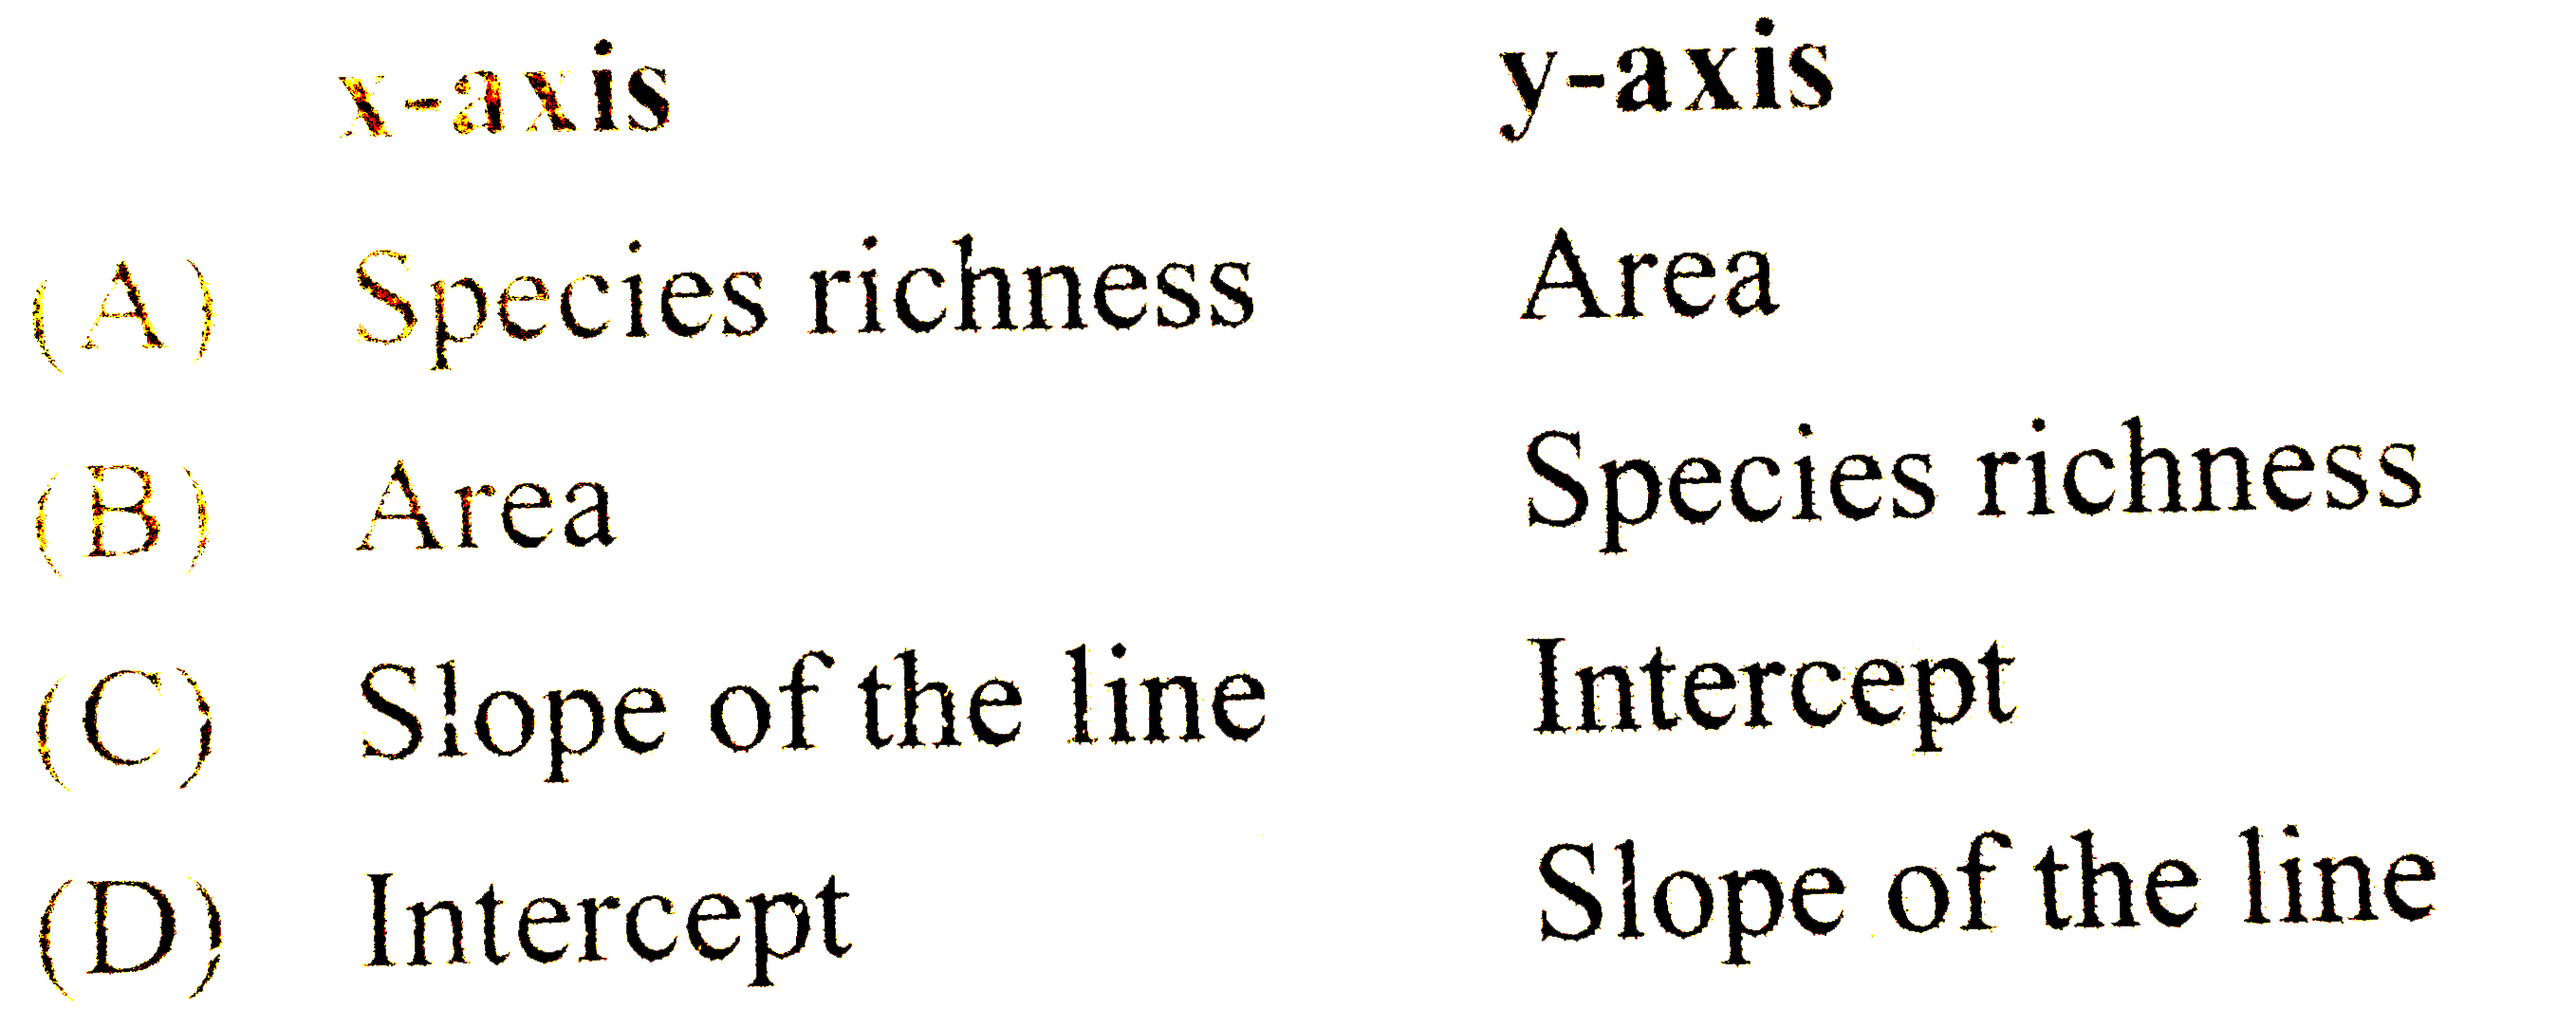
In the plot of the species-area relationship the x and y axess represents

Video Solution
Text Solution
The correct Answer is:B
See Answer for Q.45.
|
Similar Questions
Knowledge Check
Species area relationship was given by
AAlexander von HumboldtBPaulCMayerDBoth (a) and (b)Species-Area relationship was given by
ABritish zoologist and geographer David TilmanBGerman botanist and geographer Alexander von HumboldtCGerman naturalist and geographer Alexander von HumboldtDBritish naturalist and geographer Alexander von HuboldtIn the equation of the species - area relationship , the letter 'C' and 'Z' represent:
AC = Regression coefficient , Z = Y - interceptBC = Slope of the line, Z = Regression coefficientCC = Y - intercept , Z = Slope of the line (regression coefficient)DBoth (B) and (C)
Species area relationship was given by :-
View SolutionAccording to the concept of species-area relationship.
View SolutionThe relationship y=3x is best represent at :
View SolutionThe hyperbolic equation for the species area relationship is
View SolutionIf we analyse the species-area relationships among very large areas like the entire continents, then slope of line becomes much steeper in the range of
View Solution
