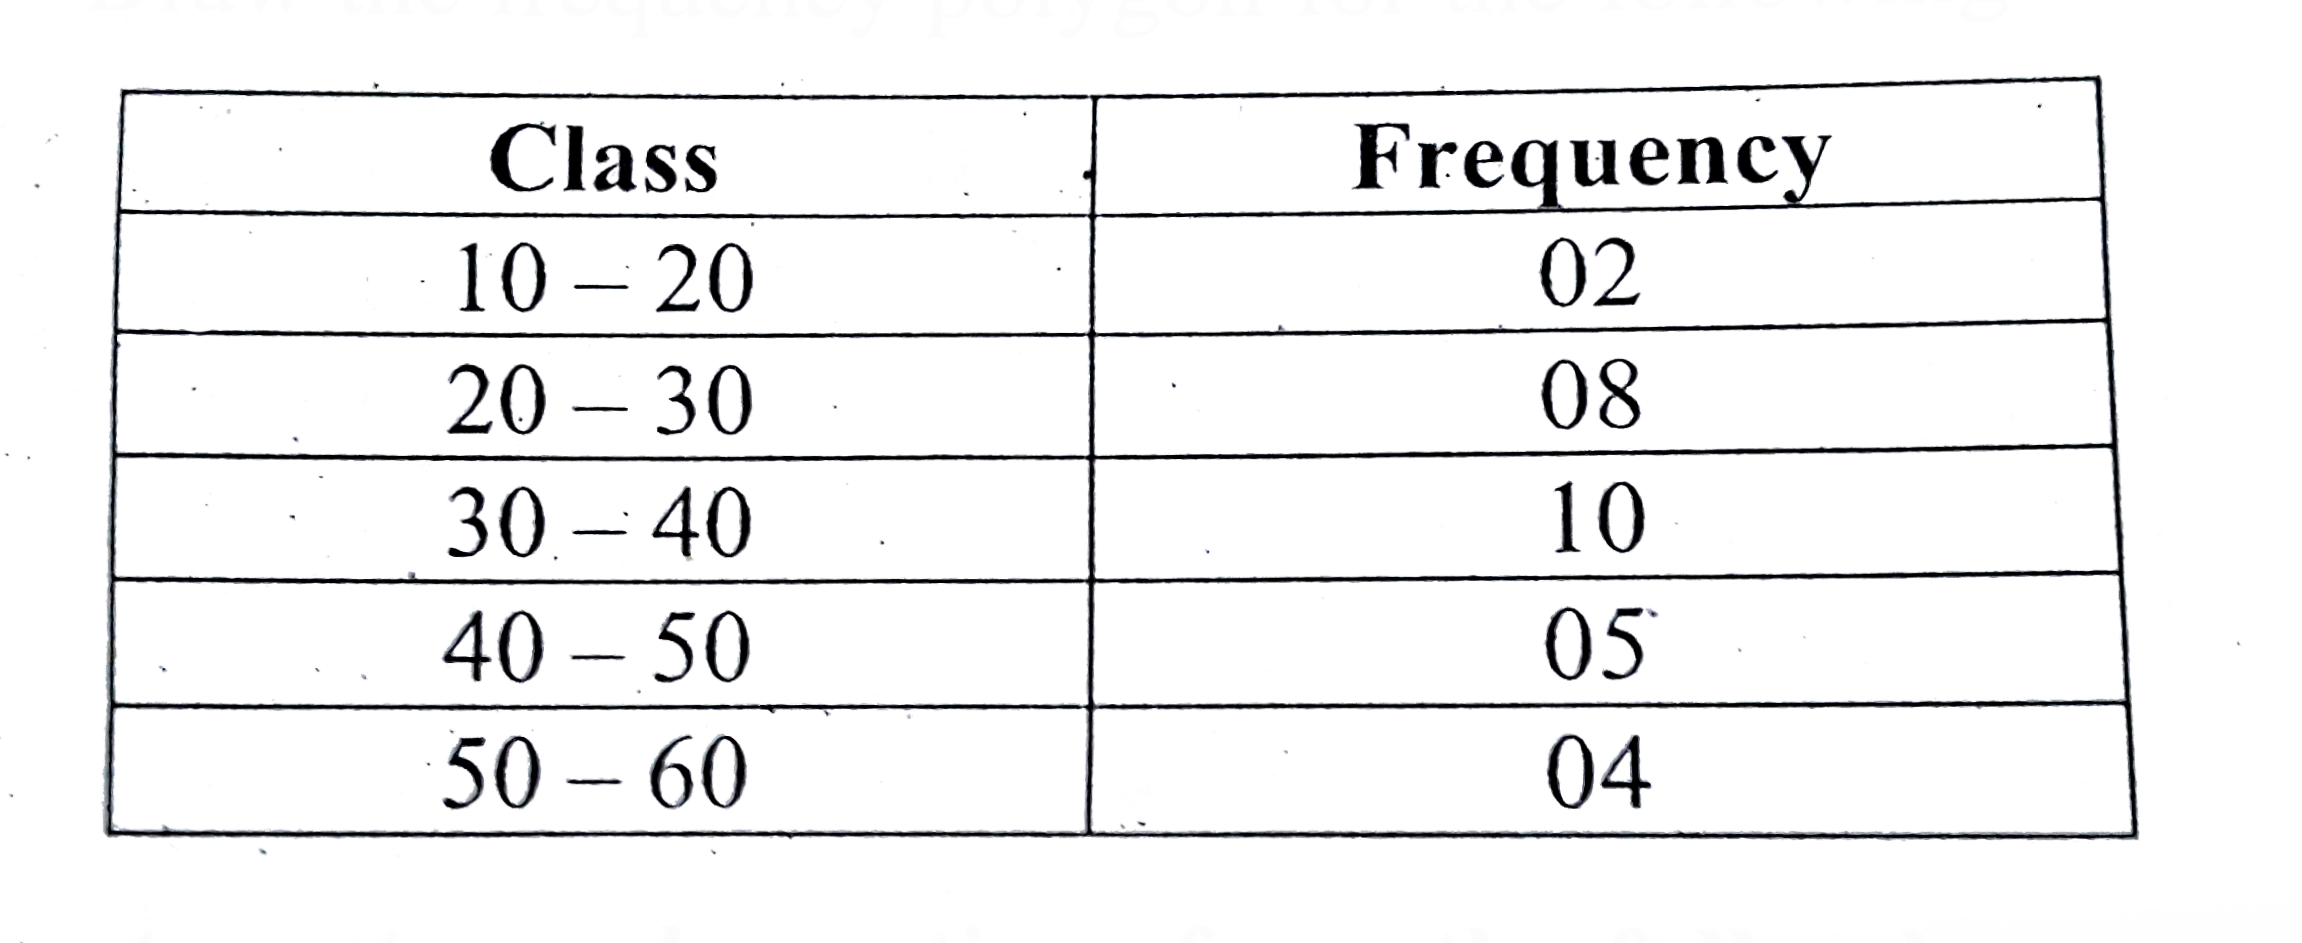
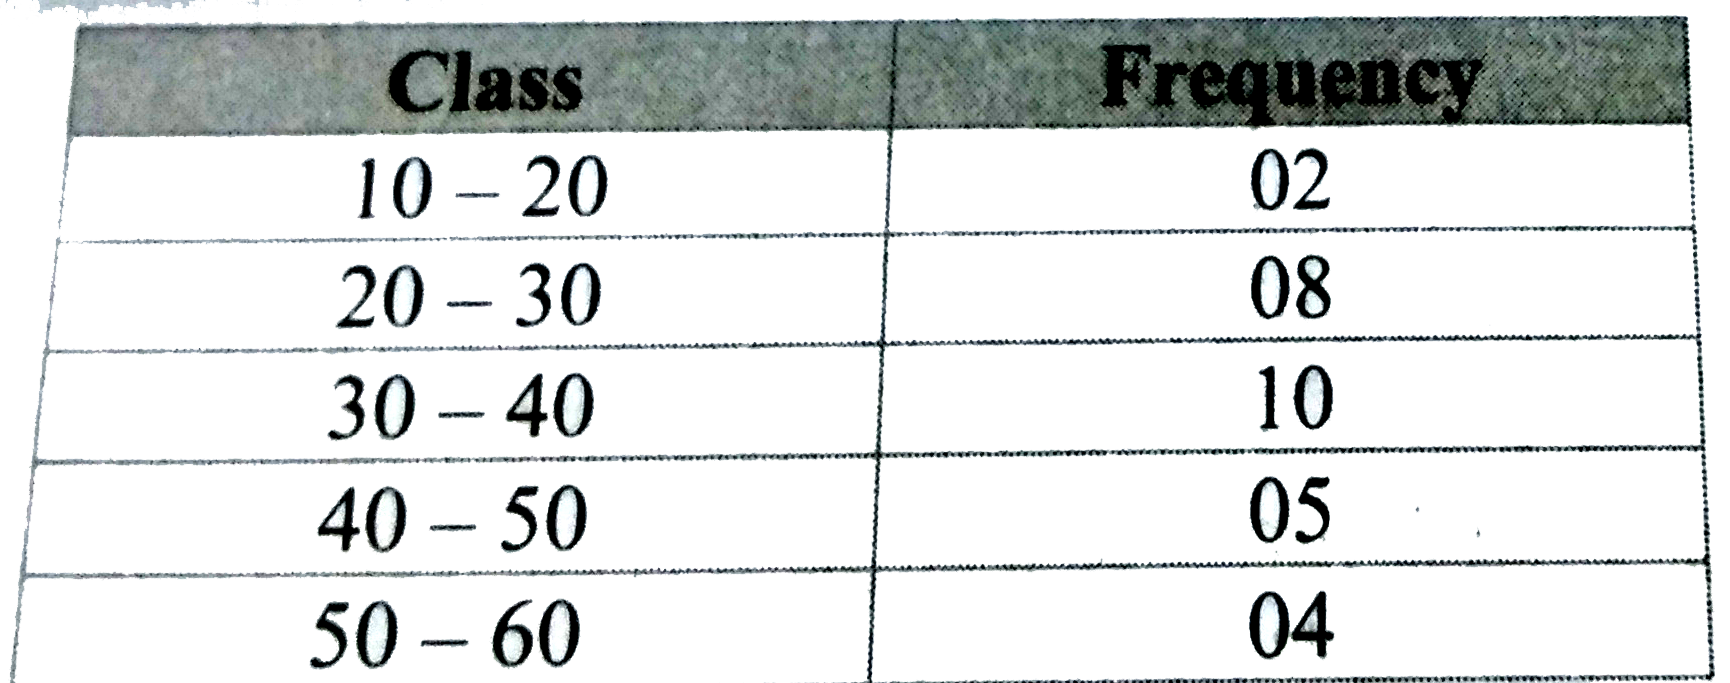
Draw the frequency polygon for the following distribution :

Step by step video & image solution for Draw the frequency polygon for the following distribution : by Maths experts to help you in doubts & scoring excellent marks in Class 10 exams.
Updated on:21/07/2023Similar Questions
Draw histogram and frequency polygon for the following distribution :

View Solution(i)Construct a histogram and frequency polygon of the following distribution :

(ii)Show that the area under frequency polygon is equal to the area under histogram.
View SolutionDraw the frequency polygon for the following frequency distribution:

View SolutionDraw a frequency polygon for the following frequency distribution:

View SolutionDraw frequency polygon for the following frequency distribution.

View SolutionDraw the frequency polygon for the following data by drawing a histogram:
Class Intervalf 0−510 5−1020 10−1515 15−2030 20−2532 25−3044
View SolutionDraw a frequency polygon for the following frequency distribution.

View SolutionDraw an OGIVE and the cumulative frequency polygon for the following frequency distribution by less than method
View SolutionConstruct the frequency polygon for the following data:

View SolutionDraw a less than cumuative frequency curve (ogive) for the following distribution :

View Solution