Given below is the bar diagram showing the age structure of three countries. Aswer the following question by analysing the diagrams.
Hint : Population strength of community is determined by the age group.

a. which country has the highest populatin ?
b Which country has declining population
One of countries has stable population justify.
a. C (b ) A. (c ) B
the country B has a stable population due to same percentage of reproductive and pre - reproductive members.
Topper's Solved these Questions
- ORGANISMS AND POPULATIONS BOOK - NEW JOYTHI PUBLICATIONCHAPTER - ORGANISMS AND POPULATIONS EXERCISE - Questin from Previous HSE
11 Videos
- ORGANISMS AND POPULATIONS BOOK - NEW JOYTHI PUBLICATIONCHAPTER - ORGANISMS AND POPULATIONS EXERCISE - Previous Entrance Exam Corner
27 Videos
- ORGANISMS AND POPULATIONS BOOK - NEW JOYTHI PUBLICATIONCHAPTER - ORGANISMS AND POPULATIONS EXERCISE - New Evaluation Types Question
27 Videos
- MOLECULAR BASIS OF INHERITANCEBOOK - NEW JOYTHI PUBLICATIONCHAPTER - MOLECULAR BASIS OF INHERITANCEEXERCISE - PREVIOUS YEAR COMPETITIVE EXAM QUESTIONS
72 Videos
- PRINCIPLES OF INHERITANCE AND VARIATION BOOK - NEW JOYTHI PUBLICATIONCHAPTER - PRINCIPLES OF INHERITANCE AND VARIATION EXERCISE - PREVIOUS YEAR COMPETITIVE EXAM QUESTIONS
72 Videos
Similar Questions
a. Military person are used to wear uniform green colour with marks of leaves and twigs .some brids and butterflies are showing markings and scars same as that of the surroundings.
b. Concealing form and coluration enable some organsim to aviod its natural predation .Explain the behavioural strategies of such organisms.
View SolutionThe study of trends in human population growth and the prediction of future development is know as
View SolutionStudy the relationship of the given pair and fill up the blanks
a. Hibernation : Bears : : Aestivation : …………
b. Whide range of salinity : Euryhaline : Narrow range of salinity : ……….
View SolutionDNA synthesis takes place during
View SolutionEpistatic effect in which the dihybrid cross AaBb * AaBb resulting in the ratio 12:3:1 is due to___________.
View SolutionWhich of the three countries has highest percentage of population above poverty line ?
View Solutionनीचे दिए गए दण्डालेख के आधार पर निम्नलिखित प्रश्नों के उत्तर दें।
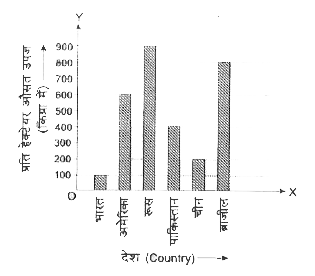
(i) सबसे अधिक उपज किस देश में हुआ?
(ii) किस देश में प्रति हेक्टेयर उपज निम्न रहा?
(iii) किस देश में प्रति हेक्टेयर उपज 400 किग्रा रहा?
View SolutionThe table below shows the distribution of number of people living in 8 different countries and the per capita income of each of the countries. The total population of these countries taken together is 200 crores. Per capita income= total GDP of country/population of the country.
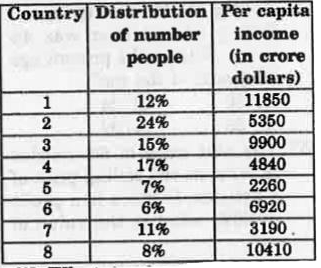
Which country has the highest total GDP?
View SolutionGiven above is the bar diagrams showing age structure of three different populations. Select stable population. (B) Compare the nature of population growth in A,B, C.
View SolutionGiven above is the bar diagram showing age structure of three different populations. Observe the diagram carefully and answer the following questions. Select the stable population.
View SolutionThe following diagrams show the age structure of three countries. By analysing the diagram answer the following qusestions.
a) Which country has the highest population?
b) Select the country with declining population.
c) Which country has stable population? Give justification.
'(##VPU_HSS_BIO_XII_C13_E02_012_Q01##)'
View SolutionA country that has a stable population is characterized by an age structure that is _________________
View SolutionThe table below shows the distribution of number of people living in 8 different countries and the per capita income of each of the countries. The total population of these countries taken together is 200 crores. Per capita income= total GDP of country/population of the country.

Which country has the highest total GDP?
View SolutionThe bar graph shows the population of different countries. Study the diagram and answer the following questions.
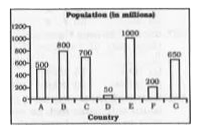
Which country has the second highest population?
View SolutionThe bar graph shows the population of different countries. Study the diagram and answer the following questions.
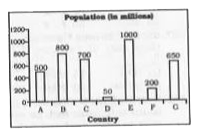
What is the ratio of population of country A to that of country G?
View SolutionThe bar graph shows the population of different countries. Study the diagram and answer the following questions.
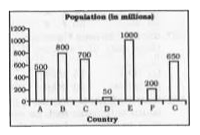
Population of country E is greater than that of country A by _____.
View Solution

