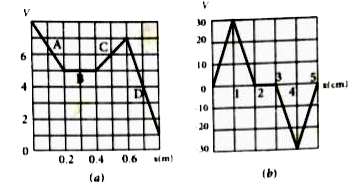
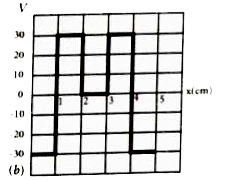
The electrostatic potential is given as a function of x in figure ( a) and (b) . Calculate the corresponding electric fields in regions A, B, C and D . Plot the electric field as a function of x for the figure (b).
 Solution in Tamil
The relation between electric field and potential
E=−dvdx
(a) Region A: dv = - 3V , dx = 0.2 m
Electric field EA=−(−3)0.2=15Vm−1
Region B: dv= 0V , dx = 0.2 m
Electric field EB=−00.2=0
Region C: dv = 2V, dx =0.2 m
Electric field EC=−20.2=10Vm−1
Region D: dv= -6 V, dx =0.2 m
Electric field ED=−(−60.2)=30Vm−1
EA=15Vm−1 EB=0 Ec=10Vm−1 ED=30Vm−1
(b) 
Similar Questions
Figure shows a plot of the conservative force F in a unidimensional field. The plot representing the function corresponding to the potential energy (U) in the field is
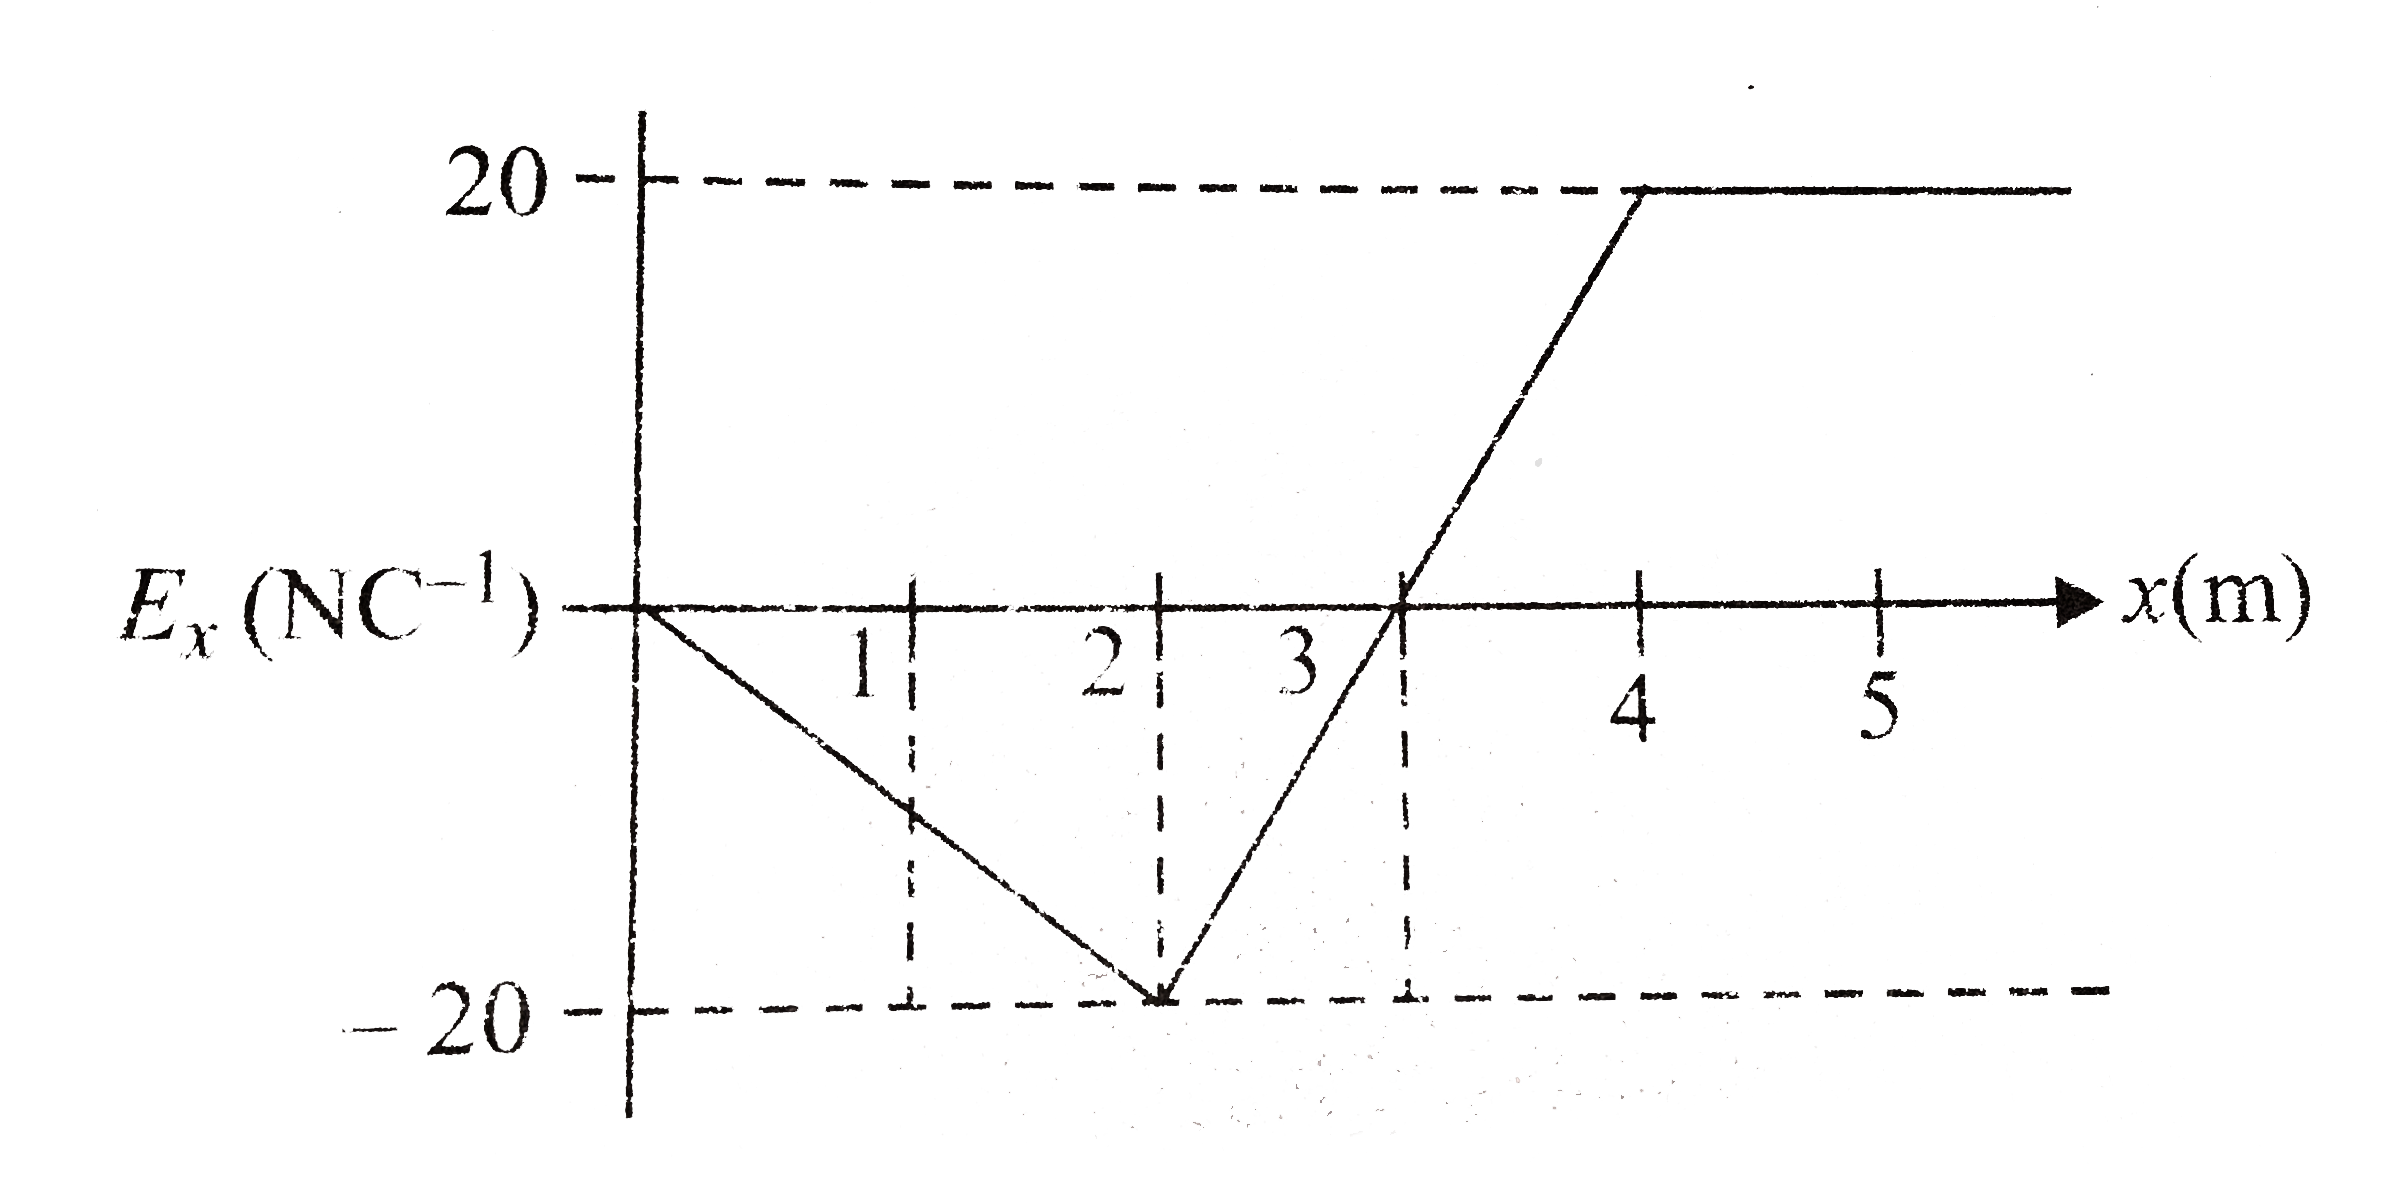
View SolutionA graph of the x-component of the electric field as a function of x in a region of space is shown in figure. The y−andz−compo≠nts of the electric field are zero in this region. If the electric potential is 10 V at the origin, then the potential at x = 2.0 m is

View SolutionThe variation of electric field on the y-axis as a function of 'y' is best represented by [for the given figure]: A. B C. D.
View SolutionA region in electric field is specified by the potential function V(x)= 4x^(2)
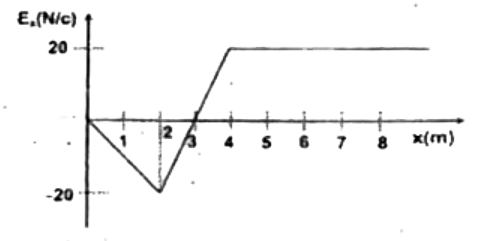
View SolutionA graph of the x-component of the electric field as a function of x in a region of space is shown in figure. The y- and z-components of the electric field are zero in this region. If the electric potential is 10 V at the origin, then the potential at x = 2.0 m is
View SolutionA graph of the x-component of the electric field as a function of x in a region of space is shown in the figure. They y and z-components of the electric field are zero in this region. The electric potential at the origin is 10 V. The value of x for which potential is zero is

View Solution(a) Electric dipole moment
(b) Electric field intensity
(c) Electric potential difference
(d) Electrostatic shielding
View SolutionFigure shows a plot of the conservative force F in a unidimensional field . The plot representing the function corresponding to the potential energy ( U) in the field is
View Solution

